
ABSTRACT
The Paris Agreement establishes an international covenant to reduce emissions in line with holding the increase in temperature to ‘well below 2°C … and to pursue … 1.5°C.’ Global modelling studies have repeatedly concluded that such commitments can be delivered through technocratic adjustments to contemporary society, principally price mechanisms driving technical change. However, as emissions have continued to rise, so these models have come to increasingly rely on the extensive deployment of highly speculative negative emissions technologies (NETs). Moreover, in determining the mitigation challenges for industrialized nations, scant regard is paid to the language and spirit of equity enshrined in the Paris Agreement. If, instead, the mitigation agenda of ‘developed country Parties’ is determined without reliance on planetary scale NETs and with genuine regard for equity and ‘common but differentiated responsibilities and respective capabilities’, the necessary rates of mitigation increase markedly. This is evident even when considering the UK and Sweden, two nations at the forefront of developing ‘progressive’ climate change legislation and with clear emissions pathways and/or quantitative carbon budgets. In both cases, the carbon budgets underpinning mitigation policy are halved, the immediate mitigation rate is increased to over 10% per annum, and the time to deliver a fully decarbonized energy system is brought forward to 2035-40. Such a challenging mitigation agenda implies profound changes to many facets of industrialized economies. This conclusion is not drawn from political ideology, but rather is a direct consequence of the international community’s obligations under the Paris Agreement and the small and rapidly dwindling global carbon budget.
Key Policy Insights
Without a belief in the successful deployment of planetary scale negative emissions technologies, double-digit annual mitigation rates are required of developed countries, from 2020, if they are to align their policies with the Paris Agreement’s temperature commitments and principles of equity.
Paris-compliant carbon budgets for developed countries imply full decarbonization of energy by 2035-40, necessitating a scale of change in physical infrastructure reminiscent of the post-Second World War Marshall Plan. This brings issues of values, measures of prosperity and socio-economic inequality to the fore.
The stringency of Paris-compliant pathways severely limits the opportunity for inter-sectoral emissions trading. Consequently aviation, as with all sectors, will need to identify policies to reduce emissions to zero, directly or through the use of zero carbon fuels.
The UK and Swedish governments’ emissions pathways imply a carbon budget of at least a factor of two greater than their fair contribution to delivering on the Paris Agreement’s 1.5-2°C commitment.
1. Introduction
The 2015 Paris Agreement established an unprecedented international covenant to hold ‘the increase in the global average temperature to well below 2°C… and to pursue efforts to limit the temperature increase to 1.5°C.’ (UN, Citation2015). Whilst the precise legal reading of the Agreement remains open to interpretation, this paper takes world leaders’ commitments, and their accompanying speeches (G7, Citation2016; Lövin, Citation2018; May, Citation2017), at face value, comparing the national (territorial) mitigation strategies of two ‘climate progressive’ nations (UK and Sweden) against the demands enshrined in the Paris Agreement.Footnote1
The language of ‘well below 2°C’ is interpreted here as implying an absolute duty, whilst to ‘pursue … 1.5°C’ is regarded as aspirational intent. Key to delivering on the Paris Agreement is the recognition that peaking emissions ‘will take longer for developing country Parties’ (Paris Agreement Article 4.1). This draws an important distinction, through the principle of ‘common but differentiated responsibilities and respective capabilities’ (CBDR&RC), between the expected mitigation efforts of different nations (e.g. Article 4.1 and 4.4).
Against this backdrop, and with a focus on energy-related CO2 emissions, this paper uses carbon budgets as a guide to define the 1.5–2°C mitigation challenge, and to quantify budget allocations between ‘developed’ and ‘developing’ country Parties. To facilitate comparison between Parties, the carbon budget assumptions are presented clearly and directly.
Significantly, the analysis excludes planetary-scale negative emissions technologies (NETs). Certainly, there are strong arguments for the research, development and potential deployment of NETsFootnote2, but their ubiquitous inclusion at the scale assumed in IPCC mitigation scenarios (Fuss et al., Citation2014), including within the UK and Sweden’s climate strategies, is premature (Larkin, Kuriakose, Sharmina, & Anderson, Citation2018). The profound implications of assuming NETs at scale and of failing to differentiate mitigation efforts between the developed and developing country Parties are key issues explored within this paper (Appendix A details the reasoning for excluding NETs).
2. Carbon budgets as a guide to Paris-compliant mitigation
The concept of carbon budgets has, for over a decade, underpinned mitigation studies (Allen et al., Citation2009; Anderson & Bows, Citation2011; Bows, Mander, Starkey, Bleda, & Anderson, Citation2006; Knutti & Rogelj, Citation2015; Raupach et al., Citation2014; Rockström et al., Citation2017) and offered a robust scientific foundation for informing mitigation policies (Matthews, Zickfeld, Knutti, & Allen, Citation2018).
Following the Paris Agreement’s inclusion of ‘pursuing efforts to … 1.5°C’, the Conference of the Parties (COP) to the United Nations Framework Convention on Climate Change (UNFCCC) requested the Intergovernmental Panel on Climate Change (IPCC) to consider the impacts of 1.5°C of warming and the related emissions pathways. The subsequent 2018 Special Report, Global Warming of 1.5°C (IPCC Citation2018, SR1.5), presents a simplified table of carbon budgets against temperature (Table 2.2, Chapter 2), similar to that contained in the IPCC’s earlier Fifth Assessment (AR5) Synthesis Report (Table 2.2; IPCC, Citation2014). When comparing the IPCC reports, the tabulated budget values are substantially larger in SR1.5, by around 60% and 250%, respectively, for the 67% chance of staying below 2°C and 1.5°C.
Differences in carbon budgets for a given probability of a given temperature threshold arise for several reasons. SR1.5 budgets are summed to the point of net-zero global CO2 emissions, whilst AR5 budgets were summed to the point of reaching a given temperature change. Further, SR1.5 budgets are based on the transient climate response to cumulative carbon emissions (TCRE), a measure of warming for a given quantity of CO2 which can be informed by observations. The impact of non-CO2 greenhouse gases (GHGs) and aerosols assumed for the twenty-first century is estimated separately to CO2, along with the choice of model for assessing their warming effect. The Earth System Models (ESMs) used by AR5 include a range of climate feedbacks. Such feedbacks are estimated separately in SR1.5, suggesting a reduction in carbon budgets by 100 GtCO2 to 2100, with a potentially greater response following this date.
When considering mitigation strategies, it is important to be aware that carbon budgets, although offering a scientifically robust framework, are necessarily the product of a range of evolving assumptions (Rogelj, Forster, Kriegler, Smith, & Séférian, Citation2019). Provisional results suggest that the range of climate sensitivity in the forthcoming IPCC Sixth Assessment Report (AR6) may increase as improved characterization of feedbacks are included in ESMs (Belcher, Boucher, & Sutton, Citation2019). Moreover, if the observed rise in the concentration of atmospheric methane is, in significant part, a consequence of increasing methane release from warming tropical regions (Mikaloff & Schaefer, Citation2019; Nisbet et al., Citation2016), then the more optimistic non-CO2 assumptions within SR1.5 may need revisiting. In light of this, and being cognisant of the UNFCCC’s precautionary principle (Article 3.3, Citation1992), the budgets outlined in the following section should be regarded as the minimum necessary to achieve the Paris Agreement’s goals.
3. Translating the Paris agreement objectives into carbon budgets
As with the 2009 Copenhagen Accord and various intergovernmental political declarations, such as those of the G-7, the Paris Agreement adopted qualitative language to define quantitative temperature limits. Whilst the exact wording within such documents has varied, it would be disingenuous to suggest anything other than an international consensus aligned with, at the very least, a ‘likely’ chance of remaining below 2°C. The Paris Agreement’s inclusion of 1.5°C significantly ramped up this commitment, tightening still further the acceptable likelihood of remaining well below 2°C, if not 1.5°C.
In its guidance to authors, the IPCC (Citation2010) provides a taxonomy of likelihoods that can be used to translate qualitative language into quantitative probabilities. Progressing a sequential logic from the language of the Paris Agreement through the IPCC’s scale of likelihoods conservatively transposes the Agreement into somewhere between a ‘likely’ (66–100% probability) chance of reaching 2°C and ‘about as likely as not’ (33–66%) for 1.5°C. Working from this, a carbon budget of 900 GtCO2 (from January 2018) is adopted here to reflect the Paris Agreement’s temperature objectives. SR1.5 relates 900 GtCO2 with a likely peak warming of 1.7°C above a 1850–1900 baseline (Table 2.2, IPCC Citation2018), with an equal expectation of temperature change being higher and lower, reflecting the intention to ‘hold the increase in the global average temperature to well below 2°C’. The likelihood of remaining below 1.5°C is less than 33%, with smaller budgets facing proportionally larger uncertainties, aside from the observed TCRE uncertainty. By considering a larger budget the proportionate impact of these uncertainties is reduced, though remains substantial.Footnote3
Subsequently, a deduction is made of 100 GtCO2 from Earth system feedbacks (based on SR1.5) along with two years (2018/19) of fossil fuel and cement process emissions (assuming a growth rate of, respectively, 2.0% and 1.6% (Korsbakken, Andrew, & Peters, Citation2019)) and static CO2 emissions from land use, land-use change and forestry (LULUCF) using a 2017 baseline (Global Carbon Project, Citation2018). These sum to 84 GtCO2, giving a global ‘Paris-compliant’ carbon budget, for all CO2 sources, and from the start of 2020, of 716 GtCO2.
3.1. Global overheads for cement and land use change and forestry
This paper specifically focuses on carbon emissions arising from energy, ultimately disaggregating a Paris-compliant global carbon budget to nations, with the UK and Sweden as two case studies. Consequently, it is necessary to remove the prospective cumulative emissions associated with non-energy sources of CO2. These are dominated by two sources: emissions released from chemical reactions during cement production (i.e. process emissions) and those arising from ongoing deforestation. Typically, emissions from these sources are, implicitly at least, held to be the sole responsibility of the country of origin. Here, however, informed by the principle of CBDR&RC, such emissions are considered as a ‘global overhead’. The specific ethical reasons for this choice are detailed in the following subsections 3.1.1 and 3.1.2. The implication of this approach is that the responsibility for these non-energy emissions is distributed amongst all nations, and not solely those developing country parties from where the majority of such emissions arise. This approach extends the incentive to address cement process and deforestation emissions to all nations, as failure to mitigate them reduces each nation’s energy-only carbon budget; that is, the higher the global non-energy emissions of CO2, the smaller the energy-only global carbon budget, and hence its apportionment between nations.
3.1.1. Future emissions from cement production
The majority of developed country Parties already have extensive cement-rich infrastructures. By contrast, many developing country Parties are either undertaking, or just beginning, major infrastructure programmes. The cement intensity of new infrastructure can be reduced through material substitution, alternative clinkers and more resource-efficient designs (IEA, Citation2018). Even with such changes, the portfolio of scenarios assessing the prospects of cement envisage ongoing global growth in the sector, driven in large part by infrastructure programmes within emerging and developing countries (IEA, Citation2018; van Ruijven et al., Citation2016).
As it stands today, the difference in the cement intensity (i.e. kg-cement/person-year) between developed countries with mature infrastructure and those developing nations rapidly constructing such infrastructure, ranges between a factor of two and five (see Appendix B for more detail). Put simply, whilst there are, at scale, substitutes for fossil fuel energy, as yet there are no such substitutes, at scale, for cement. Consequently, and given the key role of cement in facilitating development, penalizing poorer and industrializing nations for rapid infrastructure expansion runs counter to the concept of CBDR&RC.
Nevertheless, whilst ethical considerations are important, the global cement industry cannot be exempt from deep and rapid decarbonization. The inclusion here of the cement sector as a ‘global overhead’ does not exempt nations with high cement use from seeking to reduce process emissions, rather it puts pressure on the global industry to rapidly curtail its emissions. Failure to do so only puts further downwards pressure on global, and hence national, energy-only carbon budgets that are already at the threshold of what is achievable.
The IEA’s Cement Technology Roadmap (Citation2018) provides a core scenario for global cement growth. This scenario not only breaks from the historical precedent of cement as a key manufactured material, but also assumes the rapid uptake of low-carbon technologies, including carbon capture and storage (CCS), across the sector. Despite reservations as to the appropriateness of the IEA scenario, it is their 2DS low-carbon road map, subsequently extrapolated to complete decarbonization by 2075, that informs the analysis here. This extended road map equates to a total carbon budget, from 2020 onwards and for cement-based process emissions only, of a highly optimistic 60 GtCO2 (Appendix B details this estimate and the reservations with the IEA analysis).
The scale of ambition implied by the extrapolated IEA roadmaps requires an immediate and concerted global effort by the cement industry, with much lower rates of growth and elimination of all process emissions by 2075. If, instead, the sector grows in line with its post-2000 or post-2010 average annual rates of 5.1% and 3.4% (and assuming the IEA’s carbon-intensity improvement) then, respectively, the sector’s 2020–2075 process emissions would be 140 and 100 GtCO2. This would have major implications for energy decarbonization rates, potentially making Paris-compliant carbon budgets unachievable.
3.1.2. Future emissions from deforestation
Prior studies have excluded LULUCF, noting that this sector makes up a small and declining fraction of emissions with high measurement uncertainty (Raupach et al., Citation2014; Robiou du Pont, Jeffery, Gütschow, Christoff, & Meinshausen, Citation2016). However, the equity-based arguments made for allocating cement process emissions as a global overhead (i.e. no alternative at scale) rather than the sole responsibility of individual nations, similarly hold for emissions arising from deforestation. In the process of industrialization, many developed country Parties underwent significant levels of deforestation accessing land for agriculture and development (Ramankutty & Foley, Citation1999). Placing all responsibility for current deforestation emissions on those developing country Parties following similar patterns of industrialization is inconsistent with the equity steer of the climate change regime, and more specifically the core principle of CBDR&RC. Further reinforcing this global overhead argument is the fact that two of the key drivers for deforestation are globalized agricultural and, to a lesser extent, timber markets,Footnote4 alongside more multifaceted and regional factors.
Considering deforestation emissions as a global overhead does not absolve deforesting nations from responsibility. It does, however, reduce the burden on them, providing an incentive for all nations to encourage a global reduction in deforestation, not least because the lower the total emissions from deforestation, the greater the available global carbon budget for the energy sector.
Given that this paper is premised on a global decarbonization agenda consistent with the Paris Agreement, it is assumed here that there is an increased emphasis on rapidly reducing and ultimately eliminating LULUCF emissions. Beyond this, it is anticipated that a programme of ambitious net carbon sequestration is pursued across global forests, such that between 2020 and 2100, emissions from deforestation and degradation are balanced by the carbon uptake in managed LULUCF sequestration. As such, within this analysis the post-2020 global carbon budgets are unaffected by the dynamics of forestry carbon emissions and sequestration.Footnote5 Consequently, and with the explicit and highly optimistic assumptions on cement, the Paris-compliant global carbon budget for energy-only emissions reduces to 656 GtCO2 from 2020 onwards.
4. Apportioning the global carbon budget
This paper develops a pragmatic apportionment regime, building on Anderson and Bows (Citation2011). Ambitious peak dates and mitigation rates for developing country parties are considered first, before proposing pathways within the total global carbon budget constraint. This resource sharing approach recognizes principles of equity in that it allows for a delayed emissions peak and lower initial mitigation rates for the developing country Parties, but only to the degree that these are still physically possible to deliver within a Paris-compliant global carbon budget. A more precise reading of the principle of CBDR&RC, would suggest such an approach falls far short of an equitable sharing of the climate burden, but it does provide a useful complementary analysis to other ‘effort sharing’ regimes, such as The Climate Equity Reference Framework (Holz, Kartha, & Athanasiou, Citation2017).
4.1. Classification of developed & developing country parties
The Paris Agreement recognizes ‘that peaking will take longer for developing country Parties’, and, throughout the text, draws specific attention to the ‘least developed countries and small island developing States’. The precise nomenclature separating developed from developing nation groups has evolved since the UNFCCC’s differentiation of Parties between Annex I and non-Annex I, which was also carried over to the 1997 Kyoto Protocol. However, the international climate negotiations continue to embed differential mitigation efforts between developed and developing country Parties. Although UNFCCC preambular language referring to historical responsibility was not included in the Paris Agreement, the principle of CBDR&RC did remain (recitations, Article 2 para 2, Article 4 paras 3 and 19), albeit with the qualifier ‘in light of national circumstances’, as do references to equity and developed country leadership.
Within the Paris Agreement and the texts of subsequent COP decisions, the nations comprising developing and developed country Parties are not specified. Elsewhere, and in relation to climate change, the UN system tends to equate developing country parties with the ‘G77 and China’ grouping (a total now of 134 nations).Footnote6 It is this distinction between developed and developing nations, that informs the approach adopted here. However, the boundary of this distinction requires clarification as there are a small numer of G77 countries with inconsistent development rankings, alongside a similarly small set of nations excluded from any classification.
To reveal the implications of such anomalies on the apportionment of the global budget to developing and developed country Parties, two pairs of adjusted classifications are here proposed. The first allocates nations excluded from any UN classification to either the developed or developing country Parties; this gives two new groups, Developed 1 (DD1) and Developing 1 (DG1). The second re-allocates those few oil-rich wealthy nations still classified as developing, but with GDP per capita and human development index (HDI) values well above the mean of developed nations. This gives rise to two more groups DD2 and DG2, full details of which are in Appendix C.
Within both the DG1 and DG2 groupings, the carbon budget of China dominates, masking how many poorer nations will inevitably peak their emissions later than China. This differentiation within the developing country Parties does not, however, detract from the reasoning for drawing a distinction between developed and developing. Considering China in isolation, its relative economic output demonstrates just how far removed it still is from the developed group (DD2), with a GDP per capita of just 23% of that for DD2 (39% using PPP) or just 14% when compared with the USA (28% PPP basis).
4.2. CO2 pathways for developing nations and budget implications for developed nations
Heuristic CO2 pathways are first generated for developing country Parties (DG1 and DG2), informed by the Paris Agreement’s framing of equity and, through a process of iteration, within a set of associated constraints.Footnote7 Pathways progress from current rates of growth, through a 2025 peak in emissions, increasing to a maximum 10% mitigation rate, a timeframe and rate far more ambitious than in other similar global and national analyses (cf Arup, Citation2016; Holz et al., Citation2017; Wang & Watson, Citation2010). The pathway is for territorial fossil fuel CO2 emissions only, including bunker fuel emissions arising from international aviation and shipping. Global bunker estimates are taken as the difference between the Global Carbon Project’s (GCP, Citation2018) world emissions and the sum of all the national emissions within the GCP database. Bunker fuel emissions are subsequently apportioned to developing and developed country Parties on the basis of their respective proportion of global emissions excluding bunkers.Footnote8 This approach finds 2017 emissions to be as follows: DG1: 20.5 GtCO2; DD1 14.3 GtCO2; DG2 19.0 GtCO2; and DD2 15.8 GtCO2.
For 2018, the BP Statistical Review (Citation2019) reports global emissions to have increased by 2.0%, with a 2.9% rise in non-OECD countries (used here as an approximation for developing nations). From 2019, the pathway adopts emissions growth in line with the developing country Party five year average annual growth rate (1.8% per annum, p.a.), declining as it approaches the 2025 peak year. Beyond 2025 the pathway commences an escalating rate of mitigation, rising from at 0.1% in the first post-peak year to a 1% total reduction by year four, before increasing at 0.5% each year to a maximum of 10% p.a. 22 years after the peak, as illustrated in .
Figure 1. Fossil fuel only CO2 pathways for (a) developing country Parties, with DG1 plus 5 year plateau omitted for clarity, and (b) developing and developed country parties for groupings DG2 and DD2. DG1 and DD1 pathways are not substantially different in profile.
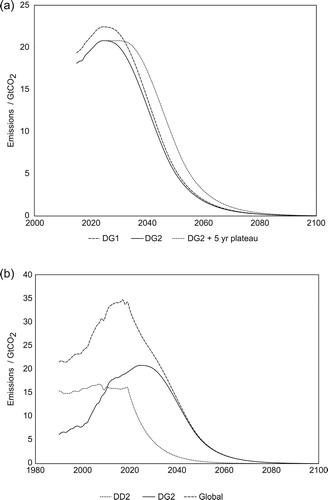
Whilst the DG1 and DG2 pathways () are highly ambitious, they nevertheless equate to cumulative emissions from 2020 of, respectively, 561 and 520 GtCO2. Consequently, even with an unprecedented departure from historical and recent emission trends, cumulative CO2 emissions solely from the developing country Parties represent 79–86% of the post 2020 Paris-compliant global carbon budget. The remaining budget range for the developed nations (DD1 and DD2) is 95 and 136 GtCO2. Transposing these budgets into annual mitigation rates suggests immediate and prolonged cuts of, respectively, 14% and 11% p.a. (b). If developing country emissions do not decline immediately after peaking, and instead plateau for 5 years, they occupy all or nearly all of the global carbon budget (673 and 624 GtCO2 for DG1 and DG2 respectively).
4.3. Apportioning the developed country Parties’ carbon budget to nations
There are various options for apportioning a finite carbon budget between countries, including population-based approaches, grandfathering and allocations founded on, for example, economic resouces and historical responsibility (Rose, Stevens, Edmonds, and Wise, Citation1998; Kanitkar, Jayaraman, D'Souza, and Purkayastha, Citation2013; Raupach et al., Citation2014; Robiou du Pont et al., Citation2016; Holz et al., Citation2017). Apportionment on the basis of population has immediate egalitarian appeal over grandfathering, especially where the levels of emissions vary significantly. However, population-based regimes overlook a range of critical parameters. They do not take account of historical emissions, capacity to finance decarbonization, renewable energy resources, the inertia of existing high-carbon and fossil-fuel infrastructure, nor the carbon-intensity of the existing economy. A more functional, comprehensive and arguably fairer amalgamation of factors can be found in grandfathering, the approach adopted here. A potential weakness of grandfathering is that it risks penalizing those nations already on a Paris-compliant pathway. In practice, however, no industrialized nation is even approaching such rates of mitigation, and even where moderate progress has been made, as in the UK, it typically excludes emissions from international aviation and shipping.
5. How near to Paris? A case study of ‘climate progressive’ developed country Parties
The Paris framework of Nationally Determined Contributions (NDCs) marks a substantial change from the earlier Kyoto Protocol, with all nations (developed and developing) submitting voluntary emission pledges. It is clear, however, that the present aggregated sum of NDCs falls far short of the Paris Agreement’s 1.5–2°C goals, (UNEP, Citation2018), with nations expected to propose revised NDCs in 2020, in preparation for the ‘Global stocktake’ of progress beginning in 2023.
As 2020 approaches, it is worthwhile assessing the progress and plans of industrialized nations heralded as ‘leading’ on mitigation. The UK and Sweden are at the vanguard of detailing primary legislation designed to frame total national emissions through direct carbon budgets (UK) and net-zero goals (UK and Sweden). Downscaling the developed country Parties’ budget from Section 4 into simple mitigation pathways, and hence decarbonization rates, provides a quantitative framework against which the UK and Sweden’s mitigation plans can be judged.
Grandfathering the energy-only CO2 budget of the developed country Parties (from a 2012–2017 baseline) allocates 3.0% (DD1) and 2.7% (DD2) to the UK and 0.30% (DD1) and 0.28% (DD2) to Sweden. To provide a simplified mitigation pathway from the start of 2020 onwards, carbon budgets are transposed into annual mitigation rates (). These pathways assume a constant rate of reduction, beginning January 2020 and maintaining total emissions within the given budgets. However, political inertia, increasing returns to scale and so-called hard-to-abate sectors suggest that it will take several years to transition from current gradual mitigation efforts to rates consistent with delivering Paris-compliant carbon budgets. Consequently, these rates of mitigation we estimate here will likely underplay the actual rates that would be required by the early to mid 2020s.
Table 1. UK and Sweden’s Paris-compliant post-2019 energy-only CO2 budget and associated minimum mitigation rates. DD is abbreviation for Developed country Parties.
5.1. CO2 emissions implicit in UK current policy pathway
The Climate Change Act (2008) established a number of government powers and responsibilities, chief among them a series of five year carbon budgets and a longer term reduction commitment for 2050. The Committee on Climate Change (CCC) was established as a statutory body to advise government on the appropriate levels of carbon budgets and to feedback progress against these and the 2050 commitment. To date, the UK has set carbon budgets to 2032 and a long term target of net-zero emissions by 2050. Emissions are currently within the limits prescribed by the first two complete carbon budgets and are expected to be below the third budget ending in 2022.
All of the Kyoto Protocol basket of six GHGs are included in the UK’s legislated carbon budgets, as are removals by land use change and the purchase of internationally traded carbon units (both reductions credits and cap-and-trade allowances). Therefore, direct comparison with the budgets and mitigation rates derived in the preceding section requires a series of adjustments. Data from the UK Department of Business, Energy and Industrial Strategy report CO2 separately; however, for the period to 2032, non-CO2 GHGs are deducted from headline carbon budgets made using the CCC Fourth Carbon Budget medium abatement scenario (CCC, Citation2010). A linear path to the 2050 CO2 values described in the Further Ambition scenario is then followed (CCC, Citation2019). International aviation and shipping emissions are not counted as a UK source within the Climate Change Act. They are added here using the Department for Transport central forecast to 2050Footnote9, assuming the construction of a new runway at Heathrow (as approved by government in 2018), and supposing a linear pathway for shipping based on the Internatinal Maritime Organisation’s (IMO) strategy to reduce emissions to 50% of 2008 levels by 2050. The CCC’s (Citation2010) central scenario for cement sector emissions is deducted to align with our global overhead for cement. All CO2 emissions remaining in 2050 are then assumed to taper to zero by 2075 (see ). This remainder sums to 670 MtCO2 or ∼7% of the 2020–2100 total.
Figure 2. National climate policy frameworks aligned to the scope of developed country pathway DD2 for (a) UK Climate Change Act for both 80% & net-zero by 2050 targets, and (b) Swedish Climate Law.
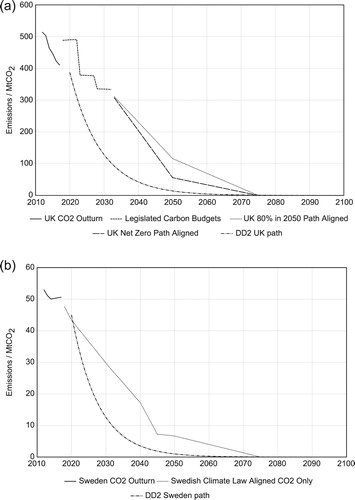
Under these assumptions, from 2020 to 2100, UK emissions total 9,000 MtCO2, more than double that of the DD2 pathway (three times the sum of the DD1 pathway). Similarly, the equivalent annual CO2 reduction rate is approximately 5% versus 10%. The Climate Change Act initially legislated for an 80% reduction from a 1990 baseline, with the 2019 alteration to a net-zero target in 2050 reducing the total implicit cumulative emissions by 13% (1300 MtCO2). As such, and despite the adoption of a net-zero target, the key conclusion of this analysis remains unchanged. The UK emissions pathway implies a carbon budget at least a factor of two greater than the UK’s Paris-compliant budget estimated here (DD2).
5.2. CO2 emissions implicit in Swedish current policy pathway
A new ‘climate policy framework’ was adopted by the Swedish parliament in 2017. The framework builds on the recommendations of the Swedish Cross-Party Committee on Environmental Objectives and includes long term targets for emission reductions, a Climate Law (which came into force in January 2018) and the setting up of a Climate Policy Council (CPC). The long term targets comprise an overarching goal of net-zero emissions by 2045, alongside a number of subgoals addressing emissions covered by the EU’s Effort Sharing Regulation (ESR), including a sector-specific goal for national transport emissions. The Climate Law places statutory requirements on the Swedish government to align its climate policies and action plans with the framework’s long term targets and to provide annual reports on progress in conjunction with submitting a draft budget bill. Similar to the UK’s CCC, the CPC is an interdisciplinary agency tasked with evaluating how closely government policies align with the climate targets enshrined in the climate policy framework.
Despite being informed by the UK’s Climate Change Act and advised by the UK’s CCC, the Swedish climate policy framework excludes direct reference to carbon budgets and adopts a less robust mandate for the CPC. Nonetheless, a carbon budget can be derived from the emission targets included within the framework and emission pathways presented by the CPC. As the Swedish emission targets include all GHGs, non-CO2 gases are deducted from the pathways, assuming a constant proportion between emitted CO2 and other GHGs across the period of analysis. Emissions from international aviation and shipping are added. Aviation is based on the Swedish Transport Administration’s headline growth scenario and the International Aviation Transport Association’s (IATA) 2050 objective to reduce net aviation CO2 emissions by 50% by 2050, relative to 2005 levels, whilst shipping takes the IMO’s 2050 objective. These calculations are based on bunker fuels which, for aviation, potentially underestimate total annual CO2 emissions attributable to Swedish residents’ international air travel by up to 50% (Larsson, Elofsson, Sterner, & Åkerman, Citation2019). To align with the global overhead framing, presented in Section 3, process emissions from Sweden’s cement sector are deducted from the budget, assuming they remain constant to 2030 before following a linear mitigation trajectory to zero emissions by 2045. As for the UK, all remaining emissions in 2050 are extrapolated to zero by 2075 (see ). This remainder sums to 80 MtCO2 or ∼10% of the 2020–2100 total. Appendix D details the assumptions underpinning the proposed pathway.
Sweden’s climate policy framework allows for so-called ‘complimentary measures’ to contribute to meeting the emission targets; these include international offsets, increased uptake from land and forest, and biomass energy with carbon capture and storage (BECCS). For the overarching goal of net-zero emission by 2045, emissions are to be 85% lower than 1990 levels, leaving a potential 15% (10.7 MtCO2e) to be covered by ‘complimenary measures’ annually. For the subgoals associated with the EU’s ESR, emissions are to be 63% lower in 2030, and 75% lower in 2040 compared to 1990 levels, with complimentary measures making up a maximum of 8% and 2% respectively. However, for consistency and comparison with the other pathways in this paper, it is assumed that no complimentary measures are used.
From 2020 to 2100, fossil fuel CO2 emissions total 800 MtCO2 under the current Swedish climate policy framework which is more than twice that of the Swedish DD2 carbon budget (and close to three times larger than the Swedish DD1 budget).Footnote10 Similarly, the equivalent annual CO2 reduction rate is approximately 5% versus 12%. If Sweden were to use all of its stated ‘complimentary measures’ to reach the targets, the implied budget would be more than 2.5 times that of the DD2 scenario. shows the significant gap between the carbon budget and trajectories implied by the Swedish climate policy framework and that of a Paris-compliant pathway.
6. Discussion
Academics, policy makers, journalists and some NGOs, regularly cite UK mitigation as broadly consistent with the demands of the Paris Agreement (Averchenkova & Matikainen, Citation2016; CCC, Citation2019; Harvey, Citation2016). Similarly, Sweden, building on its reputation as a sustainable and enlightened nation, has introduced a new ‘world leading’ Climate Law (Business Green, Citation2018; Swedish Press, Citation2018). Yet the analysis here suggests the mitigation agenda of both these ‘climate progressive’ nations hugely underplays what is necessary if they are to make their proportionate response to the Paris Agreement’s 1.5 and 2°C goals. In simple terms, the major quantitative indicators (total national carbon budget, annual rate of mitigation and timeframe to deliver a zero-carbon energy system) exhibit more than a factor of two difference between what the UK and Swedish governments are proposing and what is Paris-compliant. However, in important respects, this significant quantitative disparity belies the fundamental scale of the qualitative and institutional change required of society.
Certainly the transformation detailed in, for example, the UK CCC’s technical reports (CCC, Citation2019) is a key constituent of a Paris-compliant agenda. Though even here, the transformation needs to remove any privileged status afforded aviation as a major and persistent high-carbon sector. It also needs to be complete within two decades rather than the 2050 and beyond timeframe favoured by the CCC and prescribed in the Swedish climate policy framework. But beyond low-carbon technologies and price mechanisms, a 10% (minimum) annual mitigation rate and twenty year decarbonization timeframe demands profound changes to many of the core values, dynamics and structures of contemporary society .
Table 2. Comparison of CO2 emissions pathways for UK and Sweden.
Such double-digit rates of mitgation, if referenced at all, have remained at the periphery of academic and policy discussion. Published in 2006, the Stern Review developed its conclusions from an assumption that global CO2 growth between 2000 and 2006 was 0.95% p.a. (Stern et al., Citation2006). This compares with the empirical data, freely available at the time, putting the increase at 2.4% p.a. The cumulative implications of this substantial difference between real-world post 2000 data and Stern’s modelled extrapolation of growth rates from the 1990s, is difficult to exaggerate. In essence, the headline conclusions of the Stern report substantially underplayed the disruptive scale of the mitigation challenge. Other global scale scenarios of this era similarly either ignored real-world data or adopted assumptions with low rates of near term growth (CCSP, Citation2007; Hulme, Neufeldt, & Colyer, Citation2009).
Over a decade on, global emissions are still rising and the empirical data has become much more widely understood and accessible (e.g. through the Global Carbon Project and UNEP Gap Reports). Today, planetary scale NETs, largely BECCS, are ubiquitous across high-level mitigation models, preserving the prospect of the Paris Agreement’s objectives being delivered through incremental adjustments and marginal economics. The latest net-zero report from the UK CCC (Citation2019) demonstrates the growing reliance on NET assumptions. Whilst the committee’s earlier advice (80% reduction by 2050; CCC, Citation2010) had BECCS reach 37 MtCO2 by 2050, their new and ostensibly more challenging net-zero analysis sees reliance on ‘engineered removals’ increase by over 40% to 53 MtCO2.
The very high mitigation rates derived in this paper cast significant doubt on the extent to which carbon price mechanisms and green growth strategies reliant on decoupling of emissions from economic growth (Hickel & Kallis, Citation2019) can deliver on the Paris Agreement. Marginal adjustments to a market-oriented economy may have succeeded had they been deployed at the time of the first IPCC report in 1990. But three decades later, annual emissions of CO2 have risen by more than 60%, and continued to do so in 2017 and 2018. Set against the scientific logic of carbon budgets, the global community has spent virtually all of the Paris-compliant emission space and now faces a decarbonization agenda far removed from any economic equilibrium.
Turning to developing countries, the mitigation pathways derived in this paper are far more ambitious than the aggregate of their NDCs. For 2030, emissions implied by NDCs are over 30% higher than those within DG1 and DG2. Moreover, these pathways and associated budgets are notably more ambitious than those linked to equity-based allocation schemes, such as the Fair Shares analysis (see Holz et al., Citation2017). This raises critical questions as to the mechanisms and scale of international financing necessary to support the more onerous DG1/2 mitigation pathways.
Delivering on the Paris 1.5–2°C commitment will require major changes to the productive capacity of industrialized societies. But even this will be insufficient to deliver early double-digit rates of mitigation. Here the numerical scale of the asymmetry in responsibility for emissions (Chancel & Piketty, Citation2015) brings issues of values, measures of prosperity and the socio-economic inequality of contemporary society to the fore. Such re-visioning of society is not, however, driven by political ideology, but rather is a direct consequence of the international community’s obligations under the Paris Agreement and the small and rapidly dwindling global carbon budget.
As in fluid dynamics, where theories of laminar flow are no guide to understanding turbulence, so the neoclassical ideology and accompanying ‘computable general equilibrium’ (CGE) models serve to distract from the multi-facetted disequilibrium posed by the Paris Agreement. The rate and depth of such a physical and social transformation will likely entail two to three decades of socio-economic activity reminiscent of ‘the arsenal of democracy’ invoked by Roosevelt’s 1940 ‘fireside chat’ (Roosevelt, Citation1992) or the 1948 European Recovery Programme (the Marshall plan). But even these analogies do not fully capture the scale of the challenge in delivering a timely zero carbon energy system; a system that has fuelled over one hundred and fifty years of industrialization.
7. Conclusion
The carbon budgets and pathways developed here provide a heuristic framework for guiding responses to the mitigation challenges posed by the Paris Agreement. Whilst they are not predictions or probabilistic forecasts, they nevertheless illustrate the scale and timeframe of mitigation necessary to deliver on the ‘well below 2°C’ and ‘pursue … 1.5°C’ commitments.
The sequential logic of translating the Paris Agreement into budgets and mitigation rates for the developed and developing country Parties, subsequently downscaled to the UK and Sweden, is premised on a series of transparent assumptions. The decision to exclude non-linearities in the climate system with the potential for large and irreversible changes, is one such assumption.Footnote11 Informed by a similarly cautious approach to issues characterized by high levels of uncertainty, though of a different category, is the exclusion of planetary scale NETs. These are now ubiquitous in IPCC mitigation scenarios and are central to the UK and (indirectly) Swedish government’s mitigation agendas. In this regard, the paper offers a complement to much of the ‘net-zero’ analysis developed in response to the Paris Agreement.
Synthesizing the Paris temperature commitments with its precautionary context and language around equity, points to a mitigation agenda far beyond anything yet countenanced by mainstream policy makers. This is particularly evident when considering the two ‘climate progressive’ case-study nations. The UK and Sweden both have prominent legislative frameworks for informing their mitigation agendas. Both also have established ‘committees on climate change’ to advise on the timeframe, scale, obstacles and opportunities for delivering on their respective government’s commitments. Despite this, the mitigation ambitions of even these nations is less than half of what is the absolute minimum necessary to deliver on the Paris Agreement. The UK and Sweden propose annual mitigation rates of ∼5% whereas this analysis suggests, respectively, a minimum of 10% and 12% per annum.Footnote12
These results are sensitive to a range of important factors, particularly, but not exclusively: the peaking date; potential plateau and subsequent mitigation pathway of developing country Parties; the choice of apportionment regime; the re-classification of oil rich nations with very high GDP/capita (and relatively high HDI) from the developing to the developed country Parties group; the extent of future process emissions from cement, international aviation and shipping sectors; and land use emissions reversing to become neutral across the century. However, given that the premise of this paper is on delivering mitigation aligned with the Paris Agreement, highly optimistic assumptions are already applied to each of these factors. Consequently, the scale of the void between ‘official’ carbon budgets (and implied mitigation rates) and the Paris-compliant conclusions presented here is very likely to increase, should the favourable expectations of any of the key factors not be forthcoming, or if mitigation is further delayed.
In summary, most high-level emission scenarios transfer a significant proportion of the mitigation burden on to future generations. Remove this temporal transfer, and Paris-compliant pathways demand an immediate ramping up of mitigation to rates very rarely discussed. Even within more ‘climate progressive’ nations, the Paris Agreement neccesitates an immediate increase in their proposed mitigation rates by a factor of two to over 10% p.a., with full decarbonization achieved across all sectors by 2035–40. Delivering such rapid and deep mitigation implies profound changes to many facets of contemporary industrial society. But failing to take appropriate action will increasingly lock-in devastating climate impacts, imposed initially on poor and climate vulnerable societies, but ultimately across all of the international community and natural ecosystems.
Supplemental Material
Download PDF (802.7 KB)Acknowledgements
We, the authors, thank Jaise Kuriakose and Carly McLachlan (of the Tyndall Centre, University of Manchester) for their frequent and valuable discussions in the development of the paper. We are grateful to Glen Peters (Research Director at °Cicero, Oslo) and Niclas Hällström (Director, What Next Forum, Sweden) for their ever-helpul insights and guidance. We thank the three anonymous reviewers for their various contributions to tightening and clarifying our text. Finally we are indebted to the journal editor, Joanna Depledge, for her professional support and incisive editing. The views expressed are those of the authors alone.
Disclosure statement
No potential conflict of interest was reported by the author(s).
Correction Statement
This article has been republished with minor changes. These changes do not impact the academic content of the article.
Additional information
Funding
Notes
1 Whilst recognizing the merits of consumption-based emissions accounts, this paper focuses on territorial emissions for three reasons: (1) the climate change policy frameworks and legislation for Sweden and the UK are based on territorial emissions. (2) there are substantial discrepancies between consumption-based inventories; (3) nation states have direct leverage over territorial emissions whilst typically only indirect leverage on activities giving rise to consumption-based emissions. If a consumption-based approach were taken, the developed country reduction rates calculated in Section 4.2 would be greater.
2 Prior to any deployment, differentiation between the NET options would need to identify the range of social and environmental risks and impacts, and judge whether these are more or less acceptable than the implications of not deploying them.
3 For a budget taken with the centre of the TCRE uncertainty range set at 1.5°C, the other quantified uncertainties are regarded by the IPCC as at least +/- 50% therefore covering a threefold range 290–870 GtCO2 (SR1.5 p107).
4 The exact relationship of the latter to actual levels of deforestation is more difficult to distil from the data, not least because of the challenges in reliably estimating rates and levels of logging. See Kissinger, Herold, and De Sy (Citation2012) and Busch and Ferretti-Gallon (Citation2017).
5 This position is considerably more optimistic than that detailed in earlier work of Anderson and Bows (Citation2008), where net emissions from forestry, across the full twentieth century, were assumed to be between 213 and 319 GtCO2; the figure of 266 GtCO2 was later used in Anderson and Bows (Citation2011). For an overview of the considerable uncertainties associated with estimating their future potential as sinks and sources of emissions see Mitchard (Citation2018).
6 UNFCCC Party Groupings https://unfccc.int/process-and-meetings/parties-non-party-stakeholders/parties/party-groupings
7 Constraints imposed are: (1) The SR1.5 carbon budgets associated with the temperature commitments enshrined in the Paris Agreement. (2) The Paris Agreement’s inclusion of principles of equity (through CBDR&RC and a delayed peaking of developing country Parties emissions). (3) Initial reduction rates of developing country Parties should not exceed those typically demonstrated by developed country Parties. Post-Copenhagen developed countries, on aggregate, achieved 0.5-1.0% p.a. and post-Paris there has been barely any change. (4) The maximum emission reductions assumed for developing country Parties should not exceed the emission reductions of developed country parties at any point in time.
8 This equates to 0.11 kgCO2/capita for developing nations and 0.36 kgCO2/capita for developed nations.
9 DfT forecast total aviation sector emissions of 39.9 MtCO2 in 2050 versus the CCC Further Ambition scenario 31.5 MtCO2.
10 The only identifed scenario that quantifies a carbon budget for Sweden is included as a heuristic scenario in a recent background report from the Environmental Protection Agency (Naturvårdsverket, Citation2019, Fig 10). Aligning this scenario to the assumptions made in this paper results in a budget of close to 1,000 MtCO2 for the period 2020–2100 i.e. around 2.5 and 3.5 times the size of the Swedish DD2 and DD1 budget, respectively, and significantly larger than our more optimistic interpretation of the Swedish climate policy framework.
11 The carbon budgets presented in SR1.5 are not further reduced by identified but currently poorly characterised Earth-system feedbacks (see Cai, Lenton, and Lontzek Citation2016; Melillo et al., Citation2017; Steffen et al., Citation2018).
12 This ~10% p.a. is premised on reductions commencing at the start of 2020. Should it take until 2025 to ramp mitigation up to such high levels, the rate rises considerably towards 15% p.a. to maintain the same carbon budget.
References
- Allen, M. R., Frame, D. J., Huntingford, C., Jones, C. D., Lowe, J. A., Meinshausen, M., & Meinshausen, N. (2009). Warming caused by cumulative carbon emissions towards the trillionth tonne. Nature, 458, 1163–1166. doi: 10.1038/nature08019
- Anderson, K., & Bows, A. (2008). Reframing the climate change challenge in light of post-2000 emission trends. philosophical transactions of the royal society A: Mathematical. Physical and Engineering Sciences, 366(1882), 3863–3882.
- Anderson, K., & Bows, A. (2011). Beyond dangerous climate change: Emission pathways for a new world. Philosophical Transactions of the Royal Society A, 369, 20–44. doi: 10.1098/rsta.2010.0290
- ARUP and C40 Cities. (2016). Deadline 2020 – How cities will get the job done, Retrieved from: https://www.c40.org/researches/deadline-2020.
- Averchenkova, A., & Matikainen, S. (2016). Assessing the consistency of national mitigation actions in the G20 with the Paris agreement. Policy brief by the Grantham Institute for ESRC. November 2016. Retrieved from http://www.lse.ac.uk/GranthamInstitute/wp-content/uploads/2016/11/Averchenkova-and-Matikainen-2016.pdf
- Belcher, S., Boucher, O., & Sutton, R. (2019, March 21). Why results from the next generation of climate models matter, Carbon Brief, Retrieved from https://www.carbonbrief.org/guest-post-why-results-from-the-next-generation-of-climate-models-matter
- Bows, A., Mander, S., Starkey, R., Bleda, M., & Anderson, K. (2006). Living within a carbon budget, Report for the friends of the Earth and Cooperative Bank Partnership.
- BP. (2019). BP Statistical Review of World Energy (68th). London, UK: BP. https://www.bp.com/content/dam/bp/business-sites/en/global/corporate/pdfs/energy-economics/statistical-review/bp-stats-review-2019-full-report.pdf.
- Busch, J., & Ferretti-Gallon, K. (2017). What drives deforestation and what stops it? A Meta-Analysis. Review of Environmental Economics and Policy, 11(1), 3–23. doi: 10.1093/reep/rew013
- Business Green. (2018, January 3). Sweden hails new climate Act as ‘most ambitious in the world’. Retrieved from https://www.businessgreen.com/bg/news/3023688/sweden-hails-new-climate-act-as-most-ambitious-in-the-world
- Cai, Y., Lenton, T. M., & Lontzek, T. S. (2016). Risk of multiple interacting tipping points should encourage rapid CO2 emission reduction. Nature Climate Change, 6(5), 520–525. doi: 10.1038/nclimate2964
- CCSP. (2007). Scenarios of greenhouse gas emissions and atmospheric concentrations (Part A) and review of integrated scenario development and application (Part B). A Report by the U.S. climate change science program and the subcommittee on global change research [Clarke, L., J. Edmonds, J. Jacoby, H. Pitcher, J. Reilly, R. Richels, E. Par- son, V. Burkett, K. Fisher-Vanden, D. Keith, L. Mearns, C. Rosenzweig, M. Webster (Authors)]. Department of Energy, Office of Biological & Environmental Research, Washington, DC., USA, 260pp.
- Chancel, L, & Piketty, T. (2015). Carbon and inequality: from Kyoto to Paris. Paris: Paris School of Economics. http://piketty.pse.ens.fr/files/ChancelPiketty2015.pdf.
- Committee on Climate Change (CCC). (2010). The fourth carbon budget: Reducing emissions through the 2020s, London.
- Committee on Climate Change (CCC). (2019). Net Zero: The UK's contribution to stopping global warming, London.
- Fuss, S., Canadell, J. G., Peters, G. P., Tavoni, M., Andrew, R. M., Ciais, P., & Le Quéré, C. (2014). Betting on negative emissions. Nature Climate Change, 4(10), 850–853. doi: 10.1038/nclimate2392
- G7. (2016). G7 Ise-Shima leaders’ declaration, p. 26. Retrieved from https://www.mofa.go.jp/files/000160266.pdf
- Global Carbon Project (GCP). (2018). Supplemental data of Global Carbon Budget 2018 (Version 1.0) [Data set]. https://doi.org/10.18160/GCP-2018.
- Harvey, F. (2016, January 28). No need to tighten UK carbon budget in light of Paris deal, says climate advisors. The Guardian. Retrieved from https://www.theguardian.com/environment/2016/jan/28/no-need-to-increase-uk-carbon-budget-in-light-of-paris-deal-say-climate-advisers
- Hickel, J., & Kallis, G. (2019). Is green growth possible? New Political Economy, 25. doi:10.1080/13563467.2019.1598964.
- Holz, C., Kartha, S., & Athanasiou, T. (2017). Fairly sharing 1.5: National fair shares of a 1.5 C-compliant global mitigation effort. Environ Agreements, 18, 117–134. doi: 10.1007/s10784-017-9371-z
- Hulme, M., Neufeldt, H., & Colyer, H. (2009). Adaptation and Mitigation Strategies: Supporting European Climate Policy. The Final Report from the ADAM Project. Norwich: Tyndall Centre for Climate Change Research.
- International Energy Agency. (2018). Technology roadmap low-carbon transition in the cement industry, Paris, France. Retrieved from https://webstore.iea.org/technology-roadmap-low-carbon-transition-in-the-cement-industry
- IPCC. (2014). Climate change 2014: Synthesis report. Contribution of working groups I, II and III to the fifth assessment report of the intergovernmental panel on climate change [Core Writing Team, R.K. Pachauri and L.A. Meyer (eds.)]. IPCC, Geneva, Switzerland, 151 pp.
- IPCC. (2018). Global Warming of 1.5°C. An IPCC special report on the impacts of global warming of 1.5°C above pre-industrial levels and related global greenhouse gas emission pathways, in the context of strengthening the global response to the threat of climate change, sustainable development, and efforts to eradicate poverty [Masson-Delmotte, V., P. Zhai, H.-O. Pörtner, D. Roberts, J. Skea, P.R. Shukla, A. Pirani, W. Moufouma-Okia, C Péan, R. Pidcock, S. Connors, J.B.R. Matthews, Y. Chen, X. Zhou, M.I. Gomis, E. Lonnoy, T. Maycock, M. Tignor, and T. Waterfield (eds .)].
- Kanitkar, T., Jayaraman, T., D'Souza, M., & Purkayastha, P. (2013). Carbon budgets for climate change mitigation–a GAMS-based emissions model. Current Science, 104(9), 1200–1206.
- Kissinger, G. M., Herold, M., & De Sy, V. (2012). Drivers of deforestation and forest degradation: A synthesis report for REDD+ policymakers. Lexeme Consulting, Vancouver Canada.
- Knutti, R., & Rogelj, J. (2015). The legacy of our CO 2 emissions: A clash of scientific facts, politics and ethics. Climatic Change, 133(3), 361–373. doi: 10.1007/s10584-015-1340-3
- Korsbakken, J. I., Andrew, R., & Peters, G. (2019, March 5). China’s CO2 emissions grew slower than expected in 2018, Carbon Brief, Retrieved from: https://www.carbonbrief.org/guest-post-chinas-co2-emissions-grew-slower-than-expected-in-2018
- Larkin, A., Kuriakose, J., Sharmina, M., & Anderson, K. (2018). What if negative emission technologies fail at scale? Implications of the Paris Agreement for big emitting nations. Climate Policy, 18(6), 690–714. doi: 10.1080/14693062.2017.1346498
- Larsson, J., Elofsson, A., Sterner, T., & Åkerman, J. (2019). International and national climate policies for aviation: A review. Climate Policy, 19(6), 787–799. doi:10.1080/14693062.2018.1562871.
- Lövin, I. (2018). Speech by Swedish Deputy Prime Minister Isabella Lövin at COP24 in Katowice, December 2018. Retrieved from https://www.regeringen.se/pressmeddelanden/2018/12/isabella-lovin-haller-anforande-pa-klimatmotet-i-katowice/
- Mastrandrea, MD, Field, CB, Stocker, TF, Edenhofer, O, Ebi, KL, Frame, DJ, Held, H, Kriegler, E, Mach, KJ, Matschoss, PR, Plattner, G.-K, Yohe, GW, & Zwiers, FW. (2010). Guidance Note for Lead Authors of the IPCC Fifth Assessment Report on Consistent Treatment of Uncertainties, Intergovernmental Panel on Climate Change (IPCC). Geneva, Switzerland.
- Matthews, H. D., Zickfeld, K., Knutti, R., & Allen, M. R. (2018). Focus on cumulative emissions, global carbon budgets and the implications for climate mitigation targets. Environmental Research Letters, 13(1), 010201. doi: 10.1088/1748-9326/aa98c9
- May, T. (2017). G20 Summit July 2017: Prime Minister's press statement. Retrieved from https://www.gov.uk/government/speeches/g20-summit-july-2017-prime-ministers-press-statement
- Melillo, J. M., Frey, S. D., DeAngelis, K. M., Werner, W. J., Bernard, M. J., Bowles, F. P., … Grandy, A. S. (2017). Long-term pattern and magnitude of soil carbon feedback to the climate system in a warming world. Science, 358(6359), 101–105. doi: 10.1126/science.aan2874
- Mikaloff, S., & Schaefer, H. (2019). Rising methane: A new climate challenge. Science, 364(6444), 932–933. doi: 10.1126/science.aax1828
- Mitchard, E. T. (2018). The tropical forest carbon cycle and climate change. Nature, 559(7715), 527–534. doi: 10.1038/s41586-018-0300-2
- Naturvårdsverket. (2019). Underlag till regeringens klimatpolitiska handlingsplan: Redovisning av Naturvårdsverkets regeringsuppdrag. Naturvårdsverket rapport 6879. Retrieved from https://www.naturvardsverket.se/Documents/publikationer6400/978-91-620-6879-0.pdf?pid=24382
- Nisbet, E. G., Dlugokencky, E. J., Manning, M. R., Lowry, D., Fisher, R. E., France, J. L., … Ganesan, A. L. (2016). Rising atmospheric methane: 2007-2014 growth and isotopic shift. Global Biogeochemical Cycles, 30(9), 1356–1370. doi: 10.1002/2016GB005406
- Ramankutty, N., & Foley, J. A. (1999). Estimating historical changes in global land cover: Croplands from 1700 to 1992. Global Biogeochemical Cycles, 13(4), 997–1027. doi: 10.1029/1999GB900046
- Raupach, M. R., Davis, S. J., Peters, G. P., Andrew, R. M., Canadell, J. G., Ciais, P., … Le Quere, C. (2014). Sharing a quota on cumulative carbon emissions. Nature Climate Change, 4(10), 873–879. doi: 10.1038/nclimate2384
- Robiou du Pont, Y. R., Jeffery, M. L., Gütschow, J., Christoff, P., & Meinshausen, M. (2016). National contributions for decarbonizing the world economy in line with the G7 agreement. Environmental Research Letters, 11(5), 054005. doi: 10.1088/1748-9326/11/5/054005
- Rockström, J., Gaffney, O., Rogelj, J., Meinshausen, M., Nakicenovic, N., & Schellnhuber, H. J. (2017). A roadmap for rapid decarbonization. Science, 355(6331), 1269–1271. doi: 10.1126/science.aah3443
- Rogelj, J., Forster, P. M., Kriegler, E., Smith, C. J., & Séférian, R. (2019). Estimating and tracking the remaining carbon budget for stringent climate targets. Nature, 571(7765), 335–342. doi: 10.1038/s41586-019-1368-z
- Roosevelt, F. D. (1992). FDR's Fireside Chats. Oaklahoma, USA: University of Oklahoma Press.
- Rose, A., Stevens, B., Edmonds, J., & Wise, M. (1998). International equity and differentiation in global warming policy. Environmental and Resource Economics, 12(1), 25–51. doi: 10.1023/A:1008262407777
- Steffen, W., Rockström, J., Richardson, K., Lenton, T. M., Folke, C., Liverman, D., … Donges, J. F. (2018). Trajectories of the Earth System in the Anthropocene. Proceedings of the National Academy of Sciences, 115(33), 8252–8259. doi: 10.1073/pnas.1810141115
- Stern, N., et al. (2006). Stern Review: The Economics of Climate Change. Cambridge, UK: Cambridge University Press.
- Swedish Press. (2018, June 2). Sweden's climate law: The World's most Ambitious?, http://www.swedishpress.com/article/swedens-climate-law-worlds-most-ambitious
- UNEP. (2018). The emissions gap report 2018. United Nations environment programme, Nairobi.
- United Nations Framework Convention on Climate Change. (1992). United Nations Framework Convention on Climate Change. New York, USA: United Nations. http://unfccc.int/resource/docs/convkp/conveng.pdf.
- United Nations Framework Convention on Climate Change. (2015). Decision 1/CP.21, Paris Agreement, document FCCC/CP/2015/10/Add.1. Paris: United Nations.
- van Ruijven, B. J., van Vuuren, D. P., Boskaljon, W., Neelis, M. L., Saygin, D., & Patel, M. K. (September 2016). Long-term model-based projections of energy use and CO2 emissions from the global steel and cement industries. Resources, Conservation and Recycling, 112, 15–36. doi: 10.1016/j.resconrec.2016.04.016
- Wang, T., & Watson, J. (2010). Scenario analysis of China’s emissions pathways in the 21st century for low carbon transition. Energy Policy, 38(7), 3537–3546. doi: 10.1016/j.enpol.2010.02.031