
 ?Mathematical formulae have been encoded as MathML and are displayed in this HTML version using MathJax in order to improve their display. Uncheck the box to turn MathJax off. This feature requires Javascript. Click on a formula to zoom.
ABSTRACT
In the UK, the cost of low-carbon policies, such as renewable energy subsidies, household retrofit and installation of smart meters, adds an additional 13% to household energy bills. Given that the lowest income households spend 10% of their income on heating and powering their homes, whereas the highest spend less than 1.5%., any increase in prices hits the poor disproportionately. Using an energy-extended multiregional input-output model combined with household expenditure survey data, we calculate the full supply-chain energy embodied in goods and services consumed by different households. First, we demonstrate that low-carbon policy costs are placed on a small percentage of household energy demand – perversely on items representing a higher proportion of expenditure for low income households. The lifestyles of higher income households require nearly five times more energy than the lowest, but because levies are only raised on energy bills, those with high incomes pay only 1.9 times more towards policy costs. Second, we evaluate alternative approaches to funding low-carbon policy: a household energy footprint approach, taking account of households’ full energy service demands; and funding the costs from general taxation payments. We explore the demographic characteristics of the households who would pay less towards funding policy costs and those who would take on a larger burden under these new proposals. While none of the approaches offer a ‘perfect solution’ in terms of distributional impacts, raising the funds through general taxation offers a fairer and practical solution.
Key policy insights
Low income households currently pay disproportionately more towards low-carbon policy costs in the UK.
Funding low-carbon policy through general taxation would better align energy demand with policy costs, and would reduce costs for 65% of UK households.
Households comprising women of retirement age living alone; single parent families; and households who have never worked or are long-term unemployed could see reductions in bills by recovering climate policy costs through general taxation.
A general taxation approach requires leadership and long-term commitment to avoid leaving the policy vulnerable to short-term budgetary changes.
1. Introduction
The UK Government has recognized that tackling climate change, by reducing greenhouse gas (GHG) emissions, requires transformation of the energy system, alongside improvements in energy efficiency in an attempt to reduce energy demand. The Government’s Clean Growth Strategy states that (BEIS, Citation2017, p. 5): ‘Clean growth means growing our national income while cutting greenhouse gas emissions. Achieving clean growth, while ensuring an affordable energy supply for businesses and consumers, is at the heart of the UK’s Industrial Strategy’.
The UK Government has been a key player in delivering emissions reductions through improvement in the efficiency of homes and businesses, and innovation in low-carbon energy. This has been achieved by investments that have successfully driven down the prices of renewables, and the funding of schemes such as the Energy Company Obligation (ECO), which delivers energy efficiency in homes. The cost of the UK’s energy policies is recovered by applying levies to household and business gas and electricity bills. On average, every household in the UK pays 13% in addition to the cost of the energy used in the home. However, there is concern that, despite the ECO targeted energy efficiency schemes, which aim to reduce household energy demand, many households will not see net reductions in their bills, with the additional levy paid being greater than the cost savings from reduction in energy use delivered by the ECO scheme. This has led key delivery agencies, such as the Energy Saving Trust (EST, Citation2017), to query whether ‘fuel poor’ households have benefited equally from the UK’s low-carbon policies. When designing a household tax for funding low-carbon policies, there are a number of concerns to be addressed and decisions to be made. Firstly, the tax should be designed not to be regressive. Secondly, should the tax cover the complete impact of household consumption or focus solely on direct energy use in the home? Thirdly, should energy consumption, carbon emissions or some other measure be used to differentiate the amount households should pay? And finally, there should be a robust mechanism in place for implementing the taxation system.
Q. Wang et al. (Citation2016) conclude that carbon taxes in developed economies will be regressive if revenue is not recycled and redistributed. Revenue redistribution is also a key recommendation from Carattini et al.’s (Citation2018, Citation2019) investigations into gaining public support for a global carbon tax. In the UK, the Joseph Rowntree Foundation’s report Designing Carbon Taxation to Protect Low-Income Households (Preston et al., Citation2013) looks into possible mechanisms for redistribution of carbon tax revenue to low income households via various welfare benefits. The authors recognize that households will only benefit if those that are eligible take up those benefits, while there are many low-income households that are ineligible for these schemes.
Given the potential issues around revenue redistribution, other options are worth considering to fund low-carbon policies. However there exist few papers which explore such alternative policy options while reducing levels of inequality. In one such example, J. Wang et al. (Citation2019) propose a consumer affluence-based levy system to address the inequalities associated with environmental taxation in China. However, their analysis is based on the average affluence of regions in China which would not account for any sub-regional inequalities and, in addition, the authors do not propose a mechanism for implementing this system.
In this paper, we examine the existing energy policy mechanism in the UK, namely, taxing household energy use, and explore the household inequalities that result from it. We look beyond household income groups to explore the types of households who are paying disproportionately towards low-carbon policy. Distributional impacts consider how energy policy costs are applied across UK households of different demographic types, house type, geographies and income levels. In contrast to previous work (Feng et al., Citation2010; J. Wang et al., Citation2019; Q. Wang et al., Citation2016) this paper then considers how the total energy footprint associated with households could be taxed to fund low-carbon policies rather than direct carbon emissions. We then investigate a further solution to funding energy policy which would not require redistribution of funds to avoid being a regressive taxation policy.
Specifically, we calculate the proportion of total disposable income paid by each household towards low-carbon policy under three options:
Option 1: The current approach, where households pay 13% of their gas and electricity bills towards funding low-carbon policy;
Option 2: Household energy footprint approach, where household contributions to low-carbon policy funds are weighted by the household’s total energy service demands calculated from their household energy footprint;
Option 3: General taxation approach, where household contributions to low-carbon policy funds are weighted by the household’s contribution to total UK income tax payments.
In each of these options, the same annual revenue is raised to pay for low-carbon policies, but the distribution of payments by households are different.
This study involves the use of detailed household microdata in the form of annual household expenditure surveys and, in order to determine complete energy footprints, we develop an energy-extended multiregional input-output (MRIO) database. In Section 2, we provide a brief overview of the use of microdata with MRIO databases and calculation of household energy footprints. Section 3 presents the results, starting with a whole systems overview of energy use in the UK (Section 3.1). We trace the energy used by both UK industries and industries situated abroad, as required to make the goods and services demanded by all types of UK households. Section 3 finishes with a comparison of the three options for funding low-carbon policy costs. The study is evaluated in Section 4, which includes discussion of limitations and uncertainties. The paper concludes with recommendations for the application of a fairer method for funding energy and climate policy.
While our analysis is of the UK, findings related to the funding of climate policies that drive innovation, insulate homes and fund infrastructure (such as smart meters) is of critical importance to all countries. There is a growing consensus that any low-carbon transition must be both rapid and equitable. Therefore, our paper demonstrates how this is possible by avoiding regressive policies and providing the necessary funds to deliver a low-carbon transition.
2. Data and methodology
2.1. Energy footprints and the UK multiregional input-output model
In order to investigate the effect of funding low-carbon policy through taxing households on their total energy use (option 2), we need to calculate the energy footprint of different types of households. The household energy footprint is the total energy required to meet the final demand of UK households. The footprint will include both the direct and indirect energy use associated with the full supply chain of goods and services consumed by households in one year. This will include both energy used in foreign factories to produce goods imported for UK households’ consumption and UK household’s consumption of domestic goods.
MRIO databases have been used by environmental economists due to their ability to make the link between the environmental impacts associated with production techniques and the consumers of products. The Leontief input-output model is constructed from observed economic data and shows the interrelationships between industries that consume goods (inputs) from other industries in the process of making their own products (outputs) (Miller & Blair, Citation2009). The fundamental Leontief equation,Footnote1 , indicates the inter-industry requirements of each sector to deliver a unit of output to final demand. Since the 1960s, the IO framework has been extendedFootnote2 to account for increases in the pollution associated with industrial production due to a change in final demand.
The University of Leeds constructs a UKMRIO database to calculate the UK’s consumption-based emissions account (CBA) (Barrett et al., Citation2013; UK Government, Citation2019). The CBA is a National Statistic (UK Government, Citation2019), which means that the database needs to be constructed using data published by the Office for National Statistics for the UK. It is important that figures from these original tables are preserved as much as possible in the construction of the database. It is for this reason that a bespoke UKMRIO database is constructed rather than taking UK outputs from an international MRIO database, such as Eora (Lenzen et al., Citation2012), EXIOBASE (Wood et al., Citation2015), GTAP (Andrew & Peters, Citation2013), OECD-ICIO (Rouzet & Miroudot, Citation2013), or WIOD (Dietzenbacher et al., Citation2013). In producing the UKMRIO, we follow the recommendations and methods from Tukker et al. (Citation2018) and Edens et al. (Citation2015).
For further discussion of the UKMRIO database including additional notes on construction and application see Barrett et al. (Citation2013), Hardt et al. (Citation2018), Lenzen et al. (Citation2010), Owen et al. (Citation2018), Sakai et al. (Citation2017), Scott et al. (Citation2018), and Wiedmann et al. (Citation2010) and the Supporting Information (SI) for this article.
2.2. Energy use by industry data
The International Energy Agency (IEA, Citation2016) provides extended energy balance data, from which kilotonnes of oil equivalent for by country and sector of final consumption is extracted. Energy associated with world aviation and marine bunkers is also extracted. In the IEA database ‘final consumption’ means the point at which the energy is used, for example by industry, transport and other (which includes residential, agricultural and service sector energy use). For discussion of the difference between production energy and final energy from the IEA and its use in energy footprints see Owen et al. (Citation2017). We use the IEA data to construct an energy use extension vector that aligns with the foreign sectors in the UKMRIO database. IEA data for the UK was replaced with National Statistics on Energy consumption data (BEIS, Citation2018a) which better aligns the UK data submitted to the IEA with the 106 sectors in the UK national accounts and UKMRIO database and also extracts energy data for UK residential home heating and powering and UK residential private transport use. The SI provides further detail of the link between IEA data and MRIO sectors.
2.3. Disaggregating national footprints to individual households
Before the recent availability of open source Global MRIO databases and computer hardware capable of running the calculations, household footprint calculations either used process-based approaches, such as life cycle assessment (LCA) to assign environmental impact to household expenditure (see Girod & de Haan, Citation2009; Vringer & Blok, Citation1995), or worked with single region IO tables (Lenzen, Citation1998; Lenzen et al., Citation2004; Park & Heo, Citation2007; Wier et al., Citation2001). It is generally accepted that LCA and single regional IO tables are insufficient methods for calculating environmental footprints due to truncation issues associated with the former (Lenzen & Dey, Citation2000) and the importance of taking account of foreign production structures in imports associated with the latter (Andrew et al., Citation2009).
In the UK, much of the work on the environmental footprints of UK households has focussed on their carbon impacts both at a spatial (Baiocchi & Minx, Citation2010; Minx et al., Citation2013) and temporal scale (Druckman & Jackson, Citation2009). Gough et al. (Citation2011) consider how UK GHG emissions are distributed by households income deciles, employment status and household type for the year 2006. Ivanova et al. (Citation2016) use EXIOBASE to calculate a suite of national environmental footprints for households around the world but the energy footprint is not part of this analysis. Steen-Olsen et al. (Citation2016) consider both the change in household carbon footprint over time and the distribution of impact by income decile in Norway.
All of the studies previously mentioned use microdata in the form of household expenditure surveys to understand consumption patterns of households. The surveys can then be used to disaggregate the footprint for all household expenditure from the MRIO data. The microdata data is either taken from household surveys from national statistical offices or from consumer segmentation products built from data which include these surveys (see Minx et al., Citation2013). Bridging tables are used to link household expenditure to the MRIO database (see SI).
2.4. The living costs and food survey
Since 1957, the UK Office for National Statistics has annually surveyed UK households on their weekly expenditure (UK Data Service, Citation2019). In 2008, this survey became known as the Living Costs and Food Survey (LCFS). The LCFS achieves a sample of around 6000 UK households and is used to provide information on retail price indices, National Account estimates of household expenditure, the effect of taxes and benefits, and trends in nutrition. It also provides information on household expenditure on over 300 different product types (coded by the European Standard Classification of Individual Consumption by Purpose (COICOP)). Additional information is collected such as the age, sex and occupation of members of the household, the total household income, taxes paid, and the location, tenure and dwelling type. The characteristics of each sampled household can then be compared to the characteristics of all UK households using the UK census. The survey strives to produce a representative sample of the 27 million UK households in 2016. For each of the 5,041 household surveys in the 2016 release, a weight is supplied to indicate the proportion of UK households that are represented by this profile. For example, the first household in the 2016 survey has a weight of 4,774 and the sum of every weight is 27 million. In all calculations for this study, we use the weights to convert the sample into a set of data that is representative of all 27 million households in the UK.
In this study, we use information from the 2016 LCFS to determine expenditure on home energy and other goods and services by households of different types. This data is used to:
Calculate the portion of household income spent on low-carbon policy costs (13% of each household’s expenditure on electricity and gas)
Extract the income tax paid by each household type for Option 3
Provide expenditure proportions by product and household type which is then used to disaggregate the total UK household expenditure from the MRIO database. From this, household energy footprints by each household type are produced
When dealing with household surveys, making comparisons between households can be problematic due to differing household compositions. Gough et al. (Citation2011) use the McClements Equivalence Scale to calculate an equivalised gross income. A weight is applied to each household member in order to give a total equivalence number for the household. The household gross income is then divided by this total equivalence number. Using McClements equivalisation with the LCFS allows for comparisons in relative expenditure. For example, it can be used to compare expenditure on fish for a household with two adults and three children with a single occupancy household. It can also be used to redefine income groups. Gough et al. (Citation2011) find that equivalisation alters the composition of each income decile: where one-person retired households account for 41% of households in the lowest income decile, this share falls to 10% after equivalisation. In this study we decide against equivalisation. Results are reported by households rather than per capita because low-carbon policy in the UK is funded through taxing household energy bills and operates at the household unit. Conversion to equivalent sized households may lose sight of real-life costs to households under the three policy options. As a result, we recognize that our approach may not reflect a household’s ability to pay. A cost of 5% of annual household income may be more achievable for a one-person retired household than for a family of six with the same income. However, application of the McClements Scale would not necessarily solve this issue because there are many more facets to a household’s ability to pay than its size and composition.
2.5. Economic effects of policy changes
This paper investigates the distributional effects of raising revenue for low-carbon policies in the UK under three alternative options. In options 2 and 3, different household types will either be paying more or less for their energy bills compared to the current situation in option 1. One potential technique for modelling the economic effects of policy change is to use a computational general equilibrium model (CGE). The CGE model finds a new future equilibrium solution resulting from the effects of the policy change. In this study, we consider the implications of different approaches to fund energy policies in one static year, namely 2016. We are not attempting to project forward the potential changes in household demand but rather provide a robust comparison of the implications of different approaches in a single year.
In option 2, we use an input-output model and since the model uses basic prices for household expenditure in the final demand column, these values are in effect proxies for the volume of demand for gas and electricity. One possible long-run change might be households experiencing changes in their disposable income and as a result changing their expenditure patterns. Income elasticities of demand could be used to show the effect of a change in income but predicting these rebound effects is beyond the scope of this paper.
2.6. Model framework
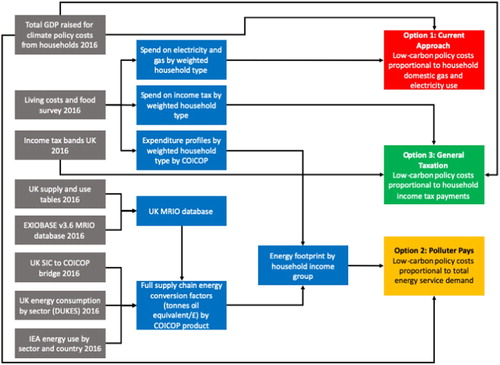
demonstrates the source data (shown in grey) and the modelling linkages and outputs produced in this study.
Figure 1. Model framework – source data in grey, modelled data in blue and policy options in red, orange and green (GDP = Gross Domestic Product, EXIOBASE = Multi-Regional Environmentally Extended Supply-Use Table (MR-SUT) and Input-Output Table (MR-IOT), UK SIC = UK Standard Industrial Classification, COICOP = Classification of Individual Consumption According to Purpose, DUKES = Digest of UK Energy Statistics, IEA = International Energy Agency, UK MRIO = UK Multi-Regional Input Output Model.
3. Results and discussion
3.1. Demand for energy in the UK
Energy provides essential ‘life support’ for all people. The services provided by energy include not just space and water heating in our homes, power for lighting, appliances and cooking, and fuel for our cars, but also consumer goods, leisure activities, and other services and infrastructure. We call these requirements for energy, ‘energy service demands’. Energy can be used both directly, and indirectly embodied in the energy services used by households, government, capital and exports. The total energy required to meet the demand of UK end users can be traced back to the energy used in the industry, transportation and service sectors both in the UK and abroad. The UK is a net importer of energy. In 2016, 142 Mega tonnes of oil equivalence (Mtoe) was used within the territory of the UK by UK households heating and powering their homes and cars, and by UK factories, transportation and other service sectors. However, the total energy required to meet UK energy service demands was 178 Mtoe. This latter figure, also known as the energy footprint or energy consumption-based account, includes imported energy embodied in imports and removes energy embodied in UK exports.
presents a simplified mapping which shows how energy sources flow and are transformed through the economic system to meet household energy service demands and the energy demands of government and capital expenditure.
Figure 2. Relationship between the energy system and energy service demands – the energy demand chain 2016 (thousand tonnes of oil equivalent), Authors work.
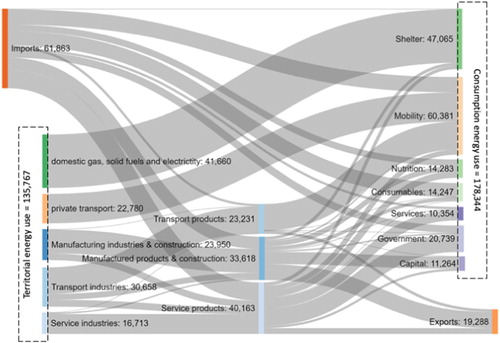
Energy used for shelterFootnote3 and mobility account for 32% and 41% of the householdFootnote4 energy footprint, respectively. The remaining 27% of a household’s energy footprint is made up of the food, consumables and services required by households. The direct energy consumed by households (energy used to heat and power a home) accounts for just 23% of the total UK energy service demand (28% of the household energy footprint). Therefore, households will be unduly disadvantaged if their energy bills are a larger proportion of their total expenditure.
We now turn to looking at how the household share of energy policy costs are distributed across different types of households under three low-carbon policy scenarios.
3.2. Distributional impacts of energy use and low-carbon policy costs
3.2.1. Option 1: current approach
In 2016, a total of £6.5bnFootnote5 was raised from the low-carbon policy costs added to household energy bills (NAO, Citation2016). The Climate Change Levy raised a further £1.8bn from UK businesses (HM Treasury, Citation2017). UK households contribute the majority (78%) of the total money raised. The additional 13% added to household energy bills equates to an average of £132 per household, per year (NAO, Citation2016). Average annual household gas and electricity bills in the UK would be £490 larger than today without accompanying improved energy efficiency measures, according to calculations by the Committee on Climate Change (CCC, Citation2017). This net reduction is partly due to the ECO targeted energy efficiency schemes and previous schemes such as the CERT (Carbon Emissions Reduction Target). The schemes are seen as an essential part of the Government’s climate response and help deliver a low-cost pathway to achieving carbon budgets set by the UK. Home efficiency improvements made independently by UK homeowners also contribute to this overall saving.
The majority of the funds are used to support the provision of renewable energy. A further 12% funds energy efficiency programmes under the ECO targeted at fuel poor households, and 5% is accounted for by the Warm Homes Discount, which allows specific households to apply for reductions on their energy bill. The final 5% supports a scheme to install smart meters to replace traditional gas and electricity metering systems. In addition, these policy costs will increase the price of energy, which encourages households to reduce their consumption. A small fraction of the levy will be returned to low-income households through improved energy efficiency programmes, however ECO and the Warm Homes Discount account for only 17% of the total. According to recent figures, of the 1.8 million properties that have had energy efficiency measures installed through the various schemes, 980,000 (54%) of these households were classified as low-income and/or vulnerable (BEIS, Citation2018b). To ensure consistency in our approach, we have used data for 2016 and these figures will vary year on year.
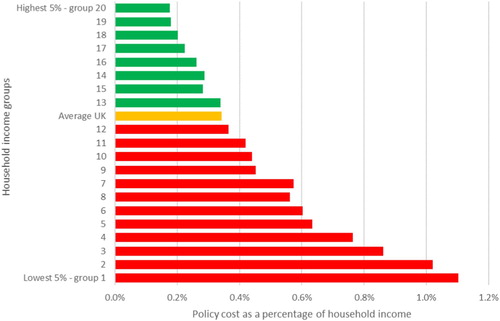
Using data from the 2016 LCFS, we find that the amount spent on gas, electricity and solid fuel use represents a greater proportion of a low-income household’s total income than in the highest income households, meaning that the portion of income paid towards low-carbon policy costs is higher for low-income homes. shows that the 5% of UK households on the lowest income (income group 1) pay 1.10% of their income towards low-carbon policy costs compared to 0.18% paid by those in the highest income group.
Figure 3. Low-carbon policy costs as a percentage of total household income by income groups (2016).
In addition to considering household income, we also group the household expenditure survey responses by geography, house type and demographic details to get a fuller picture of the distributional impacts of funding these policy costs. Splitting by income reveals the starkest extremes of payment contributions but we also find that households in the rural North East, women of retirement age living alone and households who have never worked or are long term unemployed contribute above average proportions of their income towards energy policy (0.51%, 0.69% and 0.85% respectively). At the same time, households in rural Northern IrelandFootnote6, households comprised of two adults with no children and households with residents in managerial occupations contribute the least (0.25%, 0.27% and 0.22%)Footnote7.
We recognize that one-sixth of the policy costs met by households go towards energy efficiency measures which target the fuel poor (). Our calculations indicate that the poorest 10% of households contributed £271 million towards low-carbon policy costs in 2016. Between October 2016 and September 2017 the costs of the Affordable Warmth and Carbon Savings Communities schemes, which are aimed at helping the poorest homes, totalled £220 million (BEIS, Citation2018b). These low-income homes are, in effect, more than self-funding these schemes. In addition, research indicates that just half of fuel poor households qualify for the ECO funded efficiency measures because they are targeted to benefit claimants rather than those defined as fuel poor, and the majority of the tariff funds renewable energy schemes, not energy efficiency programmes (EST, Citation2017). Other policy costs include the funding of the Feed-in-tariff for households that have installed solar power. These are dominated by wealthier households who could better afford the capital costs associated with installed solar power. Therefore, low income households are both covering the costs of home efficiency improvements and capital investments in wealthier households.
It is vital that there is government support for the transition to an energy system that is more efficient and lower carbon, given the urgency of tackling climate change. However, we argue that continuing the current approach risks low-income households being priced out of access to energy services, despite the targeted investment in policies aimed to help them with their energy bills. Substantial energy and carbon savings can be achieved by improving the efficiency of UK homes, which include significant social benefits (Rosenow et al., Citation2017) but the current approach for raising funds is highly regressive.
There is a clear argument for a new mechanism for raising funds for low-carbon policy. In the following sections, we explore the distributional costs to households of two possible alternative approaches: one based on household energy footprint, and the other on general taxation.
3.2.2. Option 2: household energy footprint
In this approach, payments to cover low-carbon energy policy costs are weighted by a household’s indirect energy use in addition to the energy used for heating and power. The amount paid by each household is therefore proportional to their household energy footprint.
shows the total energy service demand by 20 household income groups in 2016. The highest 5% income households consumed an average 10.8 tonnes of oil equivalent (toe) compared to 3.2 toe consumed by the lowest 5% income group. The households with the lowest energy footprint are households in the second lowest income group who use an average of 2.4 toe. Currently, low-carbon policy costs are met by taxing households on their domestic gas and electricity use (shown in red on ). We find that energy used for heating and powering the home does not show the same rate of increase by income group. The highest income homes use 1.9 times the domestic gas and electricity of the lowest income. This means that they pay 1.9 times the contribution towards policy costs while using nearly five times the complete energy service demands.
Figure 4. Total energy service demand by household income group (2016).
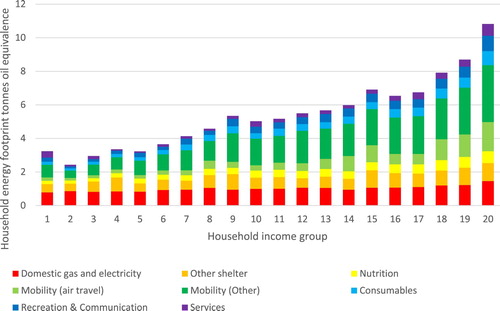
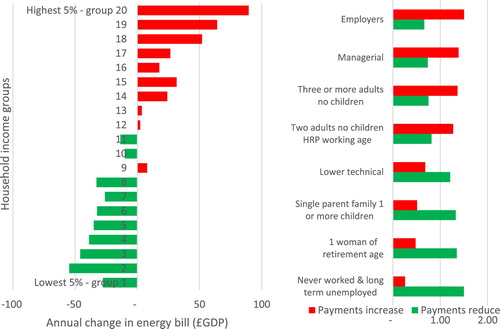
Figure 5. (a) Change in low-carbon policy cost payments for household income groups based on household energy footprint. Green bars are households that would see their contribution falling, red bars are households that would see an increase in payments. (b) Propensities by household type to be paying more or less towards low-carbon policy costs under option 2. We have chosen to display the household types which exhibit the greatest propensities to see a change in their bill. For the full dataset showing all regions, employment and household type please see the Supporting Information datasheet.
By calculating the complete energy use according to the expenditure patterns of household types, we can derive a new set of data which reveals what these households should be contributing towards low-carbon policy costs if the levy was based on their full energy service demand rather direct household energy use.
(a) shows change in payments towards low-carbon policy under this new approach. Around half of UK household income groups would see their contribution falling and the surplus money required would be met by the highest income households. The lowest income households would see their annual contribution fall from an average of £114 per year to £86 (0.83% of household income) and the highest income households would increase their payments from an average of £198 to £288 (0.26% of household income). Compared to the current approach, these new proportions are moving towards parity – where all households pay the same proportion of their income.
By calculating the total energy service demand of households we are able to demonstrate that the current approach to meeting low-carbon policy costs (option 1) is regressive for two reasons. Firstly, increases in gas and electricity bills that result from these costs hit the low-income households hardest, because these energy costs account for a greater share of their income compared to high-income households, a view shared by Advani et al. (Citation2013). Secondly, and less well appreciated, is that energy for home heating and power is a smaller share of the high-income households’ total energy use. As a result, low-carbon policy costs assigned directly to households are only applied to 13% of the total energy use of the high-income households.
In (b) we explore the characteristics of the type of households who would be paying less towards low-carbon policy costs under option 2 and those households who would be paying moreFootnote8. This figure calculates the number of times more likely households are to exhibit the particular demographic characteristic compared to the total sample of households in the LCFS. Geographically, the households paying more towards policy costs under option 2 would be nearly twice as likely to be found in the rural areas of Northern Ireland, whereas households with reduced bills would be 1.4 times more likely to be found in urban Scotland. In terms of household composition, single women of retirement age are likely to see their bills reduce, whereas households with three or more adults are 1.4 times more likely to be paying some of the highest contributions towards low-carbon policy costs. In terms of the employment status of the household reference person, employers are 1.5 times more likely to be paying higher rates and those households who have never worked or are long term unemployed being 1.5 times more likely to pay less.
Calculating the contribution that households pay towards energy policy costs based on their total energy service demands is problematic. It is not feasible to assess the annual energy footprint of the 27 million households in the UK. Potentially these costs could be added to the costs paid by businesses who could pass them on to consumers through higher product prices. This could add 3 pence to an average £10 basket of goods and services in 2016 according to calculations from the Committee on Climate Change (CCC, Citation2017). We would also need to address the energy embodied in imported goods to fully account for the total energy service demands of households. Potentially border tax adjustments could be used, but this process is complex (de Cendra, Citation2006; Sakai & Barrett, Citation2016). Regardless, we argue that option 2 is also regressive because poorer households continue to pay a higher proportion of their income and these households are the least able to pay. In the next section, we propose using a pre-existing mechanism for raising funds: through general taxation, which is designed to be a progressive form of taxation.
3.2.3. Option 3: general taxation
In the UK in 2016, the tax-free personal allowance was £11,000. This means that the first £11,000 earnt by individuals was not taxed. The basic rate of tax was 20% and this is applied to earnings between £11,000 and £42,385. Earnings above £42,385 are taxed at the higher rate of 40%. The LCFS collects data on the income tax paid by all members of the household. We can use this information to distribute the costs of low-carbon policy according to the national share of income tax paid by each household.
This income tax-based approach demonstrates the distributional effects of including low-carbon policy costs in general taxation. Many of the lowest income households would be exempt from paying towards policy costs because they do not meet the £11,000 income threshold. (a) reveals that the lowest income households reduce their annual payments to an average of £16 per year (0.15% of their annual income). The highest income households would now contribute £656 per year (0.58% of their annual income).
Figure 6. (a) Change in low-carbon policy costs based national share of income tax paid by income groups. Green bars are households that would see their contribution falling, red bars are households that would see an increase in payments. (b) Propensities by household type to pay more or less towards low-carbon policy costs under option 3. We have chosen to display the household types which exhibit the greatest propensities to see a change in their bill. For the full dataset showing all regions, employment and household type please see the Supporting Information datasheet.
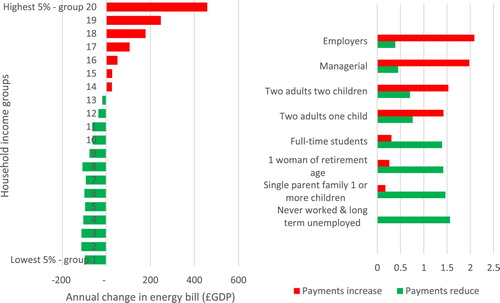
(b)Footnote9 shows that households paying the least towards policy costs in under option 3 would be more likely to be found in urban Wales or rural Yorkshire, have never worked, be long term unemployed or a full-time student and be single parent families or a retired woman living alone. Households paying more are more likely to be employers or managers, be in the rural East Midlands or South East and be a two-parent family.
The types of households we propose be exempt from low-carbon policy costs are households typically classified as being ‘fuel poor’ (Fahmy et al., Citation2011; Middlemiss, Citation2017; Roberts et al., Citation2015). Raising the funds for climate policy costs through general taxation would go some way towards contributing to reducing fuel poverty. A review of fuel poverty in the UK (Hills, Citation2012) recognizes that there are three main drivers: thermal efficiency of homes, household incomes, and energy prices. Removing low-carbon policy costs from energy bills and raising revenue through income tax would tackle the energy price driver. It would also help to ensure that the households in receipt of help from the Carbon Savings Communities and Affordable Warmth schemes gain their full benefit and are not, in effect, self-funding them.
3.3. Comparison of the three approaches to funding low-carbon policy
In this section, we evaluate the three options for funding low-carbon policy costs currently placed on household energy bills by calculating the energy policy payment as a proportion of income by household income group.
shows that, compared with the current approach (option 1), a general taxation approach (option 3) would reduce costs for around 65% of UK households (income groups where the lighter dots sit below the red). The household energy footprint approach (option 2) remains regressive because lower income households are still paying a higher contribution of their income towards the low-carbon policy than higher income households. This is due to lower income households having a more energy intensive basket of goods (a greater proportion of their expenditure is on heat and power), that is, their average toe/£ is higher.
Figure 7. Proportion of household income for energy policy costs under 3 policy options by 20 household income groups.
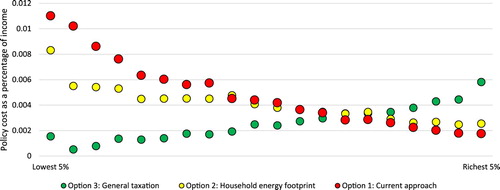
The general taxation approach is more progressive, as we see a higher proportion of income payments the more a household earns. Under the general taxation approach, the lowest income group would save £98 a year with the highest income group paying an additional £458 a year. A saving of £98 a year for the lowest income households could make a significant difference to their welfare, while an additional cost of £9 a week for the households with the highest income is relatively small.
Adopting a general taxation approach may solve the issue of the taxes used to fund climate policy being generally regressive in the developed world (Q. Wang et al., Citation2016). An advantage of the general taxation approach for the UK is that the mechanism for collecting payments exists via income tax. However, not every country taxes individuals based on their income.
It is also important to note that this study has solely focussed on a fairer mechanism for raising low-carbon policy funds which are applied to UK household energy bills. UK households may also indirectly contribute funds to other carbon pricing measures such as the Climate Change Levy and the EU Emissions Trading Scheme, if the increased prices paid by businesses are passed on to the consumer.
4. Conclusion
Policies to support the transition to a low-carbon energy system are essential. These policies help to ensure that, in the future, society does not suffer the consequences of even greater levels of climate change. In addition, many of the levies applied provide a positive return on investment, for example retrofitting our homes. However, there is an upfront cost associated with many of the required strategies to drive innovation in low-carbon supply or efficiency improvements in homes, and this needs to be funded. It is critical that, in doing so, undue burdens of responsibility are not placed on the many households in the UK that struggle to meet basic needs. The current system is both inequitable and fails to recognize the full extent of household energy footprints. To ensure public support for strong climate change action, it is essential that regressive policies are avoided and that a ‘just’ transition is achieved. It is clear that there is a need for practical approaches to funding low-carbon energy policy costs that are easy to administer and are more equitable.
Following a household energy footprint approach for funding low-carbon policy costs is not always possible. At the same time, there is substantial variation in the distributional impacts of the three different approaches outlined in . While none of the funding policies explored offer a ‘perfect solution’ in terms of distributional impacts, raising the funds through general taxation offers a fairer approach in principle. The current approach can be described as a practical one, allowing for policy stability and ensuring that low-carbon energy policy goals are not undermined by annual changes in the Government’s budget, which could pose a risk to long-term funding of low-carbon energy. Clearly, there is a perceived trade-off between policy stability and inequality, but these two elements are not mutually exclusive and we argue for an approach that demonstrates a strong, long-term commitment to the UK’s low-carbon future while, at the same time, addressing inequality.
Many countries are at the beginning of the road in terms of establishing climate policies. There is likely to be greater public acceptability for climate policies that have some associated costs if they minimize, rather than further exacerbate, inequality within the country. Depending on the tax regime within the specific country, using general taxation to cover the costs is likely to be a fairer system than placing the costs on household energy bills.
Disclosure statement
No potential conflict of interest was reported by the author(s).
Additional information
Funding
Notes
1 and
are vectors of total output and final demand, respectively,
is the identity matrix, and
is the technical coefficient matrix, which shows the inter-industry requirements.
is known as the Leontief inverse.
2 If is a row vector of annual energy used by each industrial sector let
. Then,
, which simplifies to
where
is the energy required to meet final demand
.
3 Shelter includes energy used for heat and power and the embodied energy required for household maintenance and services including water, waste and rent.
4 We do not include energy meeting the final demand expenditure of Government and Capital Investment in the household energy footprint
5 £1 = approximately US$1.25.
6 Rural homes in Northern Ireland tend to heat using solid fuel rather than gas or electricity.
7 Please see SI datasheet for full details of the portion of income paid towards low-carbon policy by income group, geographic region, household composition and occupation of the household reference person.
8 There are many ways in which this data can be cut to show the effects of the change in policy. We have selected the six household types who have the greatest propensity to be paying more and the six that have the greatest propensity to be paying less. i.e. those that are over-represented in the sample of households experiencing increases (or decreases) in their bills compared to the national picture. Clearly there could be overlap in these groupings. The complete set of regional, household composition and household occupation propensities can be found in the supporting information dataset.
9 Similar to (b), the six household types with the largest increase in payment and the six with the largest decrease in payment are selected.
References
- Advani, A., Bassi, S., Bowen, A., Fankhauser, S., Johnson, P., Leicester, A., & Stoye, G. (2013). Energy use policies and carbon pricing in the UK. Institute of Fiscal Studies. https://www.econstor.eu/bitstream/10419/119774/1/778487547.pdf
- Andrew, R., & Peters, G. P. (2013). A multi-region input–output table based on the global trade analysis project database (GTAP-MRIO). Economic Systems Research, 25(1), 99–121. https://doi.org/10.1080/09535314.2012.761953
- Andrew, R., Peters, G. P., & Lennox, J. (2009). Approximation and regional aggregation in multi-regional input–output analysis for national carbon footprint accounting. Economic Systems Research, 21(3), 311–335. https://doi.org/10.1080/09535310903541751
- Baiocchi, G., & Minx, J. (2010). Understanding changes in the UK’s CO2 emissions: A global perspective. Environmental Science & Technology, 44(4), 1177–1184. https://doi.org/10.1021/es902662h
- Barrett, J., Peters, G. P., Wiedmann, T., Scott, K., Lenzen, M., Roelich, K., & Le Quéré, C. (2013). Consumption-based GHG emission accounting: A UK case study. Climate Policy, 13(4), 451–470. https://doi.org/10.1080/14693062.2013.788858
- BEIS. (2017). The clean growth strategy leading the way to a low carbon future. https://assets.publishing.service.gov.uk/government/uploads/system/uploads/attachment_data/file/700496/clean-growth-strategy-correction-april-2018.pdf
- BEIS. (2018a). Energy consumption in the UK. Retrieved July 25, 2018, from https://www.gov.uk/government/statistics/energy-consumption-in-the-uk#history
- BEIS. (2018b). Household energy efficiency national statistics, headline release January 2018. Retrieved January 17, 2018, from https://www.gov.uk/government/statistics/household-energy-efficiency-national-statistics-headline-release-january-2018
- Carattini, S., Carvalho, M., & Fankhauser, S. (2018). Overcoming public resistance to carbon taxes. Wiley Interdisciplinary Reviews: Climate Change, 9(5), 1–26. https://doi.org/10.1002/wcc.531
- Carattini, S., Kallbekken, S., & Orlov, A. (2019). How to win public support for a global carbon tax. Nature, 565(7739), 289–291. https://doi.org/10.1038/d41586-019-00124-x
- CCC. (2017). Energy prices and bills – impacts of meeting carbon budgets. Retrieved from https://www.theccc.org.uk/wp-content/uploads/2017/03/Energy-Prices-and-Bills-Committee-on-Climate-Change-March-2017.pdf
- de Cendra, J. (2006). Can emissions trading schemes be coupled with border tax adjustments? An analysis vis-à-vis WTO law. Review of European Community and International Environmental Law, 15(2), 131–145. https://doi.org/10.1111/j.1467-9388.2006.00518.x
- Dietzenbacher, E., Los, B., Stehrer, R., Timmer, M., & de Vries, G. (2013). . The construction of world input–output tables in the wiod project. Economic Systems Research, 25(1), 71–98. https://doi.org/10.1080/09535314.2012.761180
- Druckman, A., & Jackson, T. (2009). The carbon footprint of UK households 1990–2004: A socio-economically disaggregated, quasi-multi-regional input – output model. Ecological Economics, 68(7), 2066–2077. https://doi.org/10.1016/j.ecolecon.2009.01.013
- Edens, B., Hoekstra, R., Zult, D., Lemmers, O., Wilting, H. C., & Wu, R. (2015). A method to create carbon footprint estimates consistent with national accounts. Economic Systems Research, August(4), 440–457. https://doi.org/10.1080/09535314.2015.1048428
- EST. (2017). Clean growth plan: New approaches needed to make fuel poverty impact. Retrieved December 17, 2019, from https://www.energysavingtrust.org.uk/blog/clean-growth-plan-new-approaches-needed-make-fuel-poverty-impact
- Fahmy, E., Gordon, D., & Patsios, D. (2011). Predicting fuel poverty at a small-area level in England. Energy Policy, 39(7), 4370–4377. https://doi.org/10.1016/j.enpol.2011.04.057
- Feng, K., Hubacek, K., Guan, D., Contestabile, M., Minx, J., & Barrett, J. (2010). Distributional effects of climate change taxation: The case of the UK. Environmental Science and Technology, 44(10), 3670–3676. https://doi.org/10.1021/es902974g
- Girod, B., & de Haan, P. (2009). GHG reduction potential of changes in consumption patterns and higher quality levels: Evidence from Swiss household consumption survey. Energy Policy, 37(12), 5650–5661. https://doi.org/10.1016/j.enpol.2009.08.026
- Gough, I., Abdallah, S., & Johnson, V. (2011). The distribution of total greenhouse gas emissions by households in the UK, and some implications for social policy. CASE: Centre for Analysis of Social Inclusion, 152. http://sticerd.lse.ac.uk/dps/case/cp/CASEpaper152.pdf
- Hardt, L., Owen, A., Brockway, P., Heun, M. K., Barrett, J., Taylor, P. G., & Foxon, T. J. (2018). Untangling the drivers of energy reduction in the UK productive sectors: Efficiency or offshoring? Applied Energy, 223, 124–133. https://doi.org/10.1016/j.apenergy.2018.03.127
- Hills, J. (2012). Getting the measure of fuel poverty: Final report of the fuel poverty review. CASE: Centre for Analysis of Social Inclusion, 72. https://sticerd.lse.ac.uk/dps/case/cr/CASEreport72.pdf
- HM Treasury. (2017). Spring budget 2017. Retrieved from https://assets.publishing.service.gov.uk/government/uploads/system/uploads/attachment_data/file/597471/spring_budget_2017_print.pdf
- IEA. (2016). Extended world energy balances: IEA world energy statistics and balances (database). International Energy Agency.
- Ivanova, D., Stadler, K., Steen-Olsen, K., Wood, R., Vita, G., Tukker, A., & Hertwich, E. G. (2016). Environmental impact assessment of household consumption. Journal of Industrial Ecology, 20(3), 526–536. https://doi.org/10.1111/jiec.12371
- Lenzen, M. (1998). Primary energy and greenhouse gases embodied in Australian final consumption: An input-output analysis. Energy Policy, 26(6), 495–506. https://doi.org/10.1016/S0301-4215(98)00012-3
- Lenzen, M., & Dey, C. (2000). Truncation errors in embodied energy analyses of basic iron and steel products. Energy, 25(6), 577–585. https://EconPapers.repec.org/RePEc:eee:energy:v:25:y:2000:i:6:p:577-585
- Lenzen, M., Dey, C., & Foran, B. (2004). Energy requirements of Sydney households. Ecological Economics, 49(3), 375–399. https://doi.org/10.1016/j.ecolecon.2004.01.019
- Lenzen, M., Kanemoto, K., Moran, D., & Geschke, A. (2012). Mapping the structure of the world economy. Environmental Science & Technology, 46(15), 8374–8381. https://doi.org/10.1021/es300171x
- Lenzen, M., Wood, R., & Wiedmann, T. (2010). Uncertainty analysis for multi-region input–output models – a case study of the UK’s carbon footprint. Economic Systems Research, 22(1), 43–63. https://doi.org/10.1080/09535311003661226
- Middlemiss, L. (2017). A critical analysis of the new politics of fuel poverty in England. Critical Social Policy, 37(3), 425–443. https://doi.org/10.1177/0261018316674851
- Miller, R. E., & Blair, P. D. (2009). Input-output analysis: Foundations and extensions. Cambridge University Press.
- Minx, J., Baiocchi, G., Wiedmann, T., Barrett, J., Creutzig, F., Feng, K., Förster, M., Pichler, P.-P., Weisz, H., & Hubacek, K. (2013). Carbon footprints of cities and other human settlements in the UK. Environmental Research Letters, 8(3), 035039. https://doi.org/10.1088/1748-9326/8/3/035039
- NAO. (2016). Controlling the consumer-funded costs of energy policies: The levy control framework. https://www.nao.org.uk/wp-content/uploads/2016/10/Controlling-the-consumer-funded-costs-of-energy-policies-The-Levy-Control-Framework-1.pdf
- Owen, A., Brockway, P., Brand-Correa, L., Bunse, L., Sakai, M., & Barrett, J. (2017). Energy consumption-based accounts: A comparison of results using different energy extension vectors. Applied Energy, 190, 464–473. https://doi.org/10.1016/j.apenergy.2016.12.089
- Owen, A., Scott, K., & Barrett, J. (2018). Identifying critical supply chains and final products: An input-output approach to exploring the energy-water-food nexus. Applied Energy, 210, 632–642. https://doi.org/10.1016/j.apenergy.2017.09.069
- Park, H. C., & Heo, E. (2007). The direct and indirect household energy requirements in the Republic of Korea from 1980 to 2000-an input-output analysis. Energy Policy, 35(5), 2839–2851. https://doi.org/10.1016/j.enpol.2006.10.002
- Preston, I., White, V., Browne, J., Dresner, S., Ekins, P., & Hamilton, I. (2013). Designing carbon taxation to protect low-income households. https://www.jrf.org.uk/report/designing-carbon-taxation-protect-low-income-households
- Roberts, D., Vera-toscano, E., & Phimister, E. (2015). Fuel poverty in the UK is there a difference between urban and rural areas. Energy Policy, 87, 216–223. https://doi.org/10.1016/j.enpol.2015.08.034
- Rosenow, J., Eyre, N., Sorrell, S., & Guertler, P. (2017). Unlocking Britain’s first fuel: The potential for energy savings in UK housing. UKERC/CIED Policy Briefing.
- Rouzet, D., & Miroudot, S. (2013). The cummulative impact of trade barriers along the value chain: An empirical assessment using the OECD inter-country input-output model. OECD.
- Sakai, M., & Barrett, J. (2016). Border carbon adjustments: Addressing emissions embodied in trade. Energy Policy, 92, 102–110. https://doi.org/10.1016/j.enpol.2016.01.038
- Sakai, M., Owen, A., & Barrett, J. (2017). The UK’s emissions and employment footprints: Exploring the trade-offs. Sustainability, 9(7), 1242. https://doi.org/10.3390/su9071242
- Scott, K., Giesekam, J., Barrett, J., & Owen, A. (2018). Bridging the climate mitigation gap with economy-wide material productivity. Journal of Industrial Ecology, 1–14. https://doi.org/10.1111/jiec.12831
- Steen-Olsen, K., Owen, A., Barrett, J., Guan, D., Hertwich, E., Lenzen, M., & Wiedmann, T. (2016). Accounting for value added embodied in trade and consumption: An intercomparison of global multiregional input–output databases. Economic Systems Research, 28(1), 78–94. https://doi.org/10.1080/09535314.2016.1141751
- Tukker, A., de Koning, A., Owen, A., Lutter, S., Bruckner, M., Giljum, S., Stadler, K., Wood, R., & Hoekstra, R. (2018). Towards robust, authoritative assessments of environmental impacts embodied in trade: Current state and recommendations. Journal of Industrial Ecology, 22(3), 585–598. https://doi.org/10.1111/jiec.12716
- UK Data Service. (2019). Living costs and food survey. Office of National Statistics.
- UK Government. (2019). UK’s carbon footprint. Retrieved December 5, 2019, from https://www.gov.uk/government/statistics/uks-carbon-footprint
- Vringer, K., & Blok, K. (1995). The direct and indirect energy requirements of households in the Netherlands. Energy Policy, 23(10), 893–910. https://doi.org/10.1016/0301-4215(95)00072-Q
- Wang, Q., Hubacek, K., Feng, K., Wei, Y.-M., & Liang, Q. (2016). Distributional effects of carbon taxation. Applied Energy, 184, 1123–1131. https://doi.org/10.1016/j.apenergy.2016.06.083
- Wang, J., Lin, J., Feng, K., Liu, P., Du, M., Ni, R., Chen, L., Kong, H., Weng, H., Liu, M., Baiocchi, G., Zhao, Y., Mi, Z., Cao, J., & Hubacek, K. (2019). Environmental taxation and regional inequality in China. Science Bulletin, 64(22), 1691–1699. https://doi.org/10.1016/j.scib.2019.09.017
- Wiedmann, T., Wood, R., Minx, J., Lenzen, M., Guan, D., & Harris, R. (2010). A carbon footprint time series of the UK – results from a multi-region input–output model. Economic Systems Research, 22(1), 19–42. https://doi.org/10.1080/09535311003612591
- Wier, M., Lenzen, M., Munksgaard, J., & Smed, S. (2001). Effects of household consumption patterns on CO2 requirements. Economic Systems Research, 13(3), 259–274. https://doi.org/10.1080/09537320120070149
- Wood, R., Stadler, K., Bulavskaya, T., Lutter, S., Giljum, S., de Koning, A., Kuenen, J., Schütz, H., Acosta-Fernández, J., Usubiaga, A., Simas, M., Ivanova, O., Weinzettel, J., Schmidt, J., Merciai, S., & Tukker, A. (2015). Global sustainability accounting—developing EXIOBASE for multi-regional footprint analysis. Sustainability, 7(1), 138–163. https://doi.org/10.3390/su7010138