
ABSTRACT
Only twelve years after the global financial crisis, in 2020 the world was again in economic crisis. This time around, the source of the crisis was the COVID-19 global pandemic, which has affected the economy differently than the global financial crisis. However, as they were in 2008–2009, conventional macroeconomic theory and models have once again been found wanting, and economists have again turned for insights to the work of Keynes and more recent post-Keynesian scholars. This paper explores a simulation of the macroeconomic impacts of COVID-19 using the E3ME macro-econometric model. It describes two potential recovery packages, one of which could be described as ‘green’. The modelling shows that the green recovery package could support the global economy and national labour markets through the recovery period, outperforming an equivalent conventional stimulus package while simultaneously reducing global CO2 emissions by 12%.
Key policy insights
A green recovery plan is assessed against a reference scenario with COVID-19. It outperforms a non-green recovery plan of comparable value, while also reducing CO2 emissions by up to 12% below the reference scenario (15% below no-COVID baseline).
The policies in the green recovery plan provide different relative impacts. Car scrappage schemes that promote the uptake of electric vehicles have the largest impact on GDP and jobs. Renewables, energy efficiency and electric vehicle promotion all have large impacts on emissions.
The green recovery plan boosts production levels in all sectors of the economy except for energy and utilities. It boosts the consumer services sector that has been most affected initially by the pandemic but also the investment sectors that could suffer longer-term damage.
1. Introduction
As they were in 2008–2009, economists have been caught out by a sudden downturn in economic fortunes. At least in 2020, the shock to economic activity originated externally, from the pandemic rather than from activities in the financial system. This time, no one is blaming the economists for ‘not seeing it coming’. Nevertheless, economists have by and large found their tools to be inadequate for predicting short-term economic outcomes during the pandemic and, in some cases, ill-suited for policy analysis.
As soon as it became clear that it would be necessary to take extraordinary measures to contain the COVID-19 virus, there were demands for assessments of the economic effects. Estimates of the potential impacts on energy consumption and greenhouse gas (GHG) emissions soon followed, even as global oil prices fell dramatically. Suggestions for stimulus packages came not long after, with a general feeling that policy makers were more ‘ready’ for green stimulus than in 2008–2009. However, it could be argued that the economic effects of the pandemic at the sectoral level are more important than the macro level outcomes, both for economic and environmental reasons. Unlike in 2008–2009, the economic slump we are currently facing is rooted initially in reduced levels of consumer spending, rather than reduced levels of investment. This has led to stimulus measures, such as the UK’s ‘Eat out to help out’Footnote1 scheme targeting consumer-facing sectors, which are generally less well suited to green recovery plans.
Overall, the scale of stimulus responses to the COVID-19 crisis, in general, has been much bigger than those that followed the financial crisis. The announced amount of recovery and relief policies by January 2021 was estimated to be about US$15 trillion (based on O’Callaghan et al., Citation2020). In many developed countries, governments have offered levels of support that, before, would have been considered outlandish. Governments have rapidly issued large amounts of new debt. There has been discussion of central banks monetizing some of this debt by directly creating the money that allows governments to spend, a topic previously restricted to Modern Monetary Theory (see e.g. Kelton, Citation2020; Wray, Citation2016).
This is all happening as the world is meant to be embarking on a transition to sustainability, including targets to radically reduce global GHG emissions to net-zero by around mid-century, thereby keeping average surface temperature increase to 1.5°C. Any impacts on emission levels from the pandemic are likely to be temporary but the nature of the economic recovery plans could have a longer-term bearing on the economy, and on the level and pathway of emissions. With budgetary constraints apparently suspended, it is not surprising that activists are asking for economic recovery measures that are consistent with a ‘climate emergency’.
A small number of studies relating to such a green recovery have already been published. All are keen to stress that there is not necessarily a trade-off between ‘recovery’ and ‘green’. For example, Hepburn et al. (Citation2020) identify low-carbon policies, including building energy efficiency retrofits and clean energy infrastructure, as having high economic ‘multiplier’ effects. Mansuy (Citation2020) sketches out an approach for developing policies with both environmental and socio-economic benefits. Mukanjari and Sterner (Citation2020) note that some of the sectors most affected by COVID-19 are energy-intensive and warn that a return to previous behaviour could result in stranded fossil fuel assets. Lahcen et al. (Citation2020) demonstrate positive economic impacts for a green recovery in Belgium using a macroeconomic model.
This paper is one of the few attempts to model the global economic shock from COVID-19 at the sectoral level. It considers two potential recovery plans, one of which could be described as an attempt to ‘return to normal’ and one which is more consistent with a green recovery.
The next section describes briefly some of the key issues with modelling COVID-19 and potential recovery plans. Section 3 describes our modelling approach and the scenarios that were assessed. We present the results of this exercise in Section 4 and offer brief conclusions in Section 5.
2. Why the economic effects of COVID-19 and potential recovery plans are difficult to model
To assess the potential effects of economic recovery plans, it is first necessary to have a representation of the COVID-19 crisis itself. This has proved difficult for modellers for several reasons, as discussed in Pollitt et al. (Citation2020). Some of the most important issues, and how they relate to green recovery plans, are summarized here.
The first and most obvious point is that currently there are no tools that can simultaneously assess the economic and health impacts of any policy measures. Pichler et al. (Citation2020) provide the most advanced attempt so far by linking incidence of disease to activity in certain economic sectors, and it is possible that future agent-based models,Footnote2 like the one described in Epstein and Axtell (Citation1996) and in Beinhocker (Citation2007, Ch 4), could offer more integrated approaches. For now, however, we must keep the economic analysis separate and so the recovery scenarios described in later sections must be carried out under assumptions of successful curtailment of the COVID-19 pandemic, probably through vaccination programmes. If this were not the case, we would need to consider how the policies in a green recovery plan might boost social interaction and therefore likely further spread of disease.
The second issue relates to fundamental uncertainty. The effects of the pandemic have been unprecedented in the modern era and models were used to try to predict things that ‘we simply do not know’ (Keynes, Citation1937). The value of the models was therefore not in prediction but in understanding some of the complexity of the system, for example, linkages between economic sectors or different economic indicators. This analysis can (and has) led to suggestions for entry points for stimulus measures, often with a focus on investment, which is highly compatible with green recovery plans. However, it requires a modelling approach that provides a high level of disaggregation and does not rely on assumptions about perfect knowledge. Pollitt et al. (Citation2020) suggest that out of the various approaches currently around, those based on post-Keynesian theory (Keynes, Citation1921, Citation1936) or complexity theory (Arthur, Citation1999; Miller & Page, Citation2007) are most appropriate.
The final issue relates to capabilities in covering economic supply and demand shocks. The pandemic affected both aggregate supply (e.g. workers unable to work) and aggregate demand (e.g. people staying at home rather than visiting restaurants that are open). To understand the crisis and potential recovery plans, a model must be able to include both kinds of shock. The concept of a stimulus package (green or otherwise) is based on a shortage of aggregate demand (Galbraith, 1975/Citation2017, Ch16) and requires a proper understanding of money and the financial system (Mercure et al., Citation2019; Pollitt & Mercure, Citation2018). Unfortunately, this representation of money and the financial system is missing in most of the Computable General Equilibrium (CGE) and Dynamic Stochastic General Equilibrium (DSGE) models that are used for this type of analysis. Models that come from the post-Keynesian school (see e.g. King, Citation2015, Ch2) again are better placed.Footnote3
3. How we formed our projections
This section describes the method that was applied to form the projections in our analysis. First, we provide a brief introduction to the E3ME macroeconomic model. Then we describe the scenarios that were implemented in the model.
3.1. The E3ME model
E3ME is a macro-econometric model that is based on post-Keynesian theory. The full model manual (Cambridge Econometrics, Citation2019) is available on the model website, www.e3me.com. A complete list of equations is provided in Mercure, Pollitt, Edwards, et al. (Citation2018).
E3ME breaks the world down into 61 regions, with 43 sectors in each region (69 sectors in European countries). Input-output tables link the sectors together and bilateral trade matrices link the regions. provides an overview of the economic accounting system within the model. The input-output table in the top left is a matrix that tracks purchases by industry (in the columns) of intermediate goods and services (the rows) used in production. The components of the final demand for products are listed across the top, as vectors with one row for each product cutting across the vectors. Total demand for each product is obtained by summing along the rows (subtracting imports).
Figure 1. The economic structure of the E3ME model.
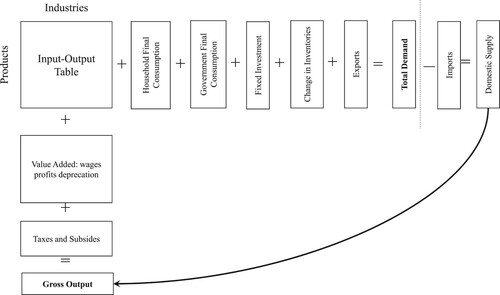
Following the long arrow, companies in each industry adjust their supply of products to meet this demand, unless there is a constraint preventing them from doing so. Usually, there is spare capacity and, as discussed in the next section, capacity constraints changed in the pandemic. The inputs to production in the columns are adjusted accordingly. This process iterates until demand and supply balance.
Intermediate inputs (apart from labour and energy, see below) are largely fixed as a share of production, according to the input–output data. Government spending is given as exogenous. The other components of final demand are estimated using econometric equations that account for both price and quantity effects. There are also econometric equations for sectoral employment, which typically changes proportionally by less than output and displays strong lagged effects.
The model is thus demand driven but supply constrained. Exogenous shocks to demand are entered by adjusting the components of final demand, while supply constraints may be added on the production side.
Energy consumption is represented in the model in both economic and physical terms. The economic representation of energy consumption (input-output coefficients and consumers’ final use of energy) is set to match measures of physical consumption. Physical consumption of energy is determined by a combination of econometric equations for energy demand (by fuel) and, for key energy users (the power sector, passenger transport, household heating and steel), bottom-up models of technology diffusion (Knobloch et al., Citation2018; Mercure, Citation2012; Mercure, Lam, et al., Citation2018). Both the econometric equations and the bottom-up models incorporate path dependency and non-linearities (e.g. economies of scale); the bottom-up models demonstrate ‘S-shaped’ patterns of technology diffusion that are important in determining the take-up of renewables in our green recovery scenario below.
The model’s historical database covers the period 1970–2018 annually, drawing on data from Eurostat, the OECD, IEA and other national and international sources. These data are used to estimate the model’s econometric parameters using methods developed in Hendry et al. (Citation1984) and Engle and Granger (Citation1987). The individual equations are thus validated against historical data and the model as a whole system was validated in Anger et al. (Citation2015). The short-term projections of GDP during the pandemic were compared initially to similar projections from the IMF and more recently to the early GDP estimates for 2020.
A previous version of E3ME was used to assess the 2008–2009 financial crisis in Pollitt and Barker (Citation2009) and a set of ‘green’ recovery packages in Cambridge Econometrics and Ecorys (Citation2011). More recently the model has been applied to assess specific policy analyses (e.g. the European Commission’s 55% GHG target for 2030; see European Commission, Citation2020b) and possible policies to meet 2°C and 1.5°C peak-temperature targets (Mercure, Pollitt, Viñuales, et al., Citation2018; Holden et al., Citation2018).
3.2. Scenarios
In this paper, we present the results from four different scenarios. They are:
No-COVID-19 baseline – this is a ‘business as usual’ case in the absence of COVID-19. Both the economic and energy systems are calibrated to be consistent with the New Policies scenario in IEA (Citation2019). It can broadly be described as a case where current climate pledges (NDCs) are met but no further climate action is taken.
COVID-19 reference scenario – described below, building on our own observation-based sectoral estimates, but calibrated to macroeconomic indicators as published by international organizations including the IMF, the European Commission and the ILO.
VAT recovery plan – in which a reduction in VAT rates is implemented to boost economic growth post-lockdown.
Green recovery plan (GRP) – in which environmental measures are implemented to boost economic growth post-lockdown.
The COVID-19 scenario makes assumptions for several different inputs that reflect different elements of the crisis. Macroeconomic indicators (GDP, employment, consumption, investment, trade) for 2020 have been updated with the latest observed or estimated figures (as of February 2021) from a number of sources including IMF (Citation2021) and European Commission (Citation2020a), but also others (see Supplementary Information for details). Impacts on spending disaggregated by consumption category and employment by industry sector were also estimated using figures from the ILO, the UK’s Office for National Statistics and McKinsey reports (ILO, Citation2021; McKinsey, Citation2020; Office for National Statistics, Citation2020). Other inputs on industry-level economic activity were formed building on various earlier impact assessments (WTO, Citation2020). The main assumptions are presented in the Supplementary Information.
The economic effects of the COVID-19 pandemic may persist for several years (especially in the labour market, see next section) because of lagged responses in the model’s equations. Investment also falls because of the uncertainty, but there is a positive effect from government responses.
We consider two recovery packages in our modelling. These recovery packages should be considered as separate to the economic stabilization measures described above, which are already included in the COVID-19 scenario. In order to simplify the interpretation of results, neither recovery package starts until 2021 in the modelling, even though, in reality, some measures were implemented towards the end of 2020 (or earlier in China). We also do not differentiate the policies between countries or world regions to keep the analysis tractable (and focusing on global results).
The first recovery package includes a VAT (or sales tax) reduction of five percentage points in all countries. Although VAT represents only one option for reducing general taxation and stimulating the economy, VAT reductions could be thought of as a plausible ‘return to normal’ stimulus.Footnote4 After the 2008–2009 financial crisis, the UK effectively used a VAT reduction to boost consumer spending. As the effects of COVID-19 have been felt primarily through consumption (rather than investment, as in 2008–2009), VAT reductions represent a way of encouraging consumers to start spending again, restoring lost economic activity. The VAT reduction is phased out by one percentage point per year, from 2024 onwards, and returns to baseline rates by 2028.
In the modelling, it is assumed that the VAT reduction is passed on to final consumers and so there is no direct change to company profit margins. In normal economic times this would be a standard assumption, but it is much less clear how companies will respond in the aftermath of COVID-19. If companies chose not to reduce prices, the economic stimulus effects from VAT cuts would be much less and the measure would be less effective at preserving jobs that are returning the economy to growth.
The green recovery plan (GRP) costs national governments the same amount as the VAT reduction. A large part of the recovery plan remains VAT reductions (with the same assumption that companies reduce prices in response), but some spending is diverted to five measures that are designed to reduce CO2 emissions.
The first measure is a 50% subsidy for the capital costs in new wind (both onshore and offshore) and solar installations. Wind and solar power are becoming cost competitive even without subsidy in many parts of the world (IRENA, Citation2020), but lower costs alone do not mean that these technologies automatically replace either new or existing fossil-fuel capacity. Typically, new technologies follow an S-shaped path of diffusion, with low rates of additional adoption followed by rapid uptake and eventual market saturation. Wind and solar power are now approaching the steep part of the diffusion curve representing rapid uptake, but this process can be accelerated by adjusting the relative prices of the technologies (see Mercure, Citation2012 for discussion).
The chosen subsidy rate of 50% is arbitrary but large enough to increase immediately rates of uptake, while not placing excessive burden on public funds.Footnote5 In addition to changing the power generation fuel mix, the subsidies lead to lower electricity generation costs and therefore prices, with potential benefits to all users including low income households.
The second measure also focuses on the electricity sector but specifically on national power grids. Governments pay for improvements to grids to accommodate additional wind, solar and other renewable power sources. Additional investment in the grid is necessary among other things to deal with congestion on the existing grid, to reduce the chance of high-cost disruptions (IEA, Citation2020a) and to unlock energy storage potential coming from a wider adoption of electric vehicles. We use the assumption that modernization costs are about US$800 million per 1 GW capacity addition.Footnote6
The third measure is aimed at the transport sector. Car scrappage schemes were popular after the 2008–2009 financial crisis and we include one in the green recovery package. This time, however, the scheme applies only to the purchase of electric vehicles. We assume that the government subsidizes 20% of vehicle cost and that this leads to 4.5% of the fleet turning over between 2021 and 2024 in all countries (1.5% pa). Initially, it is likely that vehicle purchases are from savings (i.e. from individuals unable to spend during lockdown) or from bringing forward purchases that would otherwise have occurred later (Green et al., Citation2020). We assume that, as the recovery picks up, the degree of additionality decreases, with one-third of spending on vehicles not additional in 2022 and two thirds in 2023.
The fourth measure focuses on energy efficiency in buildings. Overall, a 6% reduction in household energy use is achieved over 2021–2023 (compared to baseline), mainly through retrofitting measures, with the costs borne by national governments. In the IEA’s Sustainable Development Scenario (IEA, Citation2019), energy consumption in buildings falls by 28% compared to baseline by 2040, i.e. around 1.6% per annum starting in 2021. The scenario, therefore, represents an acceleration of the average annual rate required to be consistent with the IEA scenario, although not by enough to hit capacity constraints. The cost estimates are derived from IEA (Citation2020b, p. 207), assuming that US$10 million investment is needed to reduce global energy consumption by 1 ktoe.
Finally, a global reforestation programme is added to the green recovery package. Although a simple measure, there is relatively little information available about the potential scale and cost of tree planting. Nevertheless, being both a labour intensive and an easy to roll-out and scale-up activity (Pérez-Cirera & Lieuw-Kie-Song, Citation2020), which brings environmental benefits as well, we consider it a potentially important part of a green recovery scenario. The scenario aims to be ambitious but realistic; we assume that the ongoing reforestation projects of the TrillionTree Campaign (Citation2021) are completed in 2021–2022, amounting to about US$4.2 billion of spending. Further, we assume reforestation efforts to continue through 2022–2023 in areas with high reforestation potential (Bastin et al., Citation2019), amounting to about US$8.4 billion of spending annually. See the Supplementary Information for country coverage. Again, the cost of the programme is borne by national governments, with the payments being passed to the forestry sector in the model. The labour potential of the programme is modelled using the lower bound of estimates by Pérez-Cirera and Lieuw-Kie-Song (Citation2020). The authors acknowledge the potential risks of rapidly expanding reforestation, for example through exposure to fire, crowding out of native vegetation or unethical appropriation of land. The programme must be managed carefully to avoid or minimize adverse impacts on land use, biodiversity and human rights (Heilmayr et al., Citation2020).
A critical element of the analysis is that the two recovery packages bear the same cost to government. The cost of the five measures in the green recovery plan varies between countries and over time but is usually substantially less than the cost of the VAT reductions in the VAT scenario. Therefore, VAT rates are also reduced in the green recovery plan scenario so that the total costs match in each country in each year. In most cases, the green recovery package still includes a reduction in VAT of around 4 percentage points.
4. Results from the modelling
4.1. Economic projections
We first present GDP impacts from the model simulations. The results from the COVID-19 scenario are not predictions; as described in Section 2, we cannot make predictions. Instead, the GDP results should provide context for the more detailed sectoral analysis below, and the assessment of alternative recovery plans.
shows the impacts at global level. In 2020, global GDP falls by 4.2% (based on market exchange rates); without COVID-19, GDP would have grown by 2.7%, so the net loss of production was just below 7%.
Figure 2. Global GDP in each scenario.
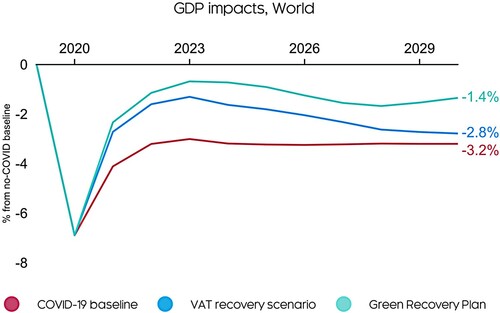
After 2020, there are both lagged effects, pushing global GDP down further, and rebound effects bringing back lost growth. Overall, these effects broadly cancel out, indicating a return to previous levels of economic growth, without making up for growth lost over the period of the pandemic. This does not assume lingering effects (e.g. fear of being in crowds), which lie beyond the scope of the modelling.
Using the COVID-19 scenario as a reference case, the model can then assess the relative merits of the recovery plans. These recovery plans aim to boost employment rather than GDP (see below), but they also impact production levels. In the VAT only scenario, the reductions in VAT increase consumer spending, with around 4 percentage points of lost GDP recovered in 2021. As the VAT reductions are phased out, GDP remains higher than in the case with no government support.
The GRP is more successful still in stimulating an economy that is well below capacity levels. The immediate boost in 2021 is higher than that from the VAT reductions and the GRP measures could replace more than half the lost production compared to the COVID-19 scenario.Footnote7 This helps labour markets to recover (see below).
The two recovery plans have the same cost to government, but the GRP is more effective in increasing GDP. The main reason is that two measures in the GRP leverage (or ‘crowd in’) private investment expenditure, leading to a larger economic stimulus effect; these are the renewables subsidies (50% privately financed) and the car scrappage schemes (80% privately financed). The additional private investment in renewables and vehicles more than offsets other reduced spending in the energy sector that results from the energy efficiency measures.
To summarize, the boosts to GDP in the VAT scenario comprise the public stimulus from the VAT cuts, plus multiplier effects. In the GRP or green scenario, the boost to GDP comprises the public stimulus from (smaller) VAT cuts plus green measures, the leveraged additional private investment minus reduced energy sector expenditure, and multiplier effects. The difference between the two scenarios is thus the leveraged investment effects minus reduced energy sector expenditure.
shows the difference between the GRP and VAT scenario in selected economies. Of the major economies shown, the EU benefits the most. The long-term effects of renewables investments in the EU are complemented with faster growth in the motor vehicles sector. Employment also grows faster, leading to higher consumption growth towards 2030 and output in consumer services.
Figure 3. Benefits of the GRP, GDP % difference from VAT scenario.
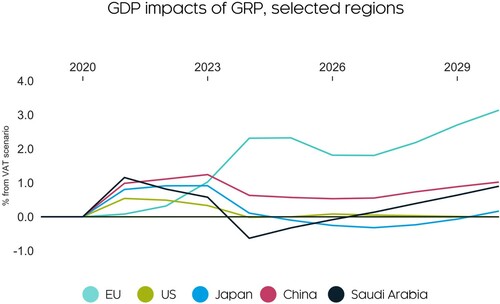
The boost to GDP is smaller in China and Japan. In China, VAT reductions are particularly effective at boosting consumer spending, so some of the additional investment in the GRP is offset by lower consumption. In Japan, the investment effects of the GRP are smaller because there is lower uptake of renewables, reflecting existing market shares. However, both countries still see higher short-term benefits in the GRP, in the range of 1–2%.
There are periods where energy exporters, such as Saudi Arabia, could lose out in the GRP scenario. This is not because of domestic action taken by Saudi Arabia, but because the rest of the world reduces oil demand due to increased electric vehicle penetration. However, overall, Saudi Arabia produces positive outcomes by 2030 as well.
The effects in the US are broadly neutral because the positive effects of increased renewable and electric vehicle investment roughly balance the negative macroeconomic effects of reduced oil production.
shows the sectoral impacts in each scenario compared to the no-COVID baseline. The first column shows the impacts of COVID-19 at sectoral level. Consumer and transport services were most affected in 2020 by the pandemic. Only the construction sector was not affected negatively initially, but slow yet ongoing declines in investment mean that the construction sector is affected to a much greater extent by 2022.
Table 1. Output by sectors, % difference from no-COVID baseline in 2020 and 2022.
The other three columns in show how the sectoral impacts change in the scenarios in 2022. The year 2022 falls in the middle of the stimulus period, and so offers a comparison between the different recovery plans. Both recovery plans are effective at increasing demand for consumer services and transport. The biggest impacts in the GRP are seen in construction and advanced manufacturing (which includes engineering), reflecting the focus on investment.Footnote8 Due to indirect multiplier effects, the GRP performs better than the VAT recovery plan even in consumer services.
The model results suggest that the impacts of COVID-19 on employment could be substantial. In 2020, employment falls by more than 120 million people (excluding temporary enforced job losses due to lockdown conditions) compared to the no-COVID baseline (see ). This is in line with ILO (Citation2021). Furthermore, the magnitude of the impact, the shape of the recovery (with lost growth not made up in later years) and the lagged nature of labour markets means that any recovery in employment is ambiguous.
Figure 4. Employment effects in all the scenarios, difference from no-COVID baseline.
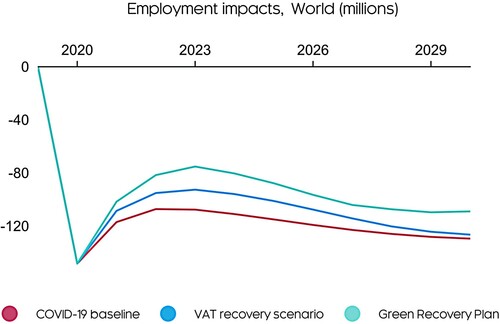
The rationale for the recovery plans is to boost employment and governments must ensure that support leads to job creation rather than higher firm profitability (e.g. through automation). Given likely continued restrictions on social interaction (not included in the modelling), this issue seems particularly relevant to economic recovery from COVID-19. In the modelled scenarios, it is assumed that there is some monitoring to ensure that support measures do not result in profiteering.
The VAT recovery plan is effective at preventing further job losses, but it has little long-term benefit for employment. The GRP brings back more of the jobs lost in 2020 and is more effective in the long-term. By 2023, the difference in jobs to that in the COVID-19 reference scenario is more than 30 million and there are still benefits by 2030.
As always with employment impacts, we must consider whether the jobs being created match against the available skills base. The sectoral results show that the GRP includes a shift from energy sectors to construction and manufacturing. However, shows that even in the GRP scenario, global employment is still below no-COVID baseline levels (and in every sector, though it is higher than in the COVID-19 reference scenario), suggesting that there is available labour capacity. The issue is more likely to relate to specific training, for example in home retrofitting.
4.2. Projections of CO2 emissions
While the primary aim even of the green recovery package is to restore employment, the model results for CO2 emissions are instructive. The pandemic causes global CO2 emissions to fall by 5% (see ). These results do not include any additional environmental measures that were imposed during the crisis (e.g. bringing forward the closure of coal power plants).
Figure 5. CO2 effects in all the scenarios, difference from no-COVID baseline.
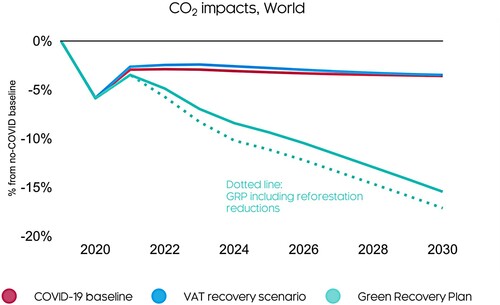
However, the modelling reveals two important factors in projecting emissions. First, the concentration of the loss of production in service sectors limits the reduction in emissions. There may also be some loss of economies of scale; for example, factories that are not producing still use some energy. Second, the reduction in CO2 emissions declines over time. Additionally, CO2 emissions are lower in 2030 than in the no-COVID baseline only because GDP never recovers to (no-COVID) baseline levels.
The effects of the two recovery packages are markedly different. The reduction in VAT causes a small increase in emissions because of higher production levels. However, the measures in the GRP could reduce emissions by around 12% compared to the COVID-19 reference scenario, and by 15% compared to the no-COVID baseline. The contribution of reforestation to emission reductions has been calculated separately using an average CO2 removal rate based on Bernal et al. (Citation2018).
4.3. The relative contribution of each policy
shows the relative contributions that each policy in the GRP makes. The shares have been estimated by running separate scenarios with each of the individual policies and rebasing so that they add to 100%. They, therefore, discount (usually small) interaction effects between the policies.
Figure 6. Relative contribution of each GRP policy (excl VAT change).
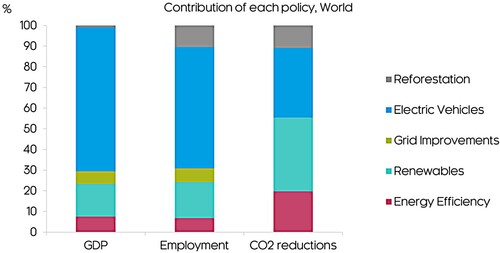
The figure shows that there are some trade-offs that must be made. The car scrappage scheme to promote electric vehicle uptake is most effective in boosting GDP (70% of the total) because it leverages in the most private investment. The impacts are greatest in developed countries where EVs already have market share. Investment in renewables accounts for 16% of the GDP increase, with smaller contributions from the other policies. The relative impacts on employment are similar, except that reforestation makes more of a contribution (10% of total jobs). Tree planting is labour-intensive (especially in developing countries), although relatively low value in economic terms. Although energy efficiency and renewables are generally less labour-intensive than electric vehicles, the size of the extra investment in vehicles means that EV jobs make up the largest share in the chart.
Taken together, however, the EV subsidies and reforestation account for less than half the emission reductions (44%). The energy efficiency measures and renewables subsidiesFootnote9 here show larger impacts. Paradoxically, these results reflect how cheap these technologies now are; they can achieve large emission reductions but not support many jobs.
4.4. Our results in the context of long-term climate targets
The focus of the modelling exercise is on how to achieve short-term economic recovery while boosting longer-term sustainability. Although our results suggest that the policies modelled could boost GDP while simultaneously reducing emissions, the reduction in emissions is not sufficient to keep the world on track for 2°C, let alone 1.5°C. Further policy action is clearly needed; our results should be interpreted as showing the benefits of bringing some of this action forward to a time of economic stagnation, rather than replacing other potential policy. Furthermore, because of learning effects, aggressive policy action now could reduce future costs, for example by reducing prices for renewables or electric vehicles (Grubb et al., Citation2021).
However, there is an alternative line of thought that GDP growth itself may be incompatible with meeting emissions targets, and ‘degrowth’ is required (e.g. Diesendorf, Citation2020; Hickel, Citation2020; Kallis et al., Citation2020; Wiedmann et al., Citation2020). Our results from the VAT scenario, where emissions rise, demonstrate the linkage between higher consumption and growing emission levels.
There is a strong case for degrowth to avoid the unsustainable use of non-renewable resources and destruction of ecosystems, but it is less clear-cut in the case of climate change where zero-carbon technological substitutes largely exist.Footnote10 However, as Hickel (Citation2020, p. 138) notes, ‘Our insistence on perpetual growth is making our task much more difficult than it needs to be’.
There is more consensus that a degrowth process would need to be managed to ensure equitable outcomes and protection of vulnerable populations. The sectors that have been impacted the most during the pandemic are not those in which production would be most restricted in a degrowth scenario. Our conclusion is thus that the policies modelled are important for bringing back activities in these sectors but we should not rule out other measures to limit more harmful types of economic growth.
4.5. Key uncertainties and sensitivity analysis
When projecting ten years ahead, especially when starting from a period of rapid change, there is a considerable degree of uncertainty in the results. In this section, we test some of the key sensitivities in the GRP scenario.
There are some more general uncertainties and limitations to the modelling that must be acknowledged. The no-COVID baseline case and COVID-19 reference scenario are uncertain themselves, as recent adjustments to GDP and employment figures have shown. However, it seems highly likely that economies will need stimulus in some form, so the rationale for the scenarios holds. In the absence of a silver-bullet technology, additional climate action will still be required.
The pandemic will also cause behavioural change that is not captured in the model’s econometric parameters. For example, changes in transport patterns may persist, even once GDP has recovered. These changes could affect both the levels of activity in the scenarios and the differences between the scenarios, and these could be described as a special form of the ‘Lucas Critique’ (Lucas, Citation1976) where parameters estimated from one policy regime may not be appropriate for another. The changes will gradually be built into the model as data become available, but for now remain limitations in the approach. The modeller’s intuition is that they would be unlikely to change the conclusions of this paper but it is not possible to test every possible outcome.
To understand the key sensitivities around the policies in the GRP scenario, we have tested some alternative variants. The results are shown in and (for easier interpretation, this time as % difference from the COVID-19 reference case).
Figure 7. Sensitivity testing of GDP impacts.
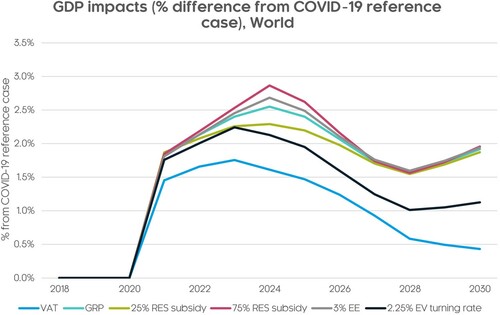
Figure 8. Sensitivity testing of employment impacts.
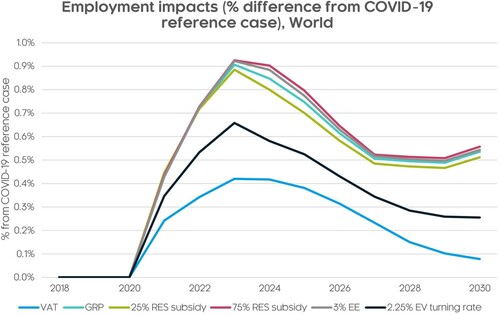
Two of the sensitivities test different subsidies for renewables. A lower subsidy rate has a smaller GDP and employment impact because there is less investment. A higher subsidy rate boosts GDP and employment initially, but then there is a saturation effect later in the period because the share of non-renewable capacity that is left and needs replacing becomes substantially lower. Reducing the amount of energy efficiency investment has a similar modest effect. The largest impact comes from reducing the uptake of electric vehicles (by half), reflecting that this policy has the largest GDP and employment impacts overall. Nevertheless, in all cases, the positive GDP and employment impacts remain comfortably above that of the VAT scenario.
5. Conclusions
To understand the potential impacts of green recovery plans, we must first understand the impacts on the economy from COVID-19. As in 2008–2009, adequately representing the crisis in models is proving to be difficult for economists.
Although no available models can incorporate both the economic and health impacts of any particular set of policy measures, it is still possible to generate insights from models that have a high degree of sectoral disaggregation, and which can incorporate both economic demand and supply shocks. From the present range of models available, those based on either post-Keynesian or complexity economics appear most suitable.
The modelling presented in this paper, using the post-Keynesian E3ME model, defines the crisis as a combination of demand and supply shocks. We show a path for GDP that is broadly consistent with other non-model-based estimates and we describe a pattern of sectoral impacts consistent with a consumption shock. We then assess two possible recovery plans: one based on VAT (sales tax) reductions, and one green recovery plan that spends some of the public money, otherwise made available through VAT reduction, to reduce GHG emissions.
We show that both plans help with economic recovery but, even though large, they are not sufficient to counter the negative effects of COVID-19. The GRP leverages private finance on top of additional public expenditure, and therefore outperforms the VAT cuts in all aspects. This analysis shows that a broad portfolio of measures is required to meet the goals of protecting jobs and reducing emissions.
We end with two main conclusions. The first is for economists, who must improve their capability to model economic slumps and crises. This will require moving away from equilibrium models that make strong assumptions about stabilizing, forward-looking behaviour. The second conclusion is for policy makers considering recovery plans. Numerous studies have shown that large amounts of investment are required to meet global climate targets. In this paper, we have shown that an investment-led green recovery plan performs better than an equivalent reduction in VAT, by contributing both to meeting the climate targets, while simultaneously boosting jobs and the economy.
Supplemental Material
Download MS Word (35.7 KB)Disclosure statement
No potential conflict of interest was reported by the author(s).
Additional information
Funding
Notes
1 Which may have led to an increased spread of COVID-19 according to published analysis (Fetzer, Citation2020).
2 These models are derived from complexity-based approaches, see Arthur (Citation1999) and Miller and Page (Citation2007).
3 It is also worth noting the accounting-based approach used by Guan et al. (Citation2020). The approach is broadly consistent with the post-Keynesian school but holds many parameters fixed that would vary in a full modelling approach.
4 Previous simulations with the E3ME model have shown that changes in VAT and income tax rates have similar sized impacts, and that both are more effective at boosting GDP than reductions in labour or profit taxes (Park et al., Citation2016).
5 Different rates were tested by introducing a higher (75%) and lower (25%) subsidy sensitivity. The 75% subsidy leads to high levels of early scrapping of coal and gas-fired capacity. The 25% subsidy rate was more cost-effective for government (i.e. higher multiplier effect) but the overall rate of uptake was much lower, making the measure less effective as an economic stimulus (see Section 4.5). We therefore selected the 50% rate for the main analysis.
6 In the IEA Sustainable Recovery (IEA, Citation2020a, pp. 108, 123) scenario, annual grid investment is assumed to be US$110 bn; at the same time additional RES deployment is assumed to be about 130–150 GW.
7 These results do not include any longer-term potential benefits from improved air quality and better health in the GRP.
8 Even though the investment in the GRP is in the energy sector, there is additional production in sectors like construction and engineering that make and install the equipment.
9 It is not possible to separate grid improvements from renewables in this context; both are required for the additional renewables to be viable.
10 See discussion here: https://www.ineteconomics.org/perspectives/collections/is-green-growth-possible-a-debate.
References
- Anger, A., Barker, T., & Syddall, M. (2015). Modelling decarbonisation scenarios. In T. Barker & D. Crawford-Brown (Eds.), Decarbonising the world’s economy (pp. 85–122). Imperial College Press.
- Arthur, W. B. (1999). Complexity and the economy. Science, 284(5411), 107–109. https://doi.org/https://doi.org/10.1126/science.284.5411.107
- Bastin, J.-F., Finegold, Y., Garcia, C., Mollicone, D., Rezende, M., Routh, D., Zohner, C. M., & Crowther, T. W. (2019). The global tree restoration potential. Science, 365(6448), 76–79. https://doi.org/https://doi.org/10.1126/science.aax0848
- Beinhocker, E. D. (2007). The origin of wealth. Random House.
- Bernal, B., Murray, L. T., & Pearson, T. R. H. (2018). Global carbon dioxide removal rates from forest landscape restoration activities. Carbon Balance and Management, 13(1), Article 22. https://doi.org/https://doi.org/10.1186/s13021-018-0110-8
- Cambridge Econometrics. (2019). E3ME manual: Version 6.0. www.e3me.com
- Cambridge Econometrics and Ecorys. (2011). Assessing the implementation and impact of green elements of member states’ national recovery plans. Final report for the European Commission, DG Environment. https://ec.europa.eu/environment/enveco/growth_jobs_social/pdf/studies/green_recovery_plans.pdf
- Diesendorf, M. (2020). COVID-19 and economic recovery with effective climate mitigation. Global Sustainability, 3, e36. https://doi.org/https://doi.org/10.1017/sus.2020.32
- Engle, R. F., & Granger, C. W. J. (1987). Cointegration and error correction: Representation, estimation and testing. Econometrica, 55(2), 251–276.
- Epstein, M. E., & Axtell, R. (1996). Growing artificial societies: Social science from the bottom up. Brookings Institution.
- European Commission. (2020a). European economic forecast autumn 2020. https://ec.europa.eu/info/business-economy-euro/economic-performance-and-forecasts/economic-forecasts/autumn-2020-economic-forecast_en
- European Commission. (2020b). Stepping up Europe’s 2030 climate ambition: Investing in a climate-neutral future for the benefit of our people. https://ec.europa.eu/clima/sites/clima/files/eu-climate-action/docs/impact_en.pdf
- Fetzer, T. (2020). Subsidizing the spread of COVID19: Evidence from the UK’s eat-out-to-help-out scheme (CEPR Discussion Papers). https://ideas.repec.org/p/cpr/ceprdp/15416.html
- Galbraith, J. K. (2017). Money: Whence it came, where it went. Princeton University Press (Original work published 1975).
- Green, D., Melzer, B. T., Parker, J. A., & Rojas, A. (2020). Accelerator or brake? Cash for clunkers, household liquidity, and aggregate demand. American Economic Journal: Economic Policy, 12(4), 178–211. https://doi.org/https://doi.org/10.1257/pol.20170122
- Grubb, M., Drummond, P., Poncia, A., McDowall, W., Popp, D., Samadi, S., Penasco, C., Gillingham, K., Smulders, S., Glachant, M., & Hassall, G. (2021). Induced innovation in energy technologies and systems: A review of evidence and potential implications for CO2 mitigation. Environmental Research Letters, 16(4), Article 043007. https://doi.org/https://doi.org/10.1088/1748-9326/abde07
- Guan, D., Wang, D., Hallegatte, S., Davis, S. J., Huo, J., Li, S., Bai, Y., Lei, T., Xue, Q., Coffman, D., Cheng, D., Chen, P., Liang, X., Xu, B., Lu, X., Wang, S., Hubacek, K., & Gong, P. (2020). Global supply-chain effects of COVID-19 control measures. Nature Human Behaviour, 4(6), 577–587. https://doi.org/https://doi.org/10.1038/s41562-020-0896-8
- Heilmayr, R., Echeverría, C., & Lambin, E. F. (2020). Impacts of Chilean forest subsidies on forest cover, carbon and biodiversity. Nature Sustainability, 3(9), 701–709. https://doi.org/https://doi.org/10.1038/s41893-020-0547-0
- Hendry, D. F., Pagan, A., & Sargan, J. D. (1984). Dynamic specification. In Z. Griliches & M. D. Intriligator (Eds.), Handbook of econometrics (pp. 1023–1100). North Holland.
- Hepburn, C., O’Callaghan, B., Stern, N., Stiglitz, J., & Zenghelis, D. (2020). Will COVID-19 fiscal recovery packages accelerate or retard progress on climate change? Oxford Review of Economic Policy, 36(Suppl_1), S359–S381. https://doi.org/https://doi.org/10.1093/oxrep/graa015
- Hickel, J. (2020). Less is more. Penguin.
- Holden, P. B., Edwards, N. R., Ridgwell, A., Wilkinson, R. D., Fraedrich, K., Lunkeit, F., Pollitt, H., Mercure, J. F., Salas, P., Lam, A., & Knobloch, F. (2018). Climate–carbon cycle uncertainties and the Paris agreement. Nature Climate Change, 8(7), 609–613. https://doi.org/https://doi.org/10.1038/s41558-018-0197-7
- IEA. (2019). World energy outlook. OECD/IEA.
- IEA. (2020a). Sustainable recovery. OECD/IEA.
- IEA. (2020b). World energy outlook 2020. OECD/IEA.
- ILO. (2021). ILO monitor: COVID-19 and the world of work (7th ed.). https://www.ilo.org/wcmsp5/groups/public/—dgreports/—dcomm/documents/briefingnote/wcms_767028.pdf
- IMF. (2021). World economic outlook update – 2021 January. https://www.imf.org/en/Publications/WEO/Issues/2021/01/26/2021-world-economic-outlook-update
- IRENA. (2020). Renewable power generation costs in 2019. https://www.irena.org/-/media/Files/IRENA/Agency/Publication/2020/Jun/IRENA_Power_Generation_Costs_2019.pdf
- Kallis, G., Paulson, S., D’Alisa, G., & Demaria, F. (2020). The case for degrowth. Polity.
- Kelton, S. (2020). The deficit myth: Modern monetary theory and how to build a better economy. Hachette Book Group.
- Keynes, J. M. (1921). A treatise on probability. Macmillan.
- Keynes, J. M. (1936). The general theory of employment, interest and money. Macmillan.
- Keynes, J. M. (1937). The general theory of employment. Quarterly Journal of Economics, 51(2), 209–223. https://doi.org/https://doi.org/10.2307/1882087
- King, J. E. (2015). Advanced introduction to post Keynesian economics. Edward Elgar.
- Knobloch, F., Pollitt, H., Chewpreecha, U., Daioglou, V., & Mercure, J.-F. (2018). Simulating the deep decarbonisation of residential heating for limiting global warming to 1.5°C. Energy Efficiency, 12(2), 521–550. https://doi.org/https://doi.org/10.1007/s12053-018-9710-0
- Lahcen, B., Brusselaers, J., Vrancken, K., Dams, Y., Da Silva Paes, C., Eyckmans, J., & Rousseau, S. (2020). Green recovery policies for the COVID-19 crisis: Modelling the impact on the economy and greenhouse gas emissions. Environmental and Resource Economics, 76(4), 731–750. https://doi.org/https://doi.org/10.1007/s10640-020-00454-9
- Lucas, R. (1976). Econometric policy evaluation: A critique. In K. Brunner & A. Meltzer (Eds.), The Phillips curve and labor markets (pp. 19–46). Elsevier.
- Mansuy, N. (2020). Stimulating post-COVID-19 green recovery by investing in ecological restoration. Restoration Ecology, 28(6), 1343–1347. https://doi.org/https://doi.org/10.1111/rec.13296
- McKinsey. (2020). Consumer sentiment and behavior continue to reflect the uncertainty of the COVID-19 crisis. https://www.mckinsey.com/business-functions/marketing-and-sales/our-insights/a-global-view-of-how-consumer-behavior-is-changing-amid-covid-19
- Mercure, J.-F. (2012). FTT: Power: A global model of the power sector with induced technological change and natural resource depletion. Energy Policy, 48, 799–811. https://doi.org/https://doi.org/10.1016/j.enpol.2012.06.025
- Mercure, J.-F., Knobloch, F., Pollitt, H., Paroussos, L., Scrieciu, S., & Lewney, R. (2019). Modelling innovation and the macroeconomics of low-carbon transitions: Theory, perspectives and practical use. Climate Policy, 19(8), 1019–1037. https://doi.org/https://doi.org/10.1080/14693062.2019.1617665
- Mercure, J.-F., Lam, A., Billington, S., & Pollitt, H. (2018). Integrated assessment modelling as a positive science: Private passenger road transport policies to meet a climate target well below 2°C. Climatic Change, 151(2), 109–129. https://doi.org/https://doi.org/10.1007/s10584-018-2262-7
- Mercure, J.-F., Pollitt, H., Edwards, N. R., Holden, P. B., Chewpreecha, U., Salas, P., Lam, A., Knobloch, F., & Vinuales, J. E. (2018). Environmental impact assessment for climate change policy with the simulation-based integrated assessment model E3ME-FTT-GENIE. Energy Strategy Reviews, 20, 195–208. https://doi.org/https://doi.org/10.1016/j.esr.2018.03.003
- Mercure, J.-F., Pollitt, H., Viñuales, J. E., Edwards, N. R., Holden, P. B., Chewpreecha, U., Salas, P., Sognnaes, I., Lam, A., & Knobloch, F. (2018). Macroeconomic impact of stranded fossil fuel assets. Nature Climate Change, 8(7), 588–593. https://doi.org/https://doi.org/10.1038/s41558-018-0182-1
- Miller, J. H., & Page, S. E. (2007). Complex adaptive systems’: An introduction to computational models of social life. Princeton University Press.
- Mukanjari, S., & Sterner, T. (2020). Charting a ‘Green path’ for recovery from COVID-19. Environmental and Resource Economics, 76(4), 825–853. https://doi.org/https://doi.org/10.1007/s10640-020-00479-0
- O’Callaghan, B., Yau, N., Murdock, E., Janz, A., Flodell, H., Blackwood, A., Purroy Sanchez, L., Sadler, A., Wen, E., Kope, H., Tillman-Morris, L., Ostrovsky, N., Tritsch, D., Lee, D., Hristov, D., & Hepburn, C. (2020). Oxford economic stimulus observatory. https://www.smithschool.ox.ac.uk/publications/wpapers/Oxford-Economic-Stimulus-Observatory.xlsx
- Office for National Statistics. (2020). Consumer trends time series. https://www.ons.gov.uk/economy/nationalaccounts/satelliteaccounts/datasets/consumertrends.
- Park, S.-J., Ogawa, Y., Kawakatsu, T., & Pollitt, H. (2016). The double dividend of environmental tax reform in East Asian economies. In S. Lee, H. Pollitt, & S.-J. Park (Eds.), Low-carbon, sustainable future in East Asia (pp. 121–139). Routledge.
- Pérez-Cirera, V., & Lieuw-Kie-Song, M. (2020). Nature hires: How nature-based solutions can power a green jobs recovery. http://www.ilo.org/employment/units/emp-invest/rural-urban-job-creation/WCMS_757823/lang–en/index.htm
- Pichler, A., Pangallo, M., del Rio-Chanona, R. M., Lafond, F., & Farmer, J. D. (2020). Production networks and epidemic spreading: How to restart the UK economy? (INET Oxford Working Paper No. 2020-12).
- Pollitt, H., & Barker, T. (2009). Modelling the financial crisis with the global E3MG model. IUP Journal of Applied Economics, VIII(5–6), 5–31.
- Pollitt, H., Lewney, R., Kiss-Dobronyi, B., & Lin, X. (2020). A post-Keynesian approach to modelling the economic effects of COVID-19 and possible recovery plans (C-EENRG Working Paper). https://www.ceenrg.landecon.cam.ac.uk/publications/working-papers-1
- Pollitt, H., & Mercure, J.-F. (2018). The role of money and the financial sector in energy-economy models used for assessing climate and energy policy. Climate Policy, 18(2), 184–197. https://doi.org/https://doi.org/10.1080/14693062.2016.1277685
- TrillionTree Campaign. (2021). Together let’s plant a trillion trees! https://trilliontreecampaign.org
- Wiedmann, T., Lenzen, M., Keyßer, L. T., & Steinberger, J. K. (2020). Scientists’ warning on affluence. Nature Communications, 11(1), Article 3107. https://doi.org/https://doi.org/10.1038/s41467-020-16941-y
- Wray, L. R. (2016). Modern money theory: A primer on macroeconomics for sovereign monetary systems. Palgrave MacMillan.
- WTO. (2020). Methodology for the WTO trade forecast of April 8, 2020. https://www.wto.org/english/news_e/pres20_e/methodpr855_e.pdf