
 ?Mathematical formulae have been encoded as MathML and are displayed in this HTML version using MathJax in order to improve their display. Uncheck the box to turn MathJax off. This feature requires Javascript. Click on a formula to zoom.
ABSTRACT
We investigate the relationship between research and development (R&D) and firm-level carbon emissions to determine whether firm type matters. Multinational corporations (MNCs) with high-level R&D expenditure have a greater ability than domestic companies to generate technologies that will contribute to controlling environmental pollution and climate change. However, we know less about whether MNCs contribute to reducing carbon emissions worldwide, because they also have the ability to overcome controls on pollution levels by shifting their production facilities from regions with more restrictions to those with fewer restrictions. The sample we use includes roughly 20,000 firm-year observations from 44 countries for the period 2003-2019. We find that MNCs decrease their carbon emissions by increasing their R&D spending more than domestic companies do. We further demonstrate that foreign direct investment (FDI) creates opportunities for MNCs to adjust their overall carbon emissions if they are located in developed countries.
Key policy insights
R&D investment in low-carbon technologies and practices decreases carbon emissions intensity and the impact on average is larger for MNCs than for domestic companies, showing that firm-type matters to emission reduction outcomes.
MNCs manage their geographically diversified production so as to avoid reducing overall net global carbon emissions.
MNCs may seek to operate in places that are weaker in enforcement of emissions reduction, which in turn raises their net global carbon emissions.
MNCs located in developed countries are comparatively more important as corporate actors to drive carbon emission reductions due to changing location of operations.
1. Introduction
In this study, we investigate the role of research and development (R&D) expenditures scaled by total sales (R&D intensity) in reducing firm-level carbon dioxide (CO2) emissions scaled by sales (emissions intensity). We focus on identifying the role of multinational corporations (MNCs) compared with domestic companies in achieving carbon neutrality. This is important because it is unclear whether MNCs contribute to reducing carbon emissions worldwide. MNCs are less financially constrained than domestic companies, based on their internally generated funds and often have easy access to international capital markets to finance their significant R&D capacities. However, they can shift carbon-intensive activities among geographically diversified production facilities, thus avoiding a reduction in emissions.
Switching from traditional energy resources—such as coal, gas, and oil—to renewable energy in production processes requires high R&D spending to create rapid innovation technologies. MNCs rely heavily on R&D activities to internalize their product innovation capabilities and tend to have the resources to support such large-scale spending. Although MNCs have a financial advantage in investing in high R&D, which contributes to the goal of reducing carbon emissions, they can create carbon leakage that affects the overall net reduction in global carbon emissions. Globalization has enabled countries and businesses worldwide to become more connected. Foreign direct investment (FDI) can create an important way for MNCs to stimulate the transfer of resources in the form of knowledge and technological spillovers, human capital, or know-how and can create carbon leakage. Therefore, we investigate the moderating effect of FDI with R&D intensity on carbon emissions intensity and how MNCs play a role in explaining this joint impact.
We perform our empirical analysis using a unique international sample consisting of 2,884 firms from 44 countries for the period 2003-2019. We find that R&D intensity reduces firm-level carbon intensity, but this reduction is more pronounced for MNCs than for domestic companies. We observe that FDI enhances the role of R&D intensity in reducing carbon emissions by domestic companies, especially in developed countries. However, we also find by using a subsample of developed countries that MNCs with high R&D and FDI achieve less emissions reduction than MNCs with high R&D and low FDI. This provides evidence of carbon leakage managed by MNCs and confirms the pollution-haven hypothesis. Consistent with this view, our findings show that the role of R&D in reducing emissions is less pronounced in MNCs in developing countries. We find that firms with high R&D expenditures and with high FDI create, on average, lower emissions than those with high R&D and low FDI in developing countries, but there is no any significant difference in the role of R&D and FDI in contributing the emission reduction between MNCs and domestic companies. These results indicate that MNCs, especially if the home base of the MNC is located in developed countries, are more important to drive carbon emissions than domestic companies are. Because all these findings emerge in the period after 2015, they raise doubts about whether targets in climate policies can be reached.
This study contributes to the existing literature by investigating the differences in the impact of R&D expenditures on the reduction of carbon emissions among MNCs, using a large international sample. Although Alam et al. (Citation2019) examine the same relationship at firms in Canada, France, Germany, Japan, the UK, and the US, they do not include the important role of MNCs. The use of a higher number of sample countries also enables our study to capture the moderating effects of FDI and R&D through a comparison between MNCs and domestic companies. In addition, we provide additional evidence for the developing literature on carbon leakage by MNCs.
The remainder of this paper is structured as follows. Section 2 reviews the literature and develops the hypotheses. Section 3 describes the data and the empirical methodology employed in the analysis. Section 4 presents the empirical results and interpretations. Finally, Section 5 concludes the study by providing suggestions for future research.
2. Hypotheses development
2.1. R&D and carbon emissions intensity
The need to combat climate change by reducing greenhouse gases, particularly CO2 emitted by industrial companies worldwide, has become a vital topic on the international agenda. Creating technologies to achieve this goal requires high R&D spending, in order to develop new low-carbon products and processes, resulting in greater efficiency and advancement in the production chain. In the existing literature exploring the relationship between R&D investment and harmful emissions, Florida (Citation1996) finds that R&D commitments by companies lead to fewer carbon emissions. Cole et al. (Citation2005) find a negative relationship between R&D spending and air pollution intensity. Likewise, Kinzig and Kammen (Citation1998) highlight the importance of technological innovation through R&D activities in terms of reducing CO2 emissions in the long term. Moreover, Carrión-Flores and Innes (Citation2010) find a negative relationship between environmental innovation and pollution at US firms.
Among studies covering multiple countries, Alam et al. (Citation2019) find a negative relationship between R&D investment and firms’ carbon emissions intensity using a sample comprising Canada, France, Germany, Japan, the UK, and the US for the period 2004-2016. They highlight the fact that this selection of sample countries is important as they are characterized by high R&D spending. Wang et al. (Citation2020) examine the impact of energy efficiency, oil prices, environmental pressure, R&D, and policy on the intensity of renewable energy consumption. Using a sample of G20 countries, they find that R&D is essential in promoting renewable energy because in 60% of the sample countries, it is of primary significance.
The literature review summarized above leads to the following hypothesis:
Hypothesis 1: An increase in R&D intensity in companies significantly reduces carbon emissions intensity.
2.2. Multinationals, R&D, and carbon emissions intensity
An important question about the relationship between R&D and carbon emissions is whether firm type matters. R&D plays a remarkable role in creating new energy systems by enabling advancements in technology, leading to new and possibly more sustainable solutions that might also result in greater social welfare (Costello, Citation2016). According to Sagar and Zwaan (Citation2006), technological innovation is essential for achieving a clean energy economy, but might lead to additional costs for companies and hence impair their financial performance (Palmer et al., Citation1995). MNCs perform large-scale R&D activities to internalize their product innovation capabilities (Buckley & Casson, Citation2009; Gao & Chou, Citation2015). Geographic diversification increases financial flexibility by lowering cash-flow volatility and enabling access to international capital markets (Jang, Citation2017). Therefore, a major difference is expected to be found between MNCs and domestic companies in terms of the role of R&D in reducing emissions intensity. Wang and Jin (Citation2007) report that foreign companies in China pollute less than their domestic counterparts, which is attributable to their superior technology and energy efficiency. However, in a recent study, Ben-David et al. (Citation2021) examine the allocation of emissions between home and foreign countries and find that foreign emissions by MNCs increased in countries to which they exported during the period 2008-2015, whereas domestic emissions moderately declined. Therefore, our second hypothesis tests the advantage of MNCs over domestic companies in reducing carbon emissions.
Hypothesis 2: The negative impact of R&D intensity on carbon emissions intensity is stronger at MNCs than domestic companies.
2.3. The moderating role of foreign direct investment
Introducing strong environmental regulations can encourage MNCs in heavily polluting industries to move their operations in order to reduce the cost of compliance with pollution controls (Cole & Elliott, Citation2003). The discrepancy in the goals of global energy policies across countries and the conflicts of interest create opportunities for MNCs to shift the location of their production from countries that aim to protect the climate by promoting clean energy to other countries that prioritize economic growth and rely on traditional energy sources. This strategy is discussed in the literature in terms of the pollution-haven hypothesis (Dam & Scholtens, Citation2012). The existence of this hypothesis raises concern about how carbon emissions targets to reduce global warming can be met and has thus rekindled controversy in recent literature over the role of MNCs in explaining carbon leakage (e.g. Bartram et al., Citation2022; Ben-David et al., Citation2021; Dechezleprêtre et al., Citation2022).
In our empirical setting, any increase in the overall emissions of MNCs with high R&D increases along with the level of FDI and implies the emergence of environmental costs caused by increased pollution and natural resource exhaustion as a result of MNCs moving their operations to countries where environmental regulations are less rigorous, i.e. to developing countries. The hypothesis testing this debate is as follows:
Hypothesis 3: FDI weakens the negative joint impact between MNCs and R&D on carbon emissions intensity.
3. Data and methodology
3.1. Sample
We extract firm-level data for our sample from the Thomson Reuters Eikon/Datastream database, and we gather country-level data from the World Bank and OECD databases for the period 2003-2019. We include both active and inactive firms in our sample to accurately account for the potential risk of survivorship bias. We relied on the data available on CO2 emissions from the Thomson Reuters Eikon Environmental Social and Governance (ESG) database. Furthermore, we exclude financial companies and utilities from the sample. Financial companies are characterized by higher leverage and different business models than nonfinancial companies. Utilities often have strong connections to the government and are affected by the state's decisions. We also exclude firms from countries with fewer than ten firm-year observations. Our final sample consists of 19,929 firm-year observations of 2,884 unique companies from 44 countries. To control for outliers in the data, we winsorize data for all firm-level continuous variables at 1% and 99%.
We classify our sample countries as developed (or advanced economies) and developing countries (including emerging economies) based on the International Monetary Fund (IMF) World Economic Outlook Database, which classifies economies as advanced and emerging or developing based on factors such as high per capita income, exports of diversified goods and services, and greater integration into the global financial system.
We define a firm as an MNC if the foreign sales ratio, which is the percentage of international sales represented by sales generated from operations in foreign countries, to total (consolidated) sales, is higher than 25%.Footnote1 The location of a MNC is based on its fiscal home country where its corporate headquarter is identified by Thomson Reuters.
3.2. Variables
The dependent variable is emissions intensity, which is calculated as the ratio of the CO2 emissions level in kilotons to total sales. The main independent variable is R&D intensity, which is the ratio of R&D expenditure to total sales. We employ several control variables that are mainly used by Alam et al. (Citation2019). We control for firm size, the use of debt, and capital intensity, all of which indicate higher pollution levels and greater opportunities for environmental innovation (Carrión-Flores & Innes, Citation2010). We also control for the impact of a firm's stock market and financial accounting performance using Tobin's Q and the ratio of return on assets (ROA). Firms might invest more in R&D when they perform better. Dividends paid and investments in fixed assets (capital expenditures) reduce free cash flows to fund R&D internally. The government, by increasing its ownership, could demonstrate its preference for becoming cleaner. Therefore, we also include in our analysis the percentage of shares held by the state.
Furthermore, we include country-level variables in the regression models. The gross domestic product (GDP) is a proxy for a country's economic development. We use the average of these six components the Worldwide Governance Indicators (WGI) from the World Bank to measure country-level regulatory quality. This variable refers to the ability of the government to establish sound legislation.Footnote2 FDI is a flow variable that indicates international financial inflow (OECD, Citation2017). The definitions of these variables are in .
Table 1. Definitions of variables.
3.3. Regression model
We employ a multivariate regression analysis with ordinary least squares (OLS) estimates using time-series cross-sectional data. Our basic model tests for a potentially significant impact of R&D intensity and the joint impact of R&D with MNC_Dummy on emissions intensity. We then employ the following regression model:
(1)
(1) where i is the firm, c is the country, and t is the year. To control for the effects of omitted variable bias, we include fixed effects (FE) for the country, industry, and year, in addition to the firm- and country-level characteristics shown in EquationEquation (1)
(1)
(1) , which might influence the environmental performance of companies. In testing H3, we add FDI and the following interaction variables to our model: (R&DxFDI), (FDIxMNC_Dummy), and (R&DxFDIxMNC_Dummy). All independent variables, excluding FDI, which already represents capital flows in a specific year, are lagged by one year to control for the possibility of reverse causality between R&D and carbon emissions intensity, as higher carbon emissions require higher R&D expenditures to achieve emissions reductions.
4. Empirical results
4.1. Descriptive statistics, time trend, and correlations
presents descriptive statistics for all the variables incorporated into the empirical analysis. The sample contains 19,929 firm-year observations for all variables. The table reports the mean, median, standard deviation, minimum, and maximum values of the variables. We observe that the net amount of overall CO2 emissions is, on average, 18.4% of sales. The ratio of R&D to sales has a mean of 2.6%, but the values are from 0 to 3.9%, showing the range across sample firms. MNCs with foreign sales comprise 65.6% of the observations, on average, accounting for 45% of total consolidated sales. The mean value of leverage implies that total debt is 24.9% of total assets. Total assets, on average, are 1.893 times higher than sales. The mean value of Tobin's Q indicates that the total market value is 1.757 times higher than the book value of total assets. Based on ROA, accounting profitability is 5.1% of assets. Firms paid dividends in 85% of all observations. The state owns 2.3% of the shares. The mean value of capital expenditures makes up 5.3% of total assets.
Table 2. Descriptive statistics.
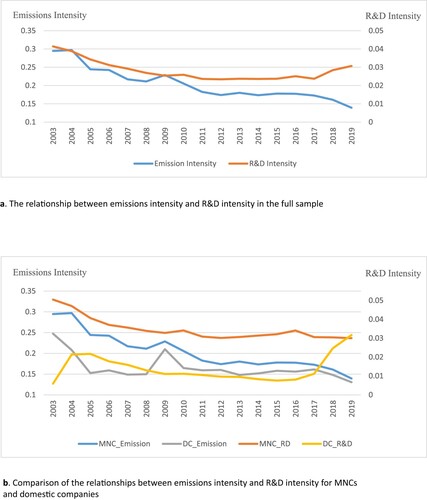
shows the time trend in the relationship between carbon emissions intensity and R&D intensity. a shows the overall trend between the two variables, and b compares the same trend between MNCs and domestic companies. The mean values of firm-level emissions intensity decreased over time, but the reduction is a clear trend, especially after 2009. This can be explained by increasing awareness of climate change, leading to environmental concerns and stricter regulations. R&D intensity, on average, also decreased until 2009 and then steadily increased for the rest of the sample period. This demonstrates their negative relationship. The comparison between MNCs and domestic companies in b shows that the negative trend in the relationship between emissions intensity and R&D intensity is stronger for MNCs than for domestic companies. At domestic companies, dramatic changes led to a possible R&D effect on reduction in emissions intensity in recent years. These two figures also demonstrate structural changes during the period, such as the 2007–2008 global financial crisis and the 2015 Paris agreement. Our analysis includes year-fixed effects to control for these differences over time.
Figure 1. Time trend in carbon emissions and R&D expenditures a. The relationship between emissions intensity and R&D intensity in the full sample b. Comparison of the relationships between emissions intensity and R&D intensity for MNCs and domestic companies
reports the country composition descriptive statistics for all 44 sample countries. A large proportion of our observations come from Japan, the United Kingdom, and the United States and a smaller proportion from Argentina, Peru, and Saudi Arabia. The mean values of carbon emissions intensity vary across countries. Companies voluntarily disclose their CO2 emissions levels with different scopes, direct and indirect, in their supply chains. The data are based on values voluntarily disclosed by companies that could be located mostly in developed countries. We use this input as intensity at the firm level by standardizing it with companies’ sales. Countries with very high average R&D spending include Denmark, Israel, Switzerland, and the United States. The highest average values of FDI inflows and outflows are shown for Hong Kong, Ireland, Luxembourg, the Netherlands, and Singapore. Australia, Canada, Denmark, Finland, Germany, Hong Kong, Ireland, Luxembourg, The Netherlands, New Zealand, Norway, Singapore, Sweden, Switzerland, and the United Kingdom, which have high values of WGI indicating overall quality of institutions. Lastly, China and the United States have the highest average values for both GDP and country-level carbon emissions.
Table 3. Sample countries and mean values of selected variables.
To test for potential multicollinearity, we employ Pearson's pairwise correlation method and the results are found in . The coefficients of the variables in the regression model are not high, implying that the analysis does not suffer from multicollinearity.
Table 4. Pairwise correlations.
4.2. Regression results and discussion
4.2.1. Multinationals, R&D and carbon emissions
reports the first results on the main relationship between R&D intensity and carbon emissions intensity, including the role of MNCs in explaining the differences in this relationship between MNCs and domestic companies. We create different model specifications. In model 1, the estimated coefficient of R&D is −0.301 and is statistically significant at the 1 percent level, without controlling for firm- and country-specific characteristics but including country-, industry-, and year-fixed effects. Models 2–4 include these control variables, and model 5 excludes year-fixed effects but includes country-level variables to ensure that possible correlations between them do not alter our main results. The negative impact of R&D indicates that companies’ carbon emissions decrease with increases in R&D intensity; therefore, investing in R&D activities improves their energy-related environmental performance. This effect is also economically significant, as a one-standard deviation increase in R&D intensity decreases emissions intensity by 2.6 percentage points [(−0.301 × 0.088) = −0.026], which represents 14.4% [(0.026/0.184) = 0.144] of its mean. This evidence supports H1.
Table 5. The effect of R&D Intensity on Emissions Intensity.
All the other models, that is models 2–5 in , include MNC_Dummy and the joint impact on the level of carbon emissions of R&D intensity and being an MNC (interaction variable R&DxMNC_Dummy). In all specifications, the estimated coefficients of R&D and this interaction are negative and statistically significant at the 1 percent level. These results indicate that the carbon emissions of domestic companies decrease with R&D, but the emissions reduction for MNCs is significantly larger. According to models 3–5, the increase in emissions reduction intensity by MNCs is 3.6% [(−0.409 × 0.088) −0.036], with a one-standard deviation increase in R&D. These findings provide supporting evidence for H2.
The effects of the control variables on emissions intensity are as follows: firm size, capital intensity (CapInt), and capital expenditure-asset ratio (CapEx) have positive and statistically significant effects, whereas ROA and government ownership (GovOwn) influence emissions negatively and significantly. The effects of leverage, Tobin's Q, dividends per share, and regulatory quality on emissions intensity are negligible.
4.2.2. FDI and carbon leakage by MNCs
In this section, we empirically test H3, regarding the moderating role of FDI in explaining the joint impact of R&D intensity and the MNC_Dummy on emissions intensity. A triple interaction variable, consisting of country-level FDI and the firm-level variables R&D and MNC_Dummy, shows how the overall level of carbon emissions by MNCs change with higher levels of R&D and FDI. We report our results in for the full sample, as well as two subsamples defined based on economic development, divided into developed and developing countries.
Table 6. The role of FDI in explaining the effect of R&D Intensity on Emissions Intensity.
In all regression specifications, the variables of interest are as follows: (R&DxMNC_Dummy) measures the difference in the emissions intensity between MNCs and domestic companies at high levels of R&D spending when the level of FDI is low; (R&DxFDI) measures the difference in the relationship between R&D intensity and the emissions intensity at high levels of FDI; and (R&DxFDIxMNC_Dummy) measures the difference in the role of MNCs with high R&D and high FDI in explaining the carbon intensity compared with those with low FDI.
The results reported in demonstrate important differences in the results between the sample groups of developed countries and developing countries. In models 1 and 2, and 3 and 4 for the full sample and for developed countries, respectively, the interaction variable (R&DxMNC_Dummy) has negative and significant coefficients. This indicates a reduction in emissions intensity for MNCs (relative to domestic companies) with high R&D and low FDI. The moderating role of FDI in explaining the effect of R&D on emissions intensity (R&DxFDI) has negative and statistically significant estimated coefficients for the full sample as well as subsamples of both developed and developing countries. This evidence implies that R&D expenditures reduce carbon emissions more when FDI is high than when FDI is low (captured by the variable R&D). As the existing literature suggests, this can be explained by the knowledge and technological spillovers that occur through FDI and enable host countries to accelerate innovation and increase efficiency. Finally, the triple interaction variable (R&DxFDIxMNC_Dummy) has positive and significant coefficients in all specifications for the full sample and the subsample of developed countries. The findings with the full sample show that the overall emissions levels of MNCs decrease less (e.g. −0.598 versus −0.116 in model 2) when they have high R&D and high FDI (−0.598 + 0.482) relative to MNCs with high R&D and low FDI (captured by the variable R&DxMNC_Dummy). The results with model 4 for developed countries imply that the overall emissions levels of MNCs even increase [e.g. −0.547 versus (+0.183 = −0.547 + 0.730)] when they have high R&D and high FDI relative to MNCs with high R&D and low FDI. We interpret these findings as an (indirect) indication of carbon leakage resulting from MNCs management of FDI, especially if they are located in developed countries. In this relationship, the type of country matters because MNCs from developed countries have a greater ability to shift their production location.Footnote3
Model 5 and 6 present the results for the subsample of firms in developing countries. In these countries, firm-level pollution is expected to be higher because of more lax environmental regulations. The evidence provided for the full sample and developed countries is no longer relevant to the results with developing countries. The results in models 5 and 6 do not have any significant estimated coefficients for the variables of interest. Statistically insignificant coefficients of variable (R&DxFDIxMNC_Dummy) show that there is not any significant difference in the role of R&D and FDI in contributing the emission reduction between MNCs and domestic companies when their home bases are in developing countries. This indicates the weaker ability of MNCs from developing countries to shift their production facilities. However, the result for variable (RDxFDI) in model 5 is still statistically significantly negative. This implies that firms, MNCs or domestic companies, in developing countries decrease, on average, carbon emissions by increasing R&D investment, accompanied by and reinforced by high FDI flows. This highlights the importance of FDI in the development of new technologies and in achieving energy efficiency in developing economies.
4.2.3. Subperiod analysis
We perform our main regressions for two subsample periods to control for potential bias as a result of a general decrease in CO2 emissions in the later portion of the sample period. We divide the sample into two periods: 2002–2014 and 2015–2019. The results reported in show that the differences in the effect of R&D on emissions reduction between MNCs and domestic companies in both periods have some similar characteristics. Carbon intensity is reduced more by MNCs with high R&D than by domestic companies. However, the main results that support all three hypotheses occur only in the sample period 2015-2019. In Model 4, the interaction between R&D and MNC_Dummy has a significantly negative effect, indicating a further reduction in emissions intensity by MNCs with high R&D and low FDI. The interaction between R&D and FDI also has a significantly negative impact on emissions intensity, showing that R&D expenditures reduce carbon emissions more with high FDI than with high R&D and low FDI. Thus, for domestic companies, high FDI combined with high R&D helps to reduce CO2 — where FDI is low, the reduction is smaller. However, the joint impact of FDI, R&D, and MNC_Dummy has a positive and significant effect on emissions intensity. This provides evidence of the ability of MNCs to shift carbon-intensive production to less-regulated countries, thereby leading to carbon leakage, as the overall emissions levels of MNCs with high R&D decrease less when they have high FDI rather than when they have low FDI.
Table 7. Subperiod analysis for the role of FDI in explaining the effect of R&D Intensity on Emissions Intensity.
4.3. Implications for future research
The evidence we have provided above suggests that MNCs management of FDI results in carbon leakage, especially if the home base of the MNC is located in developed countries. Unfortunately, our evidence simply implies the ability of MNCs located in developed countries to manage operations such that they lead to carbon leakage. To draw a strong conclusion on this point, it would be necessary to examine the ability of MNCs to shift production location, and to compare activity based on their home location in developed countries versus their operations in developing countries, perhaps through a straightforward assessment intra-corporate activities across nations. We leave this point for future research.
Another potentially interesting point for future research may be look at low and high emission categories of countries. A consistent result would be to show that the emissions reduction by MNCs be related to transferring their operations from countries with already relatively high-emissions to other countries with high or low emissions, but with weaker in enforcement of emissions reduction. Such evidence could provide additional support for the view that MNCs with foreign operations can both drive emission reductions but also cause carbon leakage by managing their level and targeting of FDI. To support this point, we ran the same regressions as in for subsamples of high- and low-emissions countries separated by the median value of a country's emissions, but the results were contradictory to the above predictions. Therefore, this point creates a fruitful direction for future research.
Future research on MNCs and the role of FDI to moderate CO2 emissions has to be considered in more detail to understand and validate the conclusion about carbon leakage. For example, Volkswagen from Germany could move one of its plants to a developing country with less stringent carbon laws. However, another alternative could be that MNCs actually transform their business for example to create some green mergers and thus drive emissions down. This could allow a MNC to still be in the same industry, but use more efficient, less polluting technologies. This requires a very deep and detailed analysis into the carbon emissions of global polluters. In this respect, we could argue that the reduction in emissions of Volkswagen overtime is due to the nature of its management decisions and whether they are organic (driven by internal changes) or inorganic (driven by external changes). This is similar to how corporate growth can be organic (e.g. driven by new investments or increasing revenues any in current product lines) or inorganic (e.g. buying companies through mergers). Investigating the root of MNCs activities will shed light how they manage carbon leakage by allocating their production facilities, in developing countries or in countries with high or low emissions.
5. Conclusions
Around the world, companies in most countries are facing growing pressure to curb their greenhouse gas emissions. Given that R&D expenditures are a key driver of low-carbon innovation, and that MNCs have a greater capacity to engage in R&D, MNCs can play a crucial role in achieving emissions reduction goals. This paper offers useful insights into the particular role of MNCs relative to domestic companies regarding the impact of R&D intensity on reducing companies’ carbon emissions. The role that MNCs play is important because they have significant resources to spend on R&D activities to create and stimulate the transfer of knowledge and technology, human capital, and know-how. Thus, they are expected to contribute to policies to control global warming by promoting actions to reduce carbon emissions. However, they also have the potential to relieve this pressure to change by shifting their production activities across regions, thereby leading to carbon leakage. We employ an empirical strategy to identify the net impact of MNCs in reducing global carbon emissions.
We find that a R&D investment has a negative effect on carbon emissions (thus reducing emissions) for both domestic companies and MNCs. However, the decrease in the sample mean of carbon emissions intensity is, on average, 19.5% higher for MNCs revealing a stronger role for MNCs in emission reduction. We document a moderating effect of FDI, measured as flows of investments in an economy, on the relationship between R&D intensity and carbon emissions for MNCs. Indeed, this joint effect shows the ability of MNCs to transfer their carbon emissions to places that are weaker in enforcement of emissions reduction. In developed countries, the decrease in overall carbon emissions is smaller for MNCs that have high R&D when they have comparatively high flows of FDI; these high flows of FDI are expected to occur within the same MNC corporate boundary. This result provides evidence of carbon leakage by MNCs, especially if the home base of the MNC is located in developed countries.
Finally, our main findings note the ability of MNCs with high R&D to reduce carbon emissions, while also managing carbon leakage through FDI. These findings are more relevant to the later portion of the period that we study (2015-2019). Increasing awareness of climate change and tightening of environmental regulations worldwide may explain this, and this perhaps leads to more careful oversight of FDI deals by MNCs for their own benefit. Thus, in a world with uneven regulatory settings, MNCs can continue to produce in a way that is harmful to the climate without bearing significantly higher costs.
This study offers several important policy insights. From the perspective of company management, this study demonstrates the significant effect of R&D intensity on reducing carbon emissions, not only in MNCs but also in domestic companies, confirming the importance of undertaking such investment. Hence, to improve firms’ energy-related environmental performance, managers should focus on coordinating research activities to develop new, low-carbon technologies that lead to innovation efficiency. From a policy perspective, it is important to recognize the influence of R&D spending on firms’ environmental performance, which directly affects climate change; companies – and MNCs in particular – should be given incentives to spend on R&D. MNCs could also be incentivized to help their counterparts to develop new technologies to control carbon emissions when transferring production to developing countries. However, governments need to pay attention to MNCs’ production activities that can be shifted across country boundaries as part of corporate operations to avoid compliance with climate mitigation policies.
Acknowledgments
The authors thank Bert Scholtens, Arjan Trinks, Daniel te Kaat, the editor Jan Corfee-Morlot, and three anonymous reviewers for valuable comments and suggestions on earlier versions of the paper.
Disclosure statement
No potential conflict of interest was reported by the author(s).
Notes
1 The use of this threshold is a common practice in the literature, between 20%, used by Park et al. (Citation2013), and 30%, used by Aabo et al. (Citation2015). A firm with a ratio of less than 25% or no foreign sales is defined as a domestic company.
2 The WGI data aims to construct detailed measures of governance for broad cross-country comparisons. A country level indicator relates to the process of selecting, monitoring and replacing governments, the capacity of the government to formulate and implement sound policies, and the respect of citizens and the state for the institutions that govern economic and social interactions among them. It contains six measures; voice and accountability, political stability and absence of violence, government effectiveness, regulatory quality, rule of law, and control of corruption.
3 For further research on cross-country comparisons, see Musolesi et al. (Citation2010), who investigate CO2 emissions in 109 countries with a very long time panel for the period 1959-2001. They show that the length of the series is important for showing dynamic associations between economic growth and emissions levels based on different subsamples of countries.
References
- Aabo, T., Pantzalis, C., & Park, J. C. (2015). Multinationality and opaqueness. Journal of Corporate Finance, 30, 65–84. https://doi.org/10.1016/j.jcorpfin.2014.12.002
- Alam, M., Atif, M., Chu, C. C., & Soytas, U. (2019). Does corporate R&D investment affect firm environmental performance? Evidence from G-6 countries. Energy Economics, 78, 401–411. https://doi.org/10.1016/j.eneco.2018.11.031
- Bartram, S. M., Hou, K., & Kim, S. (2022). Real effects of climate policy: Financial constraints and spillovers. Journal of Financial Economics, 143(2), 668–696. https://doi.org/10.1016/j.jfineco.2021.06.015
- Ben-David, I., Jang, Y., Kleimeier, S., & Viehs, M. (2021). Exporting pollution: Where do multinational firms emit CO2? Economic Policy, 36(107), 377–437. https://doi.org/10.1093/epolic/eiab009
- Buckley, P. J., & Casson, M. (2009). The internalisation theory of the multinational enterprise: a review of the progress of a research agenda after 30 years. Journal of International Business Studies, 40(9), 1563–1580. https://doi.org/10.1057/jibs.2009.49
- Carrión-Flores, C. E., & Innes, R. (2010). Environmental innovation and environmental performance. Journal of Environmental Economics and Management, 59(1), 27–42. https://doi.org/10.1016/j.jeem.2009.05.003
- Cole, M. A., & Elliott, R. J. R. (2003). Determining the trade-environment composition effect: The role of capital, labor and environmental regulations. Journal of Environmental Economics and Management, 46(3), 363–383. https://doi.org/10.1016/S0095-0696(03)00021-4
- Cole, M. A., Elliott, R. J. R., & Shimamoto, K. (2005). Industrial characteristics, environmental regulations and air pollution: An analysis of the UK manufacturing sector. Journal of Environmental Economics and Management, 50(1), 121–143. https://doi.org/10.1016/j.jeem.2004.08.001
- Costello, K. (2016). A primer on R&D in the energy utility sector. National Regulatory Research Institute. Energy and Environment. Report No. 16-05. https://pubs.naruc.org/pub/FA85BA08-D94D-E40F-B7E1-98F834372877.
- Dam, L., & Scholtens, B. (2012). The curse of the haven: The impact of multinational enterprise on environmental regulation. Ecological Economics, 78, 148–156. https://doi.org/10.1016/j.ecolecon.2012.04.011
- Dechezleprêtre, A., Gennaioli, C., Martin, R., Muûls, M., & Stoerk, T. (2022). Searching for carbon leaks in multinational companies. Journal of Environmental Economics and Management, 112, 102601. https://doi.org/10.1016/j.jeem.2021.102601
- Florida, R. (1996). Lean and green: The move to environmentally conscious manufacturing. California Management Review, 39(1), 80–105. https://doi.org/10.2307/41165877
- Gao, W., & Chou, J. (2015). Innovation efficiency, global diversification, and firm value. Journal of Corporate Finance, 30, 278–298. https://doi.org/10.1016/j.jcorpfin.2014.12.009
- Jang, Y. (2017). International corporate diversification and financial flexibility. The Review of Financial Studies, 30(12), 4133–4178. https://doi.org/10.1093/rfs/hhx065
- Kinzig, A., & Kammen, D. (1998). National trajectories of carbon emissions: Analysis of proposals to foster the transition to low-carbon economies. Global Environmental Change, 8(3), 183–208. https://doi.org/10.1016/S0959-3780(98)00013-2
- Musolesi, A., Massimiliano, M., & Zoboli, R. (2010). A panel data heterogeneous Bayesian estimation of environmental Kuznets curves for CO2 emissions. Applied Economics, 42(18), 2275–2287. https://doi.org/10.1080/00036840701858034
- OECD. (2017). Green growth indicators 2017. OECD Publishing.
- Palmer, K., Oates, W. E., & Portney, P. R. (1995). Tightening environmental standards: The benefit-cost or the no-cost paradigm? Journal of Economic Perspectives, 9(4), 119–132. https://doi.org/10.1257/jep.9.4.119
- Park, S. H., Suh, J., & Yeung, B. (2013). Do multinational and domestic corporations differ in their leverage policies? Journal of Corporate Finance, 20, 115–139. https://doi.org/10.1016/j.jcorpfin.2012.08.001
- Sagar, A., & Zwaan, B. (2006). Technological innovation in the energy sector: R&D, deployment, and learning-by-doing. Energy Policy, 34(17), 2601–2608. https://doi.org/10.1016/j.enpol.2005.04.012
- Wang, H., & Jin, Y. (2007). Industrial ownership and environmental performance: Evidence from China. Environmental and Resource Economics, 36(3), 255–273. https://doi.org/10.1007/s10640-006-9027-x
- Wang, Q., Li, S., & Pisarenko, Z. (2020). Heterogeneous effects of energy efficiency, oil price, environmental pressure, R&D investment, and policy on renewable energy -- evidence from the G20 countries. Energy, 209, 118322. https://doi.org/10.1016/j.energy.2020.118322