
ABSTRACT
State-owned enterprises (SOEs) are a major force in energy markets in BRICS countries, including in national energy innovation systems. In this research, we investigate whether some of the largest oil and gas SOEs in BRICS countries – Brazil’s Petrobras, Russia’s Gazprom, India’s ONGC, China’s PetroChina, and South Africa’s PetroSA – are greening their innovation to foster low-carbon solutions in line with shifting government Nationally Determined Contributions (NDCs) on climate change. We compare the innovation priorities of oil and gas SOE firms in these countries, and specifically their efforts in clean energy from 2005 to 2020. Using an original data set, we set forth case studies on five SOEs and highlight differences in their approaches across a number of different features: the level of government ownership; firms’ revenues and financial health; national government policy; and global oil prices. We assess factors influencing performance in clean energy innovation and study each firm’s success in registering patents for specifically targeted energy technologies. Our findings show that all five SOEs demonstrate only modest efforts in greening of their energy innovation outcomes. We observe their heavy reliance on oil revenues to finance innovation and note how ongoing responsibility to avoid oil and gas shortages is stifling green innovation. We recommend policy avenues for governments to realign SOE practices with climate action and specifically NDCs.
Key policy insights
Low-carbon transition of SOEs in BRICS countries is a necessary and important part of a government’s national strategy for achieving sustainable growth.
However, the largest SOEs in BRICS countries are making only limited progress in aligning their innovation towards low-carbon goals.
Fiscal incentives will help support green innovation of SOEs and their efforts to decouple R&D investment from net income, allowing such investment to continue even if net income falls.
Governments of BRICS countries should step up climate-related disclosures among SOEs and collect and share data on their innovation and greening efforts.
1. Introduction
State-owned enterprises (SOEs) are a major force in energy markets in BRICS countries, (Brazil, Russia, India, China, and South Africa), including in their national energy innovation systems. Thus, BRICS countries’ SOEs’ approach to the global energy transition is of rising importance in line with BRICS countries’ growing economic and geopolitical stature. BRICS countries represented 44.8 percent of the annual global CO2 emissions in 2020 (Global Carbon Project, Citation2021). In the coming years, BRICS countries and a few other large developing economies like Indonesia and Vietnam will replace industrialized economies as the world’s top emitting countries (Gallagher, Citation2022), increasing the urgency of their pivot to a low carbon economic development model.
Finding the right formula for BRICS countries to achieve a just energy transition that moves away from fossil fuel industries remains challenging. This is especially the case because BRICS countries are important global suppliers for oil and gas, accounting for 22 percent of global production (EIA, Citation2022). Their economies benefit not only from oil and gas export revenues collected by their oil and gas SOEs but also from high employment linked to their domestic oil and gas activity. As large employers in BRICS country economies, the strategies of oil and gas SOEs can have a large impact on implementation of a just transition, especially since they are entities that play a key role in technical training, education, and recruitment. Previous studies find that reliance on fossil fuels as a source of revenues and related rent-seeking by corporate vested interests can be a major deterrent for investment in renewable energies (Ahmadov & van der Borg, Citation2019; Fadly, Citation2019). Academic studies of industrial economies suggest that states must actively pursue renewable energy at the expense of these vested interests to make progress in national energy transformation (Moe, Citation2015).
To deeply decarbonize the global economy and reduce the threat of climate change, energy innovation will be a critical component (Myslikova & Gallagher, Citation2020). To achieve such innovation, more resources need to go to clean energy research and development (R&D) (IEA, Citation2020). The largest and often most powerful entities in energy markets in BRICS countries are state-owned enterprises (SOEs). Thus, the question of how BRICS countries’ governments instruct their oil and gas SOEs to address national climate commitments and pursue energy innovation could have large consequences for successful energy transition pathways and for these SOEs’ capacity to support a just transition for workers currently employed in fossil fuel related activity.
Early evidence is that several of these BRICS country SOEs are being asked by their governments to participate in clean energy development and innovation. That raises important questions about whether these SOEs can succeed in new energy venturing and whether they are the correct entities to foster change. This article contributes to the emerging literature on SOEs to assess their performance in BRICS countries’ national energy innovation, including green energy innovation.
Despite their important role in energy and climate policy implementation, previous literature does not provide empirical evidence about the green energy innovation success of SOEs in BRICS countries. In this research, we fill this gap in the literature by investigating whether some of the largest oil and gas SOEs in BRICS countries are shifting their innovation efforts away from fossil fuels and greening their innovation to foster low-carbon solutions. We analyze the clean energy innovation priorities of select SOE firms in BRICS countries from 2005 to 2020 and compare the scale of their activity in low-carbon alternatives with ongoing R&D investments in fossil fuel related technology development.
The rest of this article continues with a literature review (section 2), followed by section 3 on methods (description of case study selection, data collection and analytical methodologies used in this study). Section 4 then explains the results from the comparative analysis of the patent application data for the five BRICS SOEs and delves into the details of the individual BRICS countries’ SOE case studies. Section 5 discusses learnings from the study, ongoing knowledge gaps, and Section 6 concludes offering policy insights and recommendations.
2. Literature review
Climate policies surrounding oil and gas SOEs matter to governments because they are major emitters and are thus relevant to successful national decarbonization efforts (Clark & Benoit, Citation2022). Oil and gas SOEs rank prominently in the top 50 life-cycle carbon emission intensities of all publicly traded oil and gas producers, including 5 major oil and gas SOEs from BRICS countries (Dietz et al., Citation2021). That begs the question: Are these SOEs part of the problem or the solution?
The retrograde nature of some of the oil and gas SOEs in BRICS countries could be a barrier to green industrialization in these important economies. Aspirationally, greening the oil and gas SOEs’ innovation and moving them towards low carbon pathways could greatly improve global green technology trajectories and accelerate the energy transition more generally. It could also provide a mechanism for retraining workers and increasing green jobs in BRICS countries’ oil and gas producing regions and thereby facilitating a just transition away from reliance on fossil fuel jobs. Finally, SOEs themselves might be motivated to green their innovation and investment to lower the transition risks as fossil fuel assets and products will lose value over time (Semieniuk et al., Citation2022). Still, it holds some risks.
Oil and gas SOEs play a wide variety of roles within their national settings. Research finds that these entities often are a tool of wider economic policies, including industrial development and oil wealth redistribution within the country (Jaffe, Citation2007). Their industrial development and wealth redistribution role therefore makes them important institutions for addressing a just transition to low carbon energy in the societies where they operate. Oil and gas SOEs are often large employers in their national economies. This is especially true for these BRICS country SOEs, such as PetroChina and Gazprom, which each employ upwards of 400,000–500,000 employees, many of whom have technical training and expertise. To the extent that these firms do not pivot to investing in green energy but rather remain focused on oil and gas capital investment and hydrocarbon innovation (Green et al., Citation2021; Hartmann et al., Citation2022), their resistance to change will potentially limit opportunities to retool and retrain workers or to add new green jobs. Firms like Petrobras and PetroChina have been downsizing since the early 2010s when net income levels peaked. Only Gazprom has maintained its number of workers over the study period.Footnote1
Importantly, oil and gas SOEs often generate large revenues for the state and play a key role in their nation’s fuel supply system (Marcel, Citation2006). This latter role is a prominent one for the BRICS countries’ oil and gas SOEs and means that the firms could be well placed to lead in development and distribution of low carbon fuels. But in some cases, especially in the Middle East and Russia, SOEs might be tasked in the future with producing more oil if private sector investment in oil and gas wanes as the energy transition gains pace (Bordoff & O’Sullivan, Citation2022). Thus, it makes sense to consider whether this historical role could prevent them from adequately engaging in energy transition activities.
Research confirms that SOEs play an important role in the economies of BRICS countries and in their national innovation systems. Scholarly literature has suggested that the role of SOEs is not limited to serving the public and improving national welfare, but also in initiating innovation and accelerating technology diffusion (Tõnurist & Karo, Citation2016). For example, Russian oil and gas SOEs have improved technologies for oil extraction and processing (Tõnurist & Karo, Citation2016), and Petrobras of Brazil has led innovation in deep water drilling (Paz, Citation2015). SOEs tend to have better access to bank financing, which enables them to invest more in R&D (Bortolotti et al., Citation2019).
Hsu et al. (Citation2021) argue that state ownership, particularly in emerging market countries, promotes environmental engagement, and that SOEs tend to be more engaged in environmental issues than private sector players. Among a wider range of firms, they specifically observe this trend among state-controlled oil and gas firms. Roud and Thurner (Citation2017) showed that manufacturing firms in Russia under state ownership are prone to invest more in eco-innovations and increase resource efficiency. Prag et al. (Citation2018) argue that SOEs deserve particular attention due to their preferential treatment from governments and high political influence on policy formation that regulates their operations, including energy transition. They note that SOEs often have preferential access to financing and state-led financial guarantees and that this special status could give them a leg up on energy transition activities.
Generally speaking, R&D allocations in the oil industry as a percentage of revenues lag behind compared to other sectors, such as automobile or electronics. The BRICS SOEs are similarly circumspect in R&D spending when compared to their private sector counterparts such as Shell, BP, Chevron and ExxonMobil. Matkovskaya et al. (Citation2021) note that the high profitability of oil companies historically has not stimulated them to invest as much in R&D as those made by large companies in other industrial sectors since their generally high profitability bypasses the need for major innovations. However, as the energy transition proceeds and gains pace, oil and gas firms are coming under increased pressure to innovate in order to sustain profitability (Jaffe, Citation2020).
Overall, for state enterprises, there is room for caution. Developing local R&D innovation ecosystems entails fiscal risks, because the innovation process in energy technology is inherently risky and some failure is inevitable (Grubler et al., Citation2012; Grubler & Wilson, Citation2014). Still, like their private counterparts, many SOEs are exploring ways to expand their core business beyond oil and gas, partly at the urging of their home governments. They face unique challenges and opportunities that the large IOCs do not encounter because as national champions, they are directly responsible for securing domestic oil and gas requirements (Benoit, Citation2019). Yet, given this premier domestic fuel supply role, SOEs would be well positioned to replace those fossil fuel requirements with lower carbon energy, especially if government policies were similarly aligned. SOE strategies are often guided by public policy priorities including their home countries’ economic development strategy, making them a natural fit to participate in green industrialization programmes (Marcel, Citation2019). They also often have experience buying into foreign technologies and know-how on behalf of the state, including related workforce development and training (Prag et al., Citation2018). This role makes them important potential players in addressing technical workforce retraining that might be required to implement a just energy transition at home.
Scholarly research suggests that the time between R&D spending and successful patent generation can take a decade or more (Popp, Citation2016). This is a highly relevant observation for BRICS countries’ leaders because it means any R&D monies spent on oil drilling technologies today could be too late to make an appreciable difference in countries’ ability to shore up oil and gas production needed in the next decade or so. For 2040 and beyond, the outlook for oil demand and oil prices is more uncertain. This raises questions about whether oil and gas SOEs should continue to exert effort to create new oil exploitation-related technologies, even for countries that might want to produce oil and gas more indefinitely to replace potentially waning investments by private sector firms.
3. Methods: case selection and metrics
3.1. Case study selection
In the study, we selected majority-state-owned enterprises in the oil and gas sector in BRICS countries and compared them to other large international oil companies. For case selection, we chose the oil and gas SOE that is most closely associated with the country’s energy innovation policy. In the case of Russia and China, each of which has several SOEs in or related to the oil and gas sector, we considered multiple companies but selected Gazprom and PetroChina respectively. For Russia, we also considered Rosneft; while both Gazprom and Rosneft are national champions, we selected Gazprom because its accessible data and engagement on low carbon strategies goes back further in time and is more transparent than that of Rosneft. For China, we included PetroChina, which is China’s flagship national oil company and is most responsible for the country’s energy security.Footnote2
All five companies have above 50 percent of voting shares held by the government and are among the largest SOEs in the energy sector in each of the BRICS countries (see Figure SM.1 in Supplementary Materials). All five SOEs have invested in green energy production and innovation, though the scale and commitment differ. All of them also have a major role in their respective countries in contributing to domestic energy supply and providing revenues to the national budget.
3.2. Metrics/database
We conduct the analysis using an original dataset of selected metrics to evaluate the innovation effort of the SOEs. These metrics include R&D investments, patent applications, company information on financial health (revenue and profit), stock performance, and oil price.
Using an original data set, we set forth case studies on five state-owned national oil and gas companies from BRICS countries – Brazil’s Petrobras, Russia’s Gazprom, India’s ONGC, China’s PetroChina, and South Africa’s PetroSA. We compare them to large international oil companies like Shell and BP. In the case studies, we highlight differences in their approaches. We consider the level of government ownership, firms’ revenues and financial health, national government policy, and global oil prices as factors influencing BRICS countries’ SOE’s performance in clean energy innovation and study each firm’s success in registering patents in specifically targeted technologies.
We use patent applications as a proxy for their technology prioritization and effort on clean energy innovation because these companies do not consistently report their R&D spending or their share of investment in different categories of green technologies. This approach is consistent with established research by Johnstone et al. (Citation2010) or empirical studies reviewed by Popp et al. (Citation2010) and Popp (Citation2019). We compare patent applications for both conventional and clean technologies while being mindful that this is an imperfect measure of effort because the costs and length of time required to innovate for different categories of technology can differ greatly. Still, we believe that since patent applications are considered one key concrete measurement of the innovation effort, analysis of the number, nature and quality of these patent applications offers a glimpse into BRICS countries’ SOEs’ green innovation strategies and at least a partial indication of their level of effort and commitment. We supplement this metric with a case study approach. Analyzing patent applications allows us to observe each SOE’s prioritized areas of technology development relative to their role in their home countries’ energy transition. We triangulate patent applications with publicly announced energy transition strategies of each of the firms.
Our data and analysis cover the period 2005–2020. Data on R&D investments are from various annual reports of all companies including information about their R&D expenditures, innovation efforts and greening strategies, and where available, their Form 20-F.Footnote3 We used the Bloomberg Terminal to collect data on monthly share prices and financial performance. We used consolidated financial statements of the companies.Footnote4 We used data from the Federal Reserve Bank of St. Louis for the Brent oil prices.
We also gathered government documents in each of the BRICS countries that establish strategies towards a net zero transition. Lastly, we reviewed newspaper and specialized media articles to understand the evolution of strategies for each of the companies. Unless otherwise stated, we report all values in constant 2015 USD dollars.
Because these SOE companies do not consistently report data on their R&D spending and the proportion of the total they invest in the different green technological categories, in addition to innovation information from the companies’ reports, we look at their patent application activities and indications of their patenting effort to evaluate their transition to green energy. For the patent analysis, we used the Patsnap platform.Footnote5 We followed the International Patent Classification (IPC) green inventory codes adopted, for example, by the European Patent Office (EPO) and the World Intellectual Property Organization (WIPO) to identify patent applications in sustainable technologies.Footnote6 We searched within the subcategories of all the main categories that include energy-related sustainable technologies (e.g. the ‘alternative energy production’ category includes biofuels, fuel cells, clean energy technologies etc.). We matched the primary IPC code of all patents of these companies with the codes associated with the category and subcategory in the green inventory. We excluded applications that have been rejected and withdrawn. We collected the number of patent applications for each company and its subsidiaries. We also included the number of citations to evaluate the quality of the patents.
Our analysis is limited by the availability of data disclosed by the SOEs studied. Private companies rarely publish detailed data on their innovation activities, considering that the information proprietary. The SOEs included in this study only publish aggregated data on their total R&D investment. We found a more detailed disaggregation of the investments only for some years for Petrobras. PetroSA publishes only limited data.
We detrended time series data to compare correlations between the variations of net income and R&D investment over time. Details of the methodology are included in Supplementary Material.
4. Results
4.1. Comparative analysis of R&D expenditures, patents, and financial performance
Historically, public investments in energy R&D as a percentage of gross domestic product (GDP) in industrialized countries have for the most part been below 0.03 percent (Gallagher & Anadon, Citation2020; Hanna & Victor, Citation2021; Zhang et al., Citation2021). Chinese government spending on energy R&D has been increasing since 2004 but has never surpassed 0.02 percent of GDP.
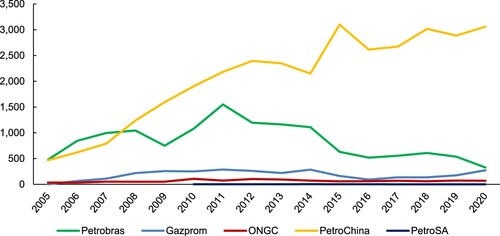
Of the five SOEs studied here, only PetroChina exhibited a consistent increase in overall R&D investment. Petrobras, burdened with corruption scandals and financial constraints, has reduced overall R&D spending over the period. In the past few years, Gazprom’s R&D expenditure has trended up (See ).
Figure 1. SOEs’ R&D expenditures (Unit: USD millions with GDP deflator).
We find that ultimately, all five SOEs seem to demonstrate only modest efforts in greening their innovation, potentially limiting opportunities to retool and retrain workers or to add new green jobs. These BRICS SOEs significantly lag several of the world’s largest international oil companies (IOCs) in terms of total annual patent applications and number of green patent applications.
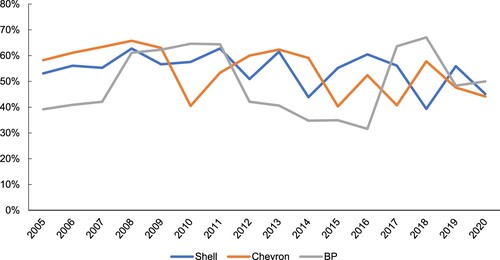
For SOEs’ R&D investment as a percentage of their revenues, our analysis shows that PetroChina, Petrobras, and ONGC have maintained higher levels of R&D intensity (above 0.4 percent) – their total R&D expenditures as a share of their revenues – compared to Gazprom and PetroSA (below 0.4 percent) (See ). This compares to the 0.15–0.5 percent R&D investment by four of the world’s largest international oil companies (IOCs: ExxonMobil, BP, Shell, and Chevron). In recent years, the IOCs posted a consistently higher proportion of patent applications classified as green even with lower company gross R&D investment expenditure than that of PetroChina. Shell, for example, generated a much higher share of green patents than Petrobras and PetroChina (See ).
Figure 2. R&D intensity (%, R&D expenditures as a percentage of the company’s revenues) and the price of crude (in USD).
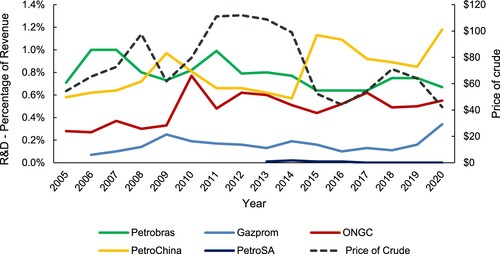
Figure 3. Share of green patents in total patent applications for Shell, Chevron, and BP.
Data show that the firms continue to invest most heavily in oil and gas innovation and have stayed hydrocarbon focused, in line with increased responsibilities for oil and gas production. This finding highlights the inherent conflict between new energy transition imperatives and responsibilities to increase oil and gas production. With respect to innovation activity, the SOEs have applied for patents in the same dominant categories over the last decade with a few exceptions. None of the companies consistently increased the proportion of green patents compared to total patents over the examined time period of 2005–2020 (See ). The three largest patent application categories include rock drilling technologies, general chemical processes, and measuring and testing, reflecting the political pressure on the firms to increase oil production in line with articulated national energy security goals.
Figure 4. Proportion of green to total patent applications (%). Note: PetroSA is not included in the figure, because it only applied for green patents (2) in 2005, and its last patenting activity (in the non-green patents) was in 2012.
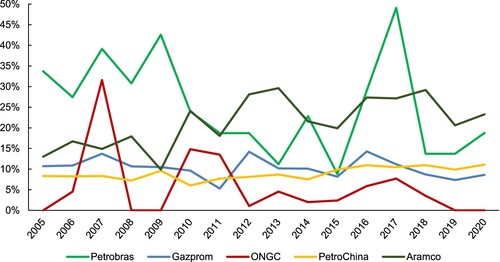
Comparatively, PetroChina’s proportion of green to total patent applications is lower than Petrobras, which has a longer history of green energy R&D. Still, PetroChina’s consistent spending has helped it to steadily increase the absolute number of green applications and quadrupled them in the past decade – from 65 in 2011 to 253 in 2020. By comparison, Saudi Aramco, the world’s largest oil and gas SOE which also has a long history of R&D investment, increased the number of green applications from 374 in 2011 up to almost 1,500 in 2018, with an annual average close to 1,000 between 2011 and 2020.
In comparative volumetric terms, the scale of the citations for green patents for PetroChina is on average more than three times higher than for Gazprom, reflecting perhaps the higher priority placed on green innovation by China’s government. We identify the highest-valued technological categories for each company by the number of patent citations. Gazprom and PetroChina both have highly cited patents in pollution control, confirming corporate goals to remediate environmental damage. By comparison ONGC and PetroSA have not produced highly cited patents in any of the green categories. For Petrobras, green patents dropped significantly after 2009, before which the firm was very active in patenting green technologies with a focus on biofuels innovation.
Our findings reveal that fluctuations in oil prices and overall net income have negatively affected consistency for energy R&D efforts in the BRICS SOEs, with the exception of PetroChina whose outsized role in China’s energy security appears to have outweighed financial considerations. Generally speaking, we observe that BRICS countries’ SOEs rely heavily on oil revenues to finance innovation. Specifically, for Petrobras and Gazprom, the R&D investment is correlated with net income from previous one or two years of activity. For ONGC, we observe a correlation in the same year, and for PetroChina, we do not observe a statistically significant correlation (See Supplementary Materials). Any correlation between R&D investment and net income is not yet clear for PetroSA due to the relatively short series of available data.
In the next sub-section, we focus on each of the BRICS SOEs in more depth: their national context, R&D activity and the factors that influence it, and prospects going forward.
4.2. Greening efforts in oil and gas among BRICS countries: case studies
4.2.1. Petrobras
Petroleo Brasileiro (Petrobras) is a semi-public Brazilian multinational oil and gas company, with a dominant position in Brazil. The government owns a 50.5 percent stake in the company, which trades as an ADR on various stock exchanges. Petrobras’ output constitutes 75 percent of Brazil’s oil production. Its current total production of 2.7 million b/d, including production abroad, is theoretically large enough to meet most of the country’s oil use. The oil and gas industry has been an important contributor to Brazil’s GDP for many years and represents 10 percent of the total economy in 2020 (National Agency of Petroleum, Natural Gas and Biofuels, Citation2021).
Petrobras’ net income has fluctuated with oil prices in recent years. Its R&D spending is volatile, going up and down with its corporate income. Data shows that there is positive correlation between net income and R&D investment (See Figure SM.2 in Supplementary Materials). The company has a long history of energy innovation, starting with a government policy driven programme on biofuels in the 1970s but also including dramatic achievements in deep water drilling. Petrobras’ research center (CENPES) is one of the largest research facilities in the energy sector globally. After a sustained government-backed effort to innovate and produce patents in biofuels (See Figure SM.3 in Supplementary Materials), the company exited its production activities of biodiesel and ethanol in 2017 as part of an effort to reduce corporate debt (Petrobras’ Form 20-F 2016 ).
For the most part, Petrobras R&D spending has been dedicated mainly to exploration and deep-water operations (Paz, Citation2015). This is aimed to help Petrobras unlock the challenging pre-salt formations offshore in Brazil’s territorial waters which hold great promise for increasing Brazil’s oil and gas output, a national government priority. The company has been spending between 0.67 percent-1 percent of their total sales revenues on R&D since 2005.
Petrobras has actively invested in renewables, aligning with Brazil’s climate policies, which include incentives for the uptake of renewable energy. But the company’s commitment to greening R&D spending has not been robust over the years. In 2020, the company invested only US$9.7 millionFootnote7 in R&D for decarbonization and renewables, only 3 percent of its overall R&D budget of US$355 million. In its latest climate strategy report, the company stated that R&D in low-carbon solutions will receive a minimum of 10 percent of its R&D investment until 2025. But between 2013 and 2020, combined investment into biofuels, renewables, hybrid electric vehicles, and the ‘other’ category only total 7 percent of the firm’s R&D allocations (Petrobras Form 20-F, Citation2020).
Despite the emphasis on oil and gas R&D, based on our patent analysis, on average about one fourth of the patent applications filed by Petrobras are in green technologies throughout 2005–2020 (See Figure SM.4 in Supplementary Materials). But while 80 percent of these green patents were in biofuels in 2009, that proportion fell to only 40 percent by 2021; meanwhile patent applications in carbon capture, use and sequestration (CCUS) increased.
4.2.2. Gazprom
Gazprom, one of Russia’s largest state-owned oil and gas enterprises and ranked among the top ten oil and gas companies in the world, controls 71 percent of Russian gas reserves and accounts for 68 percent of Russia’s natural gas production (Gazprom, Citation2022). The company is also an oil producer. It supplies close to half Russia’s internal natural gas use. Now impacted by war and sanctions, Gazprom has historically been the country’s largest natural gas exporter and was preparing to move into hydrogen. Russia’s military action in Ukraine has clouded Gazprom’s future role as an energy exporter to Europe (Griffin & Dmitrieva, Citation2022).
Unlike its larger peer Rosneft, which only embraced sustainability-linked activity last year, Gazprom has ventured into clean energy for many years. Historically, Gazprom has been used as a policy instrument for the Russian government in key strategic technology areas (Gershman & Thurner, Citation2016; Roud & Thurner, Citation2017). Prior to Russia’s conflict with Ukraine, Russia had begun to accelerate its decarbonization strategies in response to Europe’s plans for a carbon border tax. Specifically, Gazprom targeted R&D spending on hydrogen and clean energy technologies several years before the Russian government pledged in 2021 to reach a net zero target by 2060.
Between 2005 and 2019, Gazprom’s expenditures in R&D fluctuated significantly in line with net income fluctuations related to changing global market conditions (See Figure SM.5 in Supplementary Materials). Its patent applications activity appears to have been affected by swings in R&D spending levels (See Figure SM.6 in Supplementary Materials).
A majority of Gazprom’s R&D ‘green’ dollars starting in the 1990s focused on air quality management and pollution control technologies. By the 2010s, Gazprom began investing in carbon capture and storage technologies (CCS), with about a third of all green patents filed in 2016 falling into this category. Data suggests that the company has not yet filed for many patents related to hydrogen technology, with only two hydrogen specific patents confirmed, one in 2009 and one in 2019. Overall, while disaggregated data of Gazprom’s R&D investment is not available, the company records indicate a high percentage of Gazprom’s R&D spending remains focused on oil and gas related activity, including most recently digital strategies for oil and gas production and operations.
4.2.3. ONGC
ONGC is India’s largest domestic oil and gas producer and main oil and gas SOE, with government ownership of 60.41 percent as of 2020 (ONGC, Citation2021). Following acquisition of a controlling stake in Hindustan Petroleum Corporation Ltd. combined with volatile oil prices, the company’s decline in cash reserves has forced it to cut spending in recent years. ONGC crude oil production meets only about half of the country’s oil use.
India is the world’s third-largest energy consuming country, thanks to rising incomes and improving standards of living. Its energy demand is expected to increase further in the coming decades. As a result of rising demand for oil and gas, the Indian government has pressed ONGC to reverse the decline in its hydrocarbon output from depleting fields. In 2019, ONGC issued an Energy Strategy 2040 to define a long-term vision and growth plan for its energy transition. ONGC aims to double the output of hydrocarbons and triple its refining capacity by 2040.
Late last year, the Indian government declared its aim to achieve net-zero carbon emissions by the year 2070, including ambitious targets from renewable energy. Aligned with India’s climate policy, ONGC plans to make significant investments in renewable energy to increase its energy generation portfolio to 5–10 GWs generated from renewable sources (mainly offshore wind power), up from 178MW of renewable energy capacity in 2020. ONGC also has plans to set up a long-term venture fund corpus worth US$1 billion to fund research in niche areas like clean energy, artificial intelligence, and reservoir/field services technology. ONGC currently does not have a carbon neutrality target.
In line with government policy and pressure to both increase oil production and lower its greenhouse gas emissions, ONGC has increased its R&D spending in the 2010s compared with the 2000s.Footnote8 Since 2010, ONGC’s R&D spending has fluctuated generally in line with changes in its net income (See Figure SM.7 in Supplementary Materials). In 2020, ONGC spent almost US$70 million on R&D, almost twice that of 2005. The R&D spending represented 0.55 percent of its annual revenue in 2020, a big jump from 0.28 percent in 2005. Data is not published for the proportion of R&D that targets green technology but the negligible number of green patents being filed for green technologies compared to the number of patents in other categories indicates that low-carbon R&D is likely less prioritized (See Figure SM.8 in Supplementary Materials).
ONGC has only accumulated 57 green patents since 1960. Meanwhile, data reveals that patent applications by ONGC fluctuates greatly alongside changes in funds spent. Efforts in green energy are not underpinned by any concrete policies in India to require emission reduction in the oil and gas sector. Most of ONGC’s green patents focused on administrative aspects, waste management, and air pollution, with only a few directly targeting green energy innovation. ONGC has a major competitor in green energy as private oil refining firm Reliance Energy this year announced an $80.6 billion plan to invest in renewable energy in India.
4.2.4. Petrochina
China National Petroleum Corporation (CNPC) is China’s largest oil and gas producing company and secures oil and natural gas for China, both via its domestic production and through foreign oil and gas exploration and investment. PetroChina, the flagship subsidiary of CNPC, is a joint stock limited company which has a limited percentage of shares traded on the major international stock exchanges. CNPC owns 80.41 percent of PetroChina. CNPC is included in the group of 50 core SOEs ranked as vital to China’s economic development and national security (Downs, Citation2021).
CNPC in 2020 produced 1.6 million b/d of oil and 29.8 billion cubic metres of natural gas outside of China, of which PetroChina was responsible for 465,000 b/d and 4.4 bcm, respectively. PetroChina’s oil production accounted for 17.7 percent of China’s oil consumption in 2020.
PetroChina first developed a greenhouse gas emissions trading team in 2010. In 2018, it inaugurated its first CCUS project for enhanced oil recovery. PetroChina will own 29 percent in a new $1.5 billion clean energy investment vehicle, CNPC Kulun Capital, set up by CNPC for green and low-carbon development.
In September 2020, China made a historic announcement to achieve a peak in CO2 emissions by 2030 and net zero emissions by 2060. In June 2022, PetroChina officially released its ‘Green and Low-Carbon Development Action Plan 3.0’, which identifies natural gas, hydrogen and CCUS industrial chains as three key pathways it will pursue to achieve green transformation.
Like Petrobras, PetroChina has an established innovation ecosystem, including 84 research institutions and departments. PetroChina also has 21 national R&D institutions and 54 Group-level key laboratories and experiment bases.
While PetroChina’s R&D investment has fluctuated, in the past five years, the company has maintained investment close to US$3 billion, even as its profitability and net income decreased over the same time period (See Figure SM.9 in Supplementary Materials). After detrending the data, there is no clear correlation between R&D investment and net income. PetroChina does not disclose how much of this R&D spending went to green innovation. Patent data indicates a focus on rock drilling and mining in line with parent CNPC’s attempts to boost oil and gas production from onshore shale resources.
Green patents represent a very small proportion of PetroChina’s overall total patents but have seen a steady increase (See Figure SM.10 in Supplementary Material). PetroChina applied for more than 100 green patents every year since 2013. In 2020, these patents include 72 in waste management, 22 in energy conservation, and 68 in alternative energy production.
4.2.5. PetroSA
The Petroleum, Oil and Gas Corporation of South Africa, PetroSA, is the national oil company of South Africa, formed in 2002 by merging three existing entities, including state exploration firm Soekor, which led the country’s offshore oil production. Besides oil and gas production, PetroSA is involved in the production of synthetic fuels from offshore gas at South Africa’s major Gas-to-Liquid (GTL) refinery (PetroSA, Citation2020). PetroSA is wholly government owned and does not trade on any stock exchanges.
PetroSA has struggled financially in recent years and generated negative profits since 2013. This has limited R&D expenditures (See Figure SM.11 in Supplementary Materials). In addition, it has been burdened with corruption scandals. PetroSA’s limited oil and gas production is mostly used as feedstock for its GTL refinery. PetroSA’s hopes to increase offshore gas reserves has not materialized. South Africa imports 90 percent of the crude oil consumed domestically.
In 2020, the company reported that it will be merged with two other entities (the Strategic Fuel Fund and iGas) to form a new national oil company (Oberholzer, Citation2020). Latest news suggest PetroSA’s GTL refinery might be repurposed to produce carbon-neutral aviation fuel (Creamer, Citation2021), aligned with South Africa’s newly announced commitment to a 2050 net zero target.
The company has invested in energy R&D since 2010, but the investment has been marginal compared to other countries and fell from US$2 million in 2010 to US$0.3 million a year since 2017. The company hasn’t reported any patents since 2013. (See Figure SM.12 in Supplementary Materials).
5. Discussion
We find that patent achievements in green technologies for the SOEs in BRICS countries have remained very limited over the study period from 2005 to 2020. On average, these companies have applied for about 41 green patents (10 percent of total applications) a year over the past decade. Nevertheless, there is a great variation in the proportion of green patents to total patents among the companies. For Petrobras, this proportion has been on average 20 percent between 2005 and 2020, which is higher than of the rest of the SOEs. This suggests that the maturity of the firms’ innovation systems may be material to successful innovation in green technology. In contrast to these five SOEs, 40–60 percent of patent applications by the IOCs can be categorized as green, higher than any of the five SOEs studied (). Priorities for green R&D plans of the five SOEs studied differ. For Gazprom and PetroChina, hydrogen now plays an important role. Up until recently, biofuels has been a major focus for Petrobras.
The paucity of green patents also suggests that a major pivot to green energy innovation for SOEs in BRICS countries has not yet taken place. One reason might be that the current political economy is set up to favour the SOEs staying with fossil fuels (Moe, Citation2015). Government policy priorities are only now beginning to shift towards clean energy innovation but still heavily emphasize the central role of SOEs to continue producing oil and gas to increase revenues or to ensure the security of (traditional fossil) energy supply. Since these oil and gas SOEs still have a primary responsibility to ensure that no shortages of oil and gas occurs for the nation, it is possible that there is not a clear enough policy signal to pivot them significantly towards clean energy. This role has become all the more critical amid spiking oil and gas prices following Russia’s invasion of Ukraine and related economic sanctions against Moscow.
This reality creates a conundrum for the firms and their governments. To promote continued oil and gas production in mature basins is expensive, and the SOEs must innovate in drilling methods and technologies to be competitive. Further, these firms rely on net income from that oil and gas production for dollars for innovation activity. But at some point, as the clean energy transition gains pace, oil and gas income will likely fall, constraining funding for energy innovation. This means it will be harder for these firms to pivot to green R&D and to enable future innovation in green energy, even as they should be hedging overreliance on oil for future revenues and working to lower carbon intensity of operations.
In the case of ONGC, PetroChina, and Petrobras, the firms face relatively high-cost, difficult local geologic conditions for oil and gas production. Continued R&D is needed to exploit remaining domestic oil and gas reserves but long lead times for innovation combine with national decarbonization priorities; these changes in the policy landscape could easily strand payback for drilling related investment (Jaffe, Citation2020).
Our observation of the correlation between net income and R&D investment flags a challenge that has not been addressed in most cases. Only PetroChina appears to have strategically decoupled R&D expenditure from net income. The State Council mandated in 2016 that R&D investment in the petrochemical industry shall account for no less than 1.2% of the industry’s main business income (Guiding Opinions, Citation2016). This pro-innovation strategy allows the company to stay its course in pursuing energy innovation even when net income drops.
The academic literature on SOEs indicates that stronger government ownership is more apt to align corporate SOE behaviour with government policies (Lewis, Citation2007). But recently, governments’ pivoting towards net zero emission goals and more ambitious targets for renewable energy has yet to correct the structural bias of the SOEs’ to prioritize investment in R&D for drilling technology in BRICS countries. The five firms are still spending billions of dollars on drilling R&D, instead of shifting spending to activities needed to ensure new clean energy technologies are available by 2040.
6. Conclusions and policy implications
Developing successful innovation ecosystems within a firm takes time and effort. This is especially true for state-owned firms. BRICS countries’ SOEs still lag behind private enterprises whose clean energy innovation culture goes back decades, such as companies like Shell and BP. Our study tellingly found that Petrobras, with its longer history of R&D, had the highest proportion of the green patent applications to total patent applications among the SOEs studied.
Our analysis shows that overall, these important energy SOEs remain focused on their innovation efforts in oil and gas drilling. The pathway for these state-controlled companies to achieve sufficient revenues from new green energy businesses to support green energy R&D in the pursue of meeting ambitious national and global climate goals remains unclear. Ultimately, the five SOEs’ limited effort at greening their innovation potentially limits opportunities to retool and train their highly technical workforce and thereby constrains government efforts to apply a just transition. The firms’ heavy reliance on oil revenues to finance innovation means that governments need to reevaluate how to incentivize their SOEs to pursue green energy innovation more decisively.
It is hard to imagine a just clean energy transition on the part of these SOEs if their respective governments do not disincentivize fossil fuels production through national strategies to decrease dependence on fossil fuels for government revenues and national energy use. That might suggest that governments must create conditions where prices and profits reflect more accurately the true social cost of carbon. Nevertheless, there is no universal answer as to what the pathway to decarbonization will be for each SOE. The governments clearly need to tackle the barriers posed by the political economy of the oil and gas industry to break the vested interests of the companies in fossil fuels including diversification of government revenue streams and incentivizing investment in new climate economy alternatives, including transitioning production processes and workforces. A shifting of R&D spending away from oil and gas drilling to green energy would be a good starting point.
Experiences from other sectors like the automotive industry show that strong government financial support and incentives to innovate, such as those offered in the United States and Japan, can lead to successful outcomes. In Japan’s case, automobile companies received a combination of direct government funding for R&D, product subsidies, and tax breaks, for example. BRICS countries will have to consider whether similar policy levers could ease the difficulties of greening their flagship oil and gas SOEs. National governments could also regulate a minimum level of green R&D spending for their oil and gas SOEs, irrespective of net income trends, mirroring PetroChina’s consistent financial commitment to innovation. Brazil has such a requirement for R&D spending built into tenders for oil and gas exploration acreage. In its early years as an oil producer, Norway successfully required oil exploration companies to share technology transfer and training to local workers (Richard & Stenvoll, Citation2007). Such efforts should be considered by BRICS countries’ governments to ensure that their oil and gas SOEs are greening their innovation to promote just transition. Petrobras, for example, has devised its annual sustainability strategy to accelerate the decarbonization and contribute to the Paris Agreement by outlining its detailed commitments for 2025 and 2030 (Petrobras Sustainability Report, Citation2021 ).
Further study is needed on whether SOEs are the proper institutions for advancing clean energy innovation and what precise strategies would strengthen SOEs’ energy innovation systems to buttress their role in worker retraining and green upskilling. Currently, SOEs’ R&D data is not sufficiently granular to fashion readily accessible answers to these important questions. We recommend that BRICS countries’ governments and other oil producing states collect and share such data to facilitate scholarly research in this important area of inquiry that would benefit government climate policy evaluation and action. The governments can forge other types of collaborations among these SOEs and as public-private collaboratives and partnerships via energy innovation focused initiatives such as Mission Innovation (Myslikova et al., Citation2022).
Supplemental Material
Download MS Word (145.2 KB)Disclosure statement
No potential conflict of interest was reported by the author(s).
Additional information
Funding
Notes
1 Most recently some of Gazprom’s workforce are being called to military service amid sharp cuts in the firm’s operations as an outcome of Russia’s ongoing conflict with Europe over the invasion of Ukraine.
2 Sinopec is a more diversified company and has many businesses including chemicals and fertilizer. While Sinochem does do oil and gas exploration, it is primarily a chemicals firm.
3 Form 20-F is an annual report filing for non-U.S> and non-Canadian companies that have securities trading in the U.S.
4 Financial data following generally accepted accounting principles – GAAP.
5 Patznap database includes patent data from 126 jurisdictions, including national patent authorities of the six companies in our study.
6 These categories include: alternative energy production, transportation, energy conservation, and waste management, agriculture and forestry, administrative, regulatory or design aspects, and nuclear power generation.
7 Including US$ 5.53 million in research and development in the advanced biofuels segment and US$4.17 million in renewable energy with a focus on wind, solar and BioQav (Petrobras Sustainability Report 2020). Reported in nominal value.
8 ONGC has been profitable since 2005. It made 112,464 mln RS profits in 2020 according to its annual report.
References
- Ahmadov, A. K., & van der Borg, C. (2019). Do natural resources impede renewable energy production in the EU? A mixed-methods analysis. Energy Policy, 126, 361–369. https://doi.org/10.1016/j.enpol.2018.11.044
- Benoit, P. (2019). Engaging state-owned enterprises in climate action. Center on Global Energy Policy. Columbia University. https://www.energypolicy.columbia.edu/research/report/engaging-state-owned-enterprises-climate-action
- Bordoff, J., & O’Sullivan, M. L. (2022, June 8). Green upheaval. Foreign Affairs. https://www.foreignaffairs.com/articles/world/2021-11-30/geopolitics-energy-green-upheaval
- Bortolotti, B., Fotak, V., & Wolfe, B.. (2019). Innovation and state owned enterprises. BAFFI CAREFIN Centre Research Paper, (2018-72).–. https://doi.org/10.2139/ssrn.3150280
- Clark, A., & Benoit, P. (2022). Greenhouse gas emissions from state-owned enterprises: a preliminary inventory (Center on Global Energy Policy Working Paper, pp. 1–38). Columbia University. https://www.energypolicy.columbia.edu/research/report/greenhouse-gas-emissions-state-owned-enterprises-preliminary-inventory
- Creamer, T. (2021, February). Green hydrogen and powerfuels could revive ailing PetroSA, unlock green steel and create €160bn export platform. Creamer Media’s Engineering News. https://www.engineeringnews.co.za/article/green-hydrogen-and-powerfuels-could-revive-ailing-petrosa-unlock-green-steel-2021-02-09
- Dietz, S., Gardiner, D., Jahn, V., & Noels, J. (2021). How ambitious are oil and gas companies’ climate goals? Science, 374(6566), 405–408. https://doi.org/10.1126/science.abh0687
- Downs, E. (2021). Green Giants? China’s National Oil Companies Prepare for the Energy Transition (Center on Global Energy Policy Working Paper, pp. 1–84). Columbia University. https://www.energypolicy.columbia.edu/research/report/green-giants-china-s-national-oil-companies-prepare-energy-transition
- EIA. (2022). International data: Annual petroleum and other liquids production & annual dry natural gas production. U.S. Energy Information Administration. https://www.eia.gov/international/data/world
- Fadly, D. (2019). Low-carbon transition: Private sector investment in renewable energy projects in developing countries. World Development, 122, 552–569. https://doi.org/10.1016/j.worlddev.2019.06.015
- Gallagher, K. S. (2022). The coming carbon Tsunami. Foreign Affairs, 101, 151–164. https://www.foreignaffairs.com/articles/world/2021-12-14/coming-carbon-tsunami
- Gallagher, K. S., & Anadon, L. D. (2020). DOE budget authority for energy research, development, and demonstration database. Fletcher School of Law and Diplomacy, Tufts University; Department of Land Economy, Center for Environment, Energy and Natural Resource Governance (C-EENRG), University of Cambridge; and Belfer Center for Science and International Affairs, Harvard Kennedy School.
- Gazprom. (2022). About Gazprom. https://www.gazprom.com/about/
- Gershman, M., & Thurner, T. (2016). New development: State-owned enterprises as powerhouses for innovation—the Russian case. Public Money & Management, 36(4), 297–302. https://doi.org/10.1080/09540962.2016.1162996
- Global Carbon Project. (2021). Supplemental data of Global Carbon Project 2021 (1.0) [MS Excel]. Global Carbon Project. https://doi.org/10.18160/GCP-2021
- Green, J., Hadden, J., Hale, T., & Mahdavi, P. (2021). Transition, hedge, or resist? Understanding political and economic behavior toward decarbonization in the oil and gas industry. Review of International Political Economy, 1–28. https://doi.org/10.1080/09692290.2021.1946708
- Griffin, R., & Dmitrieva, A. (2022, January 21). Insight from Moscow: Russia aiming to take major role in global hydrogen markets. S&P Global Platts. https://www.spglobal.com/platts/en/market-insights/blogs/natural-gas/012022-russia-hydrogen-gas-reserves
- Grubler, A., Aguayo, F., Gallagher, K., Hekkert, M., Jiang, K., Mytelka, L., Neij, L., Nemet, G., Wilson, C., Andersen, P. D., Clarke, L., Anadon, L. D., Fuss, S., Jakob, M., Kammen, D., Kempener, R., Kimura, O., Kiss, B., O’Rourke, A., … Srivastava, L. (2012). Policies for the Energy Technology Innovation System (ETIS). In T. B. Johansson, N. Nakicenovic, A. Patwardhan, & L. Gomez-Echeverri (Eds.), Global energy assessment (GEA) (pp. 1665–1744). Cambridge University Press. https://doi.org/10.1017/CBO9780511793677.030
- Grubler, A., & Wilson, C. (2014). Chapter 25: Policies for energy technology innovation. In A. Grubler & C. Wilson (Eds.), Energy technology innovation: Learning from historical successes and failures (pp. 1665–1744). Cambridge University Press. https://doi.org/10.1017/CBO9780511793677.030
- Guiding Opinions of the General Office of the State Council on Adjusting Structure, Promoting Transformation and Improving Effectiveness of the Petrochemical Industry. (2016). General Office of the State Council. http://lawinfochina.com/display.aspx?id=26034&lib=law
- Hanna, R., & Victor, D. G. (2021). Marking the decarbonization revolutions. Nature Energy, 6(6), 568–571. https://doi.org/10.1038/s41560-021-00854-1
- Hartmann, J., Inkpen, A., & Ramaswamy, K. (2022). The oil and gas industry: Finding the right stance in the energy transition sweepstakes. Journal of Business Strategy, 43(1), 17–27. https://doi.org/10.1108/JBS-07-2020-0156
- Hsu, P. H., Liang, H., & Matos, P. (2021). Leviathan Inc. And Corporate Environmental Engagement. Finance Working Paper 256/2017, 1–84.
- IEA. (2020). Clean energy innovation (p. 147). IEA. https://www.iea.org/reports/clean-energy-innovation
- Jaffe, A. M. (2007). The changing role of national oil companies in international energy markets (Baker Institute Policy Report, No. 35). https://www.bakerinstitute.org/research/baker-institute-policy-report-35-the-changing-role-of-national-oil-companies-in-international-energy
- Jaffe, A. M. (2020). Stranded assets and sovereign states. National Institute Economic Review, 251, R25–R36. https://doi.org/10.1017/nie.2020.4
- Johnstone, H., Haščič, I., & Popp, D. (2010). Renewable energy policies and technological innovation: Evidence based on patent counts. Environmental and Resource Economics, 45(1), 133–155. https://doi.org/10.1007/s10640-009-9309-1
- Lewis, S. W. (2007). Chinese NOCs and world energy markets: CNPC, Sinopec, and CNOOC (pp. 1–79). Rice University.
- Marcel, V. (2006). Oil titans: National oil companies in the Middle East. Brookings Institution Press.
- Marcel, V. (2019). National oil companies of the future. Annales Des Mines - Responsabilité et Environnement, N° 95(3), 133. https://doi.org/10.3917/re1.095.0133
- Matkovskaya, Y., Vechkinzova, E., Petrenko, Y., & Steblyakova, L. (2021). Problems of innovative development of oil companies: Actual state, forecast and directions for overcoming the prolonged innovation pause. Energies, 14(4), 837. https://doi.org/10.3390/en14040837
- Moe, E. (2015). Renewable energy transformation or Fossil fuel backlash: Vested interests in the political economy. Imprint: Palgrave Macmillan.
- Myslikova, Z., & Gallagher, K. S. (2020). Mission innovation is mission critical. Nature Energy, 5(10), 732–734. https://doi.org/10.1038/s41560-020-00694-5
- Myslikova, Z., Jaffe, A., & Gallagher, K. S. (2022). Shielding and expanding mission innovation. Nature Energy, 7(9), 779–781. https://doi.org/10.1038/s41560-022-01115-5
- National Agency of Petroleum, Natural Gas and Biofuels. (2021). O mercado de O&G no Brasil (pp. 1–31) [Aula Inaugural – MBA em Gestão de O&G].
- Oberholzer, L. (2020, September). Oil and gas regulation in South Africa: Overview. Thomas Reuters Practical Law. https://uk.practicallaw.thomsonreuters.com/w-010-7341?transitionType=Default&contextData=(sc.Default)&firstPage=true
- ONGC. Form 20-F 2005, 2006, 2007, 2008, 2009, 2010, 2011, 2012, 2013, 2014, 2015, 2016, 2017, 2018, 2019, 2020.
- ONGC. (2021). ONGC annual report 2020-21. Oil and Natural Gas Corporation Ltd. https://www.ongcindia.com/annual_report/ongc_ar_2020_21.html
- Paz, M. J. (2015). Institutional change and state-owned enterprises: Reflections from the Petrobras case study. Public Management Review, 17(6), 791–811. https://doi.org/10.1080/14719037.2013.822534
- Petrobras. (2020). Climate change supplement. https://issuu.com/estantepetrobras/docs/petrobras_caderno_clima_ingles
- Petrobras. (2021). Petrobras Sustainability Report 2005, 2006, 2007, 2008, 2009, 2010, 2011, 2012, 2013, 2014, 2015, 2016, 2017, 2018, 2019, 2020, 2021.
- PetroSA. (2020). PetroSA Integrated Annual Report 2020.
- Popp, D. (2016). Economic analysis of scientific publications and implications for energy research and development. Nature Energy, 1(4), 1–8. https://doi.org/10.1038/nenergy.2016.20
- Popp, D. (2019). Environmental policy and innovation: A decade of research (SSRN Scholarly Paper No. 3352908). https://doi.org/10.2139/ssrn.3352908
- Popp, D., Newell, R. G., & Jaffe, A. B. (2010). Energy, the environment, and technological change. Handbook of the Economics of Innovation, 2, 873–937. https://doi.org/10.1016/S0169-7218(10)02005-8
- Prag, A., Röttgers, D., & Scherrer, I.. (2018). State-owned enterprises and the low-carbon transition. In OECD environment working papers, no. 129 (pp. 1–57). OECD Publishing. https://doi.org/10.1787/06ff826b-en
- Richard, G., & Stenvoll, T. (2007). Statoil: A study in political entrepreneurship (pp. 1–58) [The changing role of national oil companies in international energy markets]. Rice University.
- Roud, V., & Thurner, T. W. (2017). The influence of state-ownership on eco-innovations in Russian manufacturing firms. Journal of Industrial Ecology, 22(5), 1213–1227. https://doi.org/10.1111/jiec.12643
- Semieniuk, G., Holden, P. B., Mercure, J.-F., Salas, P., Pollitt, H., Jobson, K., Vercoulen, P., Chewpreecha, U., Edwards, N. R., & Viñuales, J. E. (2022). Stranded fossil-fuel assets translate to major losses for investors in advanced economies. Nature Climate Change, 12(6), 532–538. https://doi.org/10.1038/s41558-022-01356-y
- Tõnurist, P., & Karo, E. (2016). State owned enterprises as instruments of innovation policy. Annals of Public and Cooperative Economics, 87(4), 623–648. https://doi.org/10.1111/apce.12126
- Zhang, F., Gallagher, K. S., Myslikova, Z., Narassimhan, E., Bhandary, R. R., & Huang, P. (2021). From fossil to low carbon: The evolution of global public energy innovation. WIREs Climate Change, 12(6), e734. https://doi.org/10.1002/wcc.734