
 ?Mathematical formulae have been encoded as MathML and are displayed in this HTML version using MathJax in order to improve their display. Uncheck the box to turn MathJax off. This feature requires Javascript. Click on a formula to zoom.
ABSTRACT
In the last decades several Conditional Cash Transfers (CCTs) have been implemented to interrupt the intergenerational transmission of poverty. More recently, they have also been used as a policy response to provide support to households hit by the COVID crisis. CCTs are being deployed as a development tool to reduce local communities’ vulnerability, increasing their resilience and capacity to adapt. In this context, this paper investigates if CCTs can reduce vulnerability to climate change by increasing the adaptative capacity of local communities. Indeed, while some literature has found that CCTs can reduce specific dimensions of vulnerability to socio-economic shocks, we argue that more research is necessary to understand their impact on vulnerability to climate change. Empirically, we use a panel of household survey data collected in Colombia in 2002 and 2006. We employ a difference-in-differences approach to analyse the impact of the CCT programme Familia en Acción (FA) CCTs on rural households. We consider seven components of vulnerability linked to climate change aggregated in an index: wealth, health, access to information, access to basic facilities, financial vulnerability, resilience to natural disasters, and nutrition. Our results differ from previous research and indicate that CCTs provided by the FA program do not decrease vulnerability to climate change. This finding suggests that CCTs are not a universal solution to reducing vulnerability to climate change and may be ineffective in specific contexts.
Key policy insights
The literature often assumes that CCTs can have a mitigating effect on vulnerability to climate change. Our research shows that in the context of Colombia, this assumption is incorrect.
The idea that providing monthly payments to households can reduce vulnerability to climate change should be considered with caution, given limited empirical evidence.
Policy makers and scholars should consider the multidimensional nature of vulnerability and design targeted interventions and avoid considering CCTs as a panacea to all aspects of vulnerability to climate change.
Our models show that the FA programme failed to have a significant impact in reducing vulnerability to climate change using several different specifications. We show that CCTs do not have an impact on numerous essential components such as wealth, health, access to infrastructure, information and knowledge, financial coping mechanisms, food consumption, and exposure to natural disasters.
1. Introduction
There is a growing literature analysing the impact of Conditional Cash Transfers (CCTs). This literature shows that CCTs have an effect in reducing environmental degradation (Malerba, Citation2020); reducing environmental poverty (Nawaz & Iqbal, Citation2021); and increasing resilience (Premand & Stoeffler, Citation2020). Previous research has focused on single outcomes, such as caloric intake (Leroy et al., Citation2009), education (Attanasio et al., Citation2005), or health (Fernald et al., Citation2008). Nevertheless, research has overlooked the extent to which CCTs may reduce vulnerability to climate change. With vulnerability to climate change, we mean ‘propensity or predisposition to be adversely affected and encompasses a variety of concepts and elements, including sensitivity or susceptibility to harm and lack of capacity to cope and adapt’ (IPCC, Citation2022, p. 5).
This paper aims to contribute to this literature by analysing the role that CCTs have on reducing vulnerability caused by climate change. The guiding research question is: Can conditional cash transfers reduce vulnerability to climate change? This paper analyses seven components of vulnerability: wealth, health, access to information, access to essential infrastructure, financial vulnerability, resilience to natural disaster, and nutrition. Vulnerability considers these multiple socio-economic characteristics at the base of a socio-economic system and its capacity to adapt. Thus, the vulnerability of this system is determined by the availability of resources, and particularly the entitlement of individuals and groups to use these resources (Adger & Kelly, Citation1999). Empirically, we look at the case study of Familia en Accìon (FA) programme. FA is a CCTs programme involving 721 municipalities throughout Colombia, which was initially created to promote welfare and reduce poverty in the most vulnerable communities. In this paper, we explore whether it also had an impact in reducing vulnerability to climate change (Davies et al., Citation2009a). Focusing on FA is important because it allows us to investigate the topic using panel data from a real-world intervention. This paper makes an original contribution by undertaking a difference-in-differences analysis of the extent to which CCTs can reduce vulnerability to climate change.Footnote1
It could be argued that CCTs are an important policy measure for adaptation to climate change, as one should aim to decrease vulnerability through tackling its socio-economic roots rather than reducing the impact of any particular hazard. CCTs could serve as a good cure for vulnerability as they could offer the potential to acquire the resources necessary to reduce vulnerability. Therefore, theoretically, CCTs can be considered as a vulnerability reduction intervention (Davies et al., Citation2009a), emphasising how adaptation can be conceptualized as a development issue. Although from a slightly different perspective, the combination between development and adaptation has been emphasized by numerous scholars regarding the necessity to give an integrated response to climate change that considers development challenges (Adger et al., Citation2003; Schipper & Pelling, Citation2006; Parry, Citation2009). At the policy level this has translated into the process of mainstreaming climate change into development strategies (Huq & Reid, Citation2004; Klein et al., Citation2007), while other scholars have claimed the case for pro-poor adaptation interventions (Tanner & Mitchell, Citation2008). Practical examples of this are the role of microfinance in supporting households in climate change adaptation (Hammill et al., Citation2009; Agrawala & Carraro, Citation2010) and adaptive social protections strategies (Davies et al., Citation2009b), which concern the enhancement of instruments such as cash transfers, safety nets, and crop insurance to tailor them to disaster risk reduction (DRR) and adaptation.
Finally, this paper is particularly relevant within the current discussion on social protection schemes as the COVID pandemic’s policy response has relied heavily on cash transfers to sustain livelihoods disrupted by the economic crisis. According to some estimates, over a billion people benefit from anti-poverty transfers (Barrientos, Citation2013). This number has surely increased during the pandemic. According to some early estimates, the number of social protection schemes put in place to respond to the COVID-19 crisis has exceeded 1,600 around the globe (The Economist, Citation2021). Some of these interventions are here to stay and might be used to support the livelihoods of those households hit by future climatic shocks and those who lose their jobs due to fast mechanisations and digitalization. This paper calls for an evaluation of the schemes implemented during the pandemic, as there are several lessons for the academic and policy practitioners that will be useful for the post-pandemic world where intertwined challenges like climate change and high unemployment might require radical interventions such as the introduction of Universal Basic Income (UBI) or CCTs.
In this paper, section 2 presents the conceptual framework deployed for the analysis; section 3 discusses the methodology and provides background information on the case study selected; section 4 analyses the results; and section 5 provides concluding remarks.
2. Conceptual framework: dimensions of social vulnerability to climate change and the impact of CCTs
CCTs can be defined as programmes that transfer cash, usually to deprived households, on the condition that they make pre-agreed investments in the human capital of their components (Fiszbein et al., Citation2009). Normally, these activities encompass health and nutrition check-ups for children and their mothers, growth monitoring, pre-natal care, information talks for mothers, and school attendance of individuals younger than 18 years old. Several of these interventions, especially in Latin America, have been increasingly used to reduce inequality and break the vicious cycle of generational transmission of inequality. The reasons for the growing use of CCTs are that, at the national level, a role is played by the popularity and the political feasibility of these interventions. Meanwhile, consistent evidence regarding positive impacts of CCTs (Gertler, Citation2004; Skoufias et al., Citation2001) attracted donor attention and their willingness to financially support such programmes. Nevertheless, this has also contributed to fuel the debate concerning aid effectiveness (Hanlon et al., Citation2012; Banjaree & Duflo, Citation2011). This paper argues that CCTs could be considered a vulnerability reduction scheme, as theory suggests that their broad impact could address many of the multiple roots of vulnerability to climate change (Wood, Citation2011).
Concerning our understanding of vulnerability to climate change, we align with the IPCC (Citation2022) approach and define vulnerability as the ‘propensity or predisposition to be adversely affected’ by climate change. This vulnerability ‘encompasses a variety of elements, including sensitivity or susceptibility to harm and lack of capacity to cope and adapt’ (IPCC, Citation2022, p. 5). A similar framework has been adopted by previous studies (Brooks, Citation2003; O’Brien et al., Citation2004; Füssel & Klein, Citation2006; Füssel, Citation2007; and O’Brien et al., Citation2008).Footnote2
Building on the existing literature, we examine vulnerability by looking at seven dimensions that affect the exposure, sensitivity, and adaptive capacity of poor households in different ways. These are briefly presented in . In the Supplementary Information we provide additional explanation for the inclusion of these dimensions, while in the next section we illustrate how these dimensions are operationalized and how these dimensions are potentially linked to CCTs. Essentially, what makes CCTs different from other traditional development interventions is that the conditionality and the influence of transfers over a wide set of different domains could result in wide and cross-cutting impacts. These dimensions are:
Wealth
Health
Nutrition
Access to infrastructure
Access to Information
Financial coping mechanisms
Exposure to natural disasters
Table 1. Summarises how the different dimensions analysed in this paper apply to the adopted conceptualisation of vulnerability.
3. Methodology
Our empirical setting is the Familia en Accìon programme. This programme, that provided CCTs to poor households in Colombia, was implemented in 612 municipalities of the 721 initially eligible. For our empirical analysis, we rely on survey data from over 8,436 households to build a multidimensional vulnerability index (FAVI) following the framework described above. Using data from two waves of the survey (2002 and 2005/2006), we rely on a difference-in-differences design, with household and time fixed effects to estimate the causal impact of CCT in reducing vulnerability. The next sections will describe the context of FA, will illustrate how we built our multidimensional vulnerability index, and will describe the methodological approach.
3.1. Case study background: Familia en Accìon (FA)
During the wave of CCTs implementation in South America in the early 2000s, the Colombian government launched a large-scale programme to promote welfare and support the formation of human capital within poor households. The programme had three components: health, nutrition, and education (Attanasio et al., Citation2004). Cash transfers were conditional on the household meeting several conditions for each component. For instance, to receive payments, families had to ensure that children attended at least 80% of the school days and bring children regularly to health centres for vaccinations and check-ups (cfr. Attanasio et al., Citation2004). The programme was initially implemented in 622 municipalities in 2001-2002. Following the redesign of the intervention in 2011, it reached 1102 municipalities, involving a total of approximately 2.6 million families. Eligibility for the programme was conditional on a series of requirements:
Be part of the lowest socio-economic level calculated through the welfare index SISBEN;Footnote3
Have at least one component who is younger than 18 years old;
Reside in a municipality where the programme is implemented (ibid).Footnote4 The municipality needs to have sufficient health and education infrastructures to assure that the programme can be delivered, and a bank office must be present so that the money can be transferred to the beneficiaries.
The data was collected in 2002, 2003, and 2005/6 and was made publicly available only for a short period of time on the website of the Departamento Nacional de Planeación (DNP) of the Repùblica de Colombia which was responsible for the programme and the data collection.Footnote5 Unfortunately, to the best of our knowledge, the DNP closed access to the website and we were unable to gain access to more recent data collection waves. We follow Malerba (Citation2020) and focus on the third wave as the follow up for the analysis. The original sample included data from interviews with 11,462 households in 2002 (baseline survey, or first wave), and 9,566 households between 2005 and 2006 (third wave). Our sample focus on 8,436 households for which the data is available in both waves.Footnote6 Of these households, 66.2% received CCTs, while the rest are used as a control group.
Two aspects are important to note here. First, to ensure support to the most vulnerable communities it was not possible to randomize allocation of the treatment. To overcome this issue, Attanasio et al. (Citation2004) developed a stratified random sampling process that matched municipalities that were treated, with ‘control’ municipalities that were similar to the ‘treated’ ones. The matching was carried out on a number of dimensions including: the region; the population; the level of urbanization; the number of eligible households; the life quality index; and the number of schools and hospitals in the municipality (cfr. Attanasio et al., Citation2004 for details).
Second, due to political pressures, almost half of the treated municipalities began receiving the transfers a few months before the baseline data collection of 2002 (Attanasio et al., Citation2012). This means that for many (non-random) households in these municipalities, the baseline assessment already contains some of the effects of CCTs. It is possible that households that started receiving the treatment before the baseline already started to spend on food or healthcare, hence reducing their vulnerability.
While we cannot fully address this issue, empirically we are able to compare the effect of the treatment across different samples: full sample, the sample that started receiving the treatment before the baseline, and the sample that had the treatment only after the baseline assessment.Footnote7 Moreover, we note that it is unlikely long-term changes in vulnerability would occur in the few months that separate the initial implementation of the programme and data collection, as getting access to water or electricity can take time. In this sense, taking the 2002 and 2005/2006 waves allows us to evaluate the long-term effects of CCTs. The alternative of looking at the data collected only in 2003, shortly after the programme start, would likely reveal that the programme had no effect.Footnote8 Finally, we note that this data is the best available to evaluate the impact of CCTs and it has been used in several articles. For instance, Malerba (Citation2020) uses it to study the effects on poverty alleviation and environmental degradation, while Attanasio et al. (Citation2012) use it to examine the impact of CCTs on food consumption.
3.2. The familia en accìon vulnerability index (FAVI)
As discussed in Section 2, this paper adopts the notion of vulnerability put forward by the fifth IPCC report. We identified different dimensions of vulnerability, and we follow Nawaz and Iqbal (Citation2021) to create a multidimensional vulnerability index using the Alkire-Foster methodology (Alkire et al., Citation2017). We chose this linear approach while aware that it might not capture the entire complexity of vulnerability dynamics as the different components of the index might interact with each other in different ways as highlighted by Tol and Yohe (Citation2007) and Fankhauser and McDermott (Citation2014). The index captures vulnerability across 7 different dimensions consistent with other indices from the literature (Grasso et al., Citation2013; Nguyen et al., Citation2017): wealth (COM1), health (COM2), access to information (COM3), access to essential infrastructure (COM4), financial vulnerability (COM5), resilience to natural disaster (COM6), and nutrition (COM7). We use 19 different indicators to operationalize these dimensions. Each dimension is further analysed in the Supplementary Information.
Wealth (COM1). The economic wealth of a household is considered a strong determinant of vulnerability as scholars agree on the role of income in coping with external pressures (Leichenko & Silva, Citation2014; Otto et al., Citation2017). We operationalize wealth looking at indicators that correlate with increased adaptive capacity focusing on expenditures on household assets. These consist of expenditure on house repairs, stove, and fridges, bicycles, and durables.
Health (COM2). We use as a proxy of household health their expenditures on medicines, hospital services, medical exams, medical consultations, anti-conception and orthopaedic appliances. The idea is that healthier households are more likely to recover from extreme events or food shortages and we assume that a higher expenditure on the items reported above will result in the increase of the health status for the target group.
Access to information (COM3). Information is essential to reduce vulnerability, as it can increase preparedness, resilience, and adaptive capacity. In Colombia, in the early 2000s, one of the key sources of information was television, especially in poor communities. Hence, we look at two indicators – access to black-and-white TV and access to colour TV – as an essential element of information.
Access to essential infrastructure (COM4). Access to basic facilities is essential to cope with the external stressors associated with climate change. Households without access to such basic services are more exposed to extreme climate events and changes in climate. We examine three indicators: access to electricity, a water drainage system, and aqueducts.
Financial vulnerability (COM5). A key component of vulnerability is adaptive capacity. Families exposed to extreme climate events and natural disasters that do not have the financial means to cope with unexpected events will be significantly more vulnerable that those prepared to deal with these events. Hence, we operationalize financial vulnerability looking at expenditures on insurances.
Exposure to natural disaster (COM6). Important indicators that indicate exposure to natural disaster is the type of housing infrastructure in which families reside. Our data contains information on the roof and wall type of the house occupied by the household. We use these ordinal variables to operationalize family resilience to natural disaster. However, given that these indicators have over 40% of missing values, we will only include them in our FAVI index as robustness checks.
Nutrition (COM7). In poor communities, increase in caloric intake is positively correlated with health outcomes. This is widely documented in several studies (Agüero et al., Citation2006; Hoddinott & Skoufias, Citation2004). We examine caloric intake by looking at the number of kilograms of meat and dairy products consumed monthly by the household. We focus on these products because in poor households their consumption is often lower than the desirable level, and it is highly correlated with overall more complete diets. Also, this component has several non-random missing values (approximately 47%), and for this reason we only include it in the analysis as a robustness check.
In line with previous research, we assign equal weights to each component of the FAVI as well as to the individual sub-indicators (Alkire & Foster, Citation2011; Nawaz, Citation2021; Nawaz & Iqbal, Citation2021). The vulnerability indicator is created in four steps. First, we add the sub-indicators in each component to create a single score for each dimension.Footnote9 Second, we rescale all components to be bounded between 0 and 1. This is to assign equal weight to each dimension. Note that contrary to previous approaches, each one of our dimensions takes a continuous score that goes from 1 to 0 rather than dichotomizing these variables. This allows us to create a more fine-grained measure of vulnerability that considers different level of spending. Third, we add each component together to create our multidimensional vulnerability index. For every year t and household I our environmental index will be thus defined:
where
is the standardized dimension score, and w is the weight of each dimension.Footnote10 Finally, we reverse coded the FAVI index, so that higher scores indicate households that are more vulnerable.
Empirically, the baseline FAVI index only uses five components of vulnerability, excluding exposure to natural disaster and nutrition. It goes from 0 that indicates the household with the minimum vulnerability, to 3.69 that indicates the household with maximum vulnerability. A FAVI score of 3.69 indicates households have no access to information and essential infrastructure and do not have any expenses, on health, wealth, and financial components to reduce vulnerability. Conversely, households with FAVI score close to 0 are those that perform relatively better across the components of vulnerability.Footnote11 provides basic descriptive statistics of the FAVI index. Note that we build three separate indexes. While the baseline FAVI index only uses five components of vulnerability the second FAVI score include the natural disaster component (maximum score of 4.53), while the last FAVI includes nutrition (maximum score of 4.64). shows how the inclusion of the nutrition and the natural disaster components leads to more missing values. Finally, provides descriptive statistic for each sub-indicator used to build individual vulnerability components.
Table 2. Summary statistics.
3.3. Empirical methodology
To causally identify the effects of the FA on vulnerability, we use a difference-in-differences (DiD) approach. Identifying the effects of CCT on vulnerability is challenging. The main problem is that households were not randomly assigned to the programme. Families participating in the programme are different from those not participating in the programme in several observable and unobservable ways. This is a threat to the identification of the causal effect of CCTs on vulnerability given that differences in education, income, or family size, are likely to be correlated both with the participation in the FA programme and with FAVI.
DiD overcomes this omitted variable bias, comparing changes over time in the control group with changes over time in the treatment group, allowing for the identification of the causal effect of FA on vulnerability in the presence of systematic differences in the control and treatment groups. The main assumption of the DiD is that in the absence of the FA, the evolution of the FAVI index of the treated group and of the control group would be on parallel trends. While this assumption is not testable, we follow the methodological literature and include several controls to make it more plausible (Angrist & Pischke, Citation2014). Our baseline model uses households fixed effects and year fixed effects to control for all the observed and unobserved time invariant heterogeneity across households and the time varying factors that affect all households. We also include as control variables income, size, and age composition of the household to account for important time varying aspects at the household level.
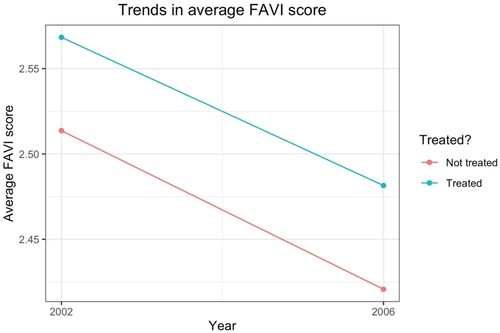
illustrates trends in the treatment and control group in the baseline FAVI scores. Two aspects are noticeable; first, that the FAVI scores decline over time, which means that the vulnerability decreases. This improvement is likely to reflect the growing economic development of the country as well as the effect of country level policies and programmes, such as Empleo en Accion, VISU, Jovenes en Accion, and Laboratorios de Paz, all of which target the same strata of society as FA. Second, these scores appear to be on parallel trends, hence suggesting a lack of impact of CCT on vulnerability.
Figure 1. Trends in the average FAVI scores over time Note: This plot uses our baseline FAVI score that is based on five components and has the fewer missing values.
Formally, we estimate the following model:
where
is the multidimensional vulnerability index score that household i has in year t.
is an indicator variable taking the value of 1 if the household was trained and the year was 2006.
is the set of control variables described above.
and timet are household and time fixed effects that control for all the time invariant unobserved characteristics, such the location of the household, race, gender composition, etc. that are time invariant. Provided that our identification assumptions are correct,
will identify the causal effect of CCT in FA on the vulnerability of households.
We estimate these models using three separate samples of data. The first includes all the observations available. The second only includes the households in the municipalities where CCTs started before the start of data collection. These municipalities will be referred to as Early Treated (ET). The final subsample includes households in municipalities that were treated after the start of data collection, i.e. Correctly Treated (CT).Footnote12
We present all results for transparency. Indeed, including ET households could bias downwards our results as their FAVI score could have already started to improve before the baseline began. Attanasio et al. (Citation2005) use an external dataset to control if, at baseline, ET households where more likely to enroll kids into school compared to the pre-baseline period. They found that ET households were significantly more likely to enrol kids in school at baseline compared to the previous period (Attanasio et al., Citation2005). However, also excluding ET households from the sample could bias our results. Indeed, the first municipalities that implemented the programme are likely to be the more dynamic, living in locations with more efficient local administration and less corruption. We argue that on ET municipalities, CCTs are likely to have a smaller effect in any case, given that they have a lower level of vulnerability to begin with. This lower vulnerability could reduce the impact of CCTs targeted to improve conditions for the poorest household. We will hence present results of our DiD model across the three different samples: on the full sample that include all households; on the sample of ET households; and on the sample to CT households.
4. Results
reports model estimations for the impact of the CCTs on the FAVI for the period 2002-2006. Column 1–4 show the estimated effects on our baseline FAVI index with 5 components. Column 1 reports the results on the full sample of households without controls. The model shows that CCTs have a positive but insignificant impact on the FAVI index. Note that the coefficient on the year dummy (2006) is negative and significant suggesting that, in general, the vulnerability of households has declined over time.
Table 3. The effects of FA on the FAVI indexes by different treatment groups.
Column 2 is our main specification that also includes controls in the estimation. Again, the treatment is not significantly associated with the FAVI score, while vulnerability has declined overtime. As we would expect, monthly income is negatively associated with the FAVI score, though the effect is small. A 10% increase in income reduces the FAVI score by 0.05, which is 7% of its standard deviation. We find that household size is negatively associated with the FAVI score. This result may be a consequence of the indicators we use to build the FAVI index, where many of them refer to expenditure on issues like health or home repairs. We argue that even if we control for income and other characteristics, larger households are likely to spend more on health and durables compared to households with fewer members. Finally, the model does not find a significant association between the FAVI score and the number of minors and the number of over 65 years old in the household (p-value< = 0.05), suggesting that household composition does not affect vulnerability.
Column 3 only includes the households that were treated before the baseline assessment. Note that as we would expect, the effect on the group that begins transfers (i.e. the ‘early treated’ or ET group) is smaller compared to the group that were treated after the start of data collection (i.e. ‘correctly treated’ or CT group in Column 4). The effect of the treatment is positive and significant at the 10% level, suggesting that the estimated effect on this group may be upward biased. As discussed previously, households that received the CCTs soon before the baseline was collected may have artificially increased spending, hence inflating the initial value of the FAVI score. However, it is important to note that while the treatment has a larger effect in terms of magnitude on the correctly treated group (Column 4), the coefficient is very close to 0 and not statistically significant, suggesting that CCT do not impact the FAVI score.
To test the robustness of these findings, we use two alternative operationalisations of the FAVI index: one including resilience from natural disaster (columns 5-7), and the other including monthly food consumption (columns 8-10). We argue that these are likely to be important elements of households’ vulnerability and that they may be affected by CCTs. Yet, while they make our FAVI measure more precise, they risk generating biased results. Indeed, in our data, there are many non-random households for which this information is not available. Hence, these results are only about more responsive households. shows that our results are consistent with the model using the baseline FAVI specification and that CCTs do not cause the FAVI index to improve.
5. Discussion
An explanation for these null findings is that they are an artificial result of the way we built our FAVI index. Indeed, while vulnerability is a multidimensional concept, our index may mask important improvements on specific components. To examine this hypothesis, we examined if the CCT has heterogeneous effects on different dimensions.
is a coefficient plot that shows the estimated effect of CCT on individual vulnerability dimensions. The models are estimated using the main estimation strategy: a DID with controls on the full sample. Results are remarkably consistent. The effects of the FA are very small in magnitude and indistinguishable from 0 for every component suggesting that CCTs did not reduce the vulnerability of households involved in the FA programme.
Figure 2. FA impact on the individual dimensions of vulnerability (2002–2006). The figure reports confidence intervals at the 5% level.
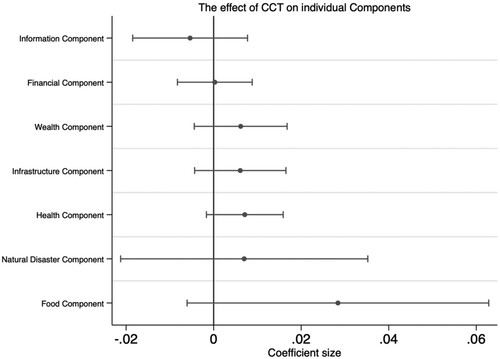
We note that the only coefficient close to significance (p = 0.112) relates to the health dimension, yet rather than being negative, we find it to be positive. We believe that this may reflect the bias in the early treated group. In the short-term, households may be able to invest more in health when they receive the CCT but are unable to sustain this expense in the long run. in the Supplementary Information shows the results used to generate and to estimate the model on the health component for the early treated group. For this group of households, the effects of CCTs on health are positive significant, suggesting that the early treated group may be upward biasing this coefficient.Footnote13
The absence of a statistically significant effect on the wealth component might be explained by the households’ expenditure preferences. The beneficiaries of the cash transfer might choose to spend the additional resources on consumption goods such as food, beverages, or clothes instead of durable goods such as home appliances, furniture, or tools which are captured by the wealth component. This might be related to households’ choices but also because, generally, limited monthly payments are not enough to cover investment in durable goods and assets. In fact, a significant share of the households targeted by the programme do not have access to a bank account and lack financial literacy that would otherwise facilitate households to save and to invest in productive assets instead of consumption. Evidence from experiments in Kenya support this (Egger et al., Citation2021) showing that households, when they receive one large lump-sum payment instead of smaller payments, are more likely to invest in durable goods and assets. This effect applies, for example, to investments in televisions (information component) and in connections to the aqueduct, sewage systems, and electricity (infrastructure component) and change in home materials (natural disasters component). In fact, investment impacts for these components would require much more than what is transferred to the households with FA. Therefore, for households receiving CCT, expecting a result for these components might be considered overoptimistic.
Since investments in insurance (financial component) and medicine and hospital visits (health component) require less capital, the monthly transfers should be enough to cover such expenses. Therefore, we believe that the lack of impact on these targets could relate to other reasons, such as, the lack of education and information regarding the importance that such services might play a role, along with households’ preferences. Lack of access to such services could be also another reason, since some of the villages with households covered by CCT might be particularly remote and may not have close access to hospitals, pharmacies, and insurance companies. Difficult access makes it harder for willing households to invest in such services.
On a final note, the lack of impact on food consumption is quite surprising, as other impact evaluations of the programme have found impact in this area. Attanasio et al. (Citation2012) show that target households on average tend to spend more on food than untreated households do. There are two possible explanations for this inconsistency with the literature. In addition to the early treated effect, which has been discussed above, this trend could also be related to the fact that, due to data limitations, our paper measures food consumption with a selected number of items, instead of the full spectrum of food products.
5.1. The future of CCTs and climate change in the post-COVID world
One potential criticism of this study is that adaptation and vulnerability to climate change are simply not the same issue in development. CCTs do not currently have any element that specifically addresses climate change. The process of mainstreaming climate change into development policies could be repeated at a lower level incorporating climate change into specific development interventions. It would be interesting to investigate how climate change could be mainstreamed specifically into CCTs. An option to ‘climate proof’ CCTs would be to require as a conditionality, such as household participation in activities that enhance the adaptive capacity and that inform communities about the effects of climate change. Such initiatives might include targeted training programmes; community vulnerability assessments or community focus groups; and workshops on the vulnerability to climate change and adaptation. Some interesting insights could arise from examples of community preparedness activities borrowed from the disaster risk reduction literature, such as ‘participatory capacity and vulnerability assessments’ (von Astrid and Holloway, 1996; de Oxfam, Citation2001).
It is also observed that COVID policy response has involved a vast number of cash transfers to households hit by the economic crisis caused by the pandemic. Some of these tools are here to stay as households will face similar shocks caused by climate change intertwined with high unemployment caused by radical mechanization and digitalization. In this context, several experiments of universal basic income (UBI) schemes have been implemented in developed (Canada, Finland, Germany) and developing countries (Brazil, Kenya, Uganda). Given this, there is a need for scholars to study such interventions in more detail considering the recent events that might offer a glimpse of the policy challenges of the post-COVID world.
6. Conclusion
This paper adopts a conceptualization of vulnerability to climate change that considers the multiple roots of vulnerability for its analysis. Building on this framework, it analyses the impact that Conditional Cash Transfer (CCT) initiatives have on the various dimension of vulnerability to climate change.
This paper first evaluates the assumption that CCTs will impact vulnerability to climate change in reference to the existing literature and theory on CCTs. Theoretically, the existing literature illustrated that CCTs can influence the different components vulnerability to climate change. However, the results from our quantitative analysis of the FA case study in Columbia revealed that CCTs did not have the impact that the theoretical literature suggests (Wood, Citation2011). The suggestion that providing monthly payments to households can reduce their vulnerability should be considered with caution, as it lacks any sophisticated empirical evidence. Policy makers and scholars should reconsider the multidimensional impact of these interventions and avoid considering CCTs as a panacea to all aspects of vulnerability to climate change.
These findings were reached employing a rigorous methodology to examine the causal effects of CCTs. Yet, admittedly, the value of this analysis is conditional on the quality of the data available. We discussed the challenges related to the way Familia en Accion (FA) was implemented, and also those analytical challenges related to the large number of missing values in the data that create some uncertainty in our findings. These red flags suggest the need to be cautious in generalizing the findings of this paper and should be taken as an encouragement to conduct further research on the topic. Yet, our models show that FA failed to have a significant impact in reducing vulnerability using several different specifications of the notion of vulnerability; FA did not affect essential components of vulnerability such as: wealth, health, access to infrastructure, information and knowledge, financial coping mechanisms, food consumption, and exposure to natural disasters.
In conclusion, this paper argues that, in the hands of policy makers, CCTs may be a useful tool to reduce poverty and welfare, but it is not a given that they will have an impact on vulnerability to climate change. Improving the performance of important components of any vulnerability index – including wealth, health, access to infrastructure, information, financial coping mechanisms, exposure to natural disasters and nutrition – require different, more targeted interventions.
Disclaimers
The views and opinions expressed in this article are those of the authors and do not necessarily reflect the views or positions of any entities and institution they represent or are affiliated to.
Supplemental Material
Download MS Word (34.9 KB)Acknowledgments
The authors are grateful to Daniele Malerba for generously sharing the data on the Familia en Acción project with us and to the reviewers and editors of Climate Policy for their helpful and constructive comments. The authors remain responsible for any shortcomings.
Disclosure statement
No potential conflict of interest was reported by the author(s).
Notes
1 For the purposes of this paper, the term “vulnerability” refers to vulnerability to climate change.
2 s Note that our definition departs from those of previous studies in that it does not consider environmental factors of shock or stress as part of vulnerability. This is because it would be unreasonable to argue that CCTs could have an impact on these external stressors.
3 SISBEN is an indicator of economic well-being that is used in Colombia for targeting welfare programmes.
4 Eligible villages had to be <100.000 inhabitants as of 1999.
5 The data was later withdrawn from public access from the government website. Our analysis is based on the replication dataset provided from Malerba (Citation2020). Without his support this paper would not have been possible.
6 Due to the low rate of mobility and the efforts made to follow moving households, the attrition rate was only 17%. Also, note that the surveys were conducted in 122 municipalities divided between treatment and control groups. Our final data contains households from 109 of these municipalities for which survey respondents were consistently available across the two waves.
7 Given that the control group is matched, we are able use an appropriate subset of control households for each group of treated ones.
8 Another issue is practical. Data for 2003 was no longer available to the authors of this paper.
9 Note that each dimension uses comparable indicators. These are either consist of a series of dummies, indicating whether the household has a particular attribute, or by expenditures that are inherently comparable. Note that to reduce the effect of outliers we take the natural log of all expenditure measures. For the ordinal variables that indicate natural disaster, we standardised the variables to account for different averages and standard deviation, then we added them together and rescaled to be bounded between 0 and 1.
10 Dimensions with only one indicator are simply standardised between 0 and 1.
11 Note that even the best performing household have a relatively high-level vulnerability given that, if a household performed perfectly in all the components (with a score of 1), the range of the FAVI index would be between 0 and 7.
12 Note that the control groups for the CT and ET households are drawn from municipalities matched by Attanasio et al. (Citation2004) to have similar population size and an index of quality of life index, hence making our identification strategy more robust.
13 Note that this coefficient, while significant, is positive, suggesting that CCTs increase vulnerability. However, for the reason described in the main text, we believe that this finding should be interpreted as a sign of upward bias experienced in the early treated group rather than as an indication of a negative correlation between CCTs, and the health component of vulnerability.
References
- Adger, W. N., Huq, S., Brown, K., Conway, D., & Hulme, M. (2003). Adaptation to climate change in the developing world. Progress in Development Studies, 3(3), 179–195. https://doi.org/10.1191/1464993403ps060oa
- Adger, W. N., & Kelly, P. M. (1999). Social vulnerability to climate change and the architecture of entitlements. Mitigation and Adaptation Strategies for Global Change, 4(3/4), 253–266. https://doi.org/10.1023/A:1009601904210
- Agrawala, S., & Carraro, M. (2010). Assessing the Role of Microfinance in Fostering Adaptation to Climate Change. [Online]. http://www.feem.it/getpage.aspx?id=3198&sez=Publications&padre=73 [accessed 20 September 2013].
- Agüero, J. M., Carter, M. R., & Woolard, I. (2006). The impact of unconditional cash transfers on nutrition: The South African child support grant. Southern Africa labour and development research unit, working paper number 06/08. SALDRU, University of Cape Town, Cape Town.
- Alkire, S., & Foster, J. (2011). Understandings and misunderstandings of multidimensional poverty measurement. The Journal of Economic Inequality, 9, 289–314.
- Alkire, S., Roche, J. M., & Vaz, A. (2017). Changes over time in multidimensional poverty: Methodology and results for 34 countries. World Development, 94, 232–249.
- Angrist, J. D., & Pischke, J. S. (2014). Mastering’ metrics: The path from cause to effect. Princeton University Press.
- Attanasio, O., Battistin, E., & Mesnard, A. (2012). Food and cash transfers: Evidence from Colombia. The Economic Journal, 122(559), 92–124. https://doi.org/10.1111/j.1468-0297.2011.02473.x
- Attanasio, O., Benavides, C., Borda, C., Carvajal, M. E., Gomez, C., … Vera-Hernandez, M. (2004). Baseline report on the evaluation of familias en accìon. EDePo, centre for the evaluation of development policies. IFS.
- Attanasio, O., Fitzsimons, E., & Gomez, A. (2005). The impact of a conditional education subsidy on school enrolment in Colombia. In Edepo, centre for the evaluation of development policies, report summary familias 01. IFS.
- Banjaree, A. V., & Duflo, E. (2011). Poor economics: A radical rethinking of the Way to fight global poverty. Public Affairs Ediction.
- Barrientos, A. (2013). Social assistance in developing countries (1st ed.). Cambridge University Press.
- Brooks, N. (2003). Vulnerability, Risk and Adaptation: A Conceptual Framework. Tyndall Centre for Climate Change Working Paper 38, University of East Anglia, Norwich, UK.
- Davies, M., Guenther, B., Leavy, J., Mitchell, T., & Tanner, T. (2009). Climate change adaptation, disaster risk reduction and social protection: Complementary roles in agriculture and rural growth? IDS Working Papers, 2009(320), 001–037. https://doi.org/10.1111/j.2040-0209.2009.00320_2.x
- Departamento Nacional de Planeación, Repùblica de Colombia. (2002). Evaluación De Programas De Asistencia Social: formulario hogares particulares.
- Egger, D., Haushofer, J., Miguel, E., Niehaus, P., & Walker, W. M. (2021). General Equilibrium Effects of Cash Transfers: Experimental Evidence from Kenya. NBER Working Papers Series. Working Paper 26600.
- Fankhauser, S., & McDermott, T. K. J. (2014). Understanding the adaptation deficit: Why are poor countries more vulnerable to climate events than rich countries? Global Environmental Change, 27, 9–18. https://doi.org/10.1016/j.gloenvcha.2014.04.014
- Fernald, L. C. H., Gertler, P. J., & Neufeld, L. M. (2008). Role of cash in conditional cash transfer programmes for child health, growth, and development: an analysis of Mexico’s Oportunidades. Lancet, 371(9615), 8–14.
- Fiszbein, A., Schady, N., & Ferreira, F. (2009). Conditional Cash Transfers: reducing present and future poverty. World Bank Publications.
- Füssel, H. (2007). Vulnerability: a generally applicable conceptual framework for climate change research. Global Environmental Change, 17(2), 155–167. https://doi.org/10.1016/j.gloenvcha.2006.05.002
- Füssel, H.-M., & Klein, R. J. T. (2006). Climate change vulnerability assessments: an evolution of conceptual thinking. Climatic Change, 75(3), 301–329. https://doi.org/10.1007/s10584-006-0329-3
- Gertler, P. (2004). Do conditional cash transfers improve child health? Evidence from PROGRESA′s control randomized experiment. American Economic Review, 94(2), 336–341. https://doi.org/10.1257/0002828041302109
- Grasso, M., Moneo, M., & Arena, M. (2013). Assessing social vulnerability to climate change in Samoa. Regional Environmental Change, 14(4), 1329–1341. https://doi.org/10.1007/s10113-013-0570-z
- Hammill, A., Matthew, R., & McCarter, E. (2009). Microfinance and climate change adaptation. IDS Bulletin, 39(4), 113–122. https://doi.org/10.1111/j.1759-5436.2008.tb00484.x
- Hanlon, J., Barrientos, A., & Hulme, D. (2012). Just give money to the poor: The development revolution from the global South. Kumarian Press.
- Hoddinott, J., & Skoufias, E. (2004). The impact of PROGRESA on food consumption. Economic Development and Cultural Change, 53(1), 37–61. https://doi.org/10.1086/423252
- Huq, S., & Reid, H. (2004). Mainstreaming adaptation in development. IDS Bulletin, 35(3), 15–21. https://doi.org/10.1111/j.1759-5436.2004.tb00129.x
- IPCC. (2022). Summary for Policymakers [H.-O. Pörtner, D.C. Roberts, E.S. Poloczanska, K. Mintenbeck, M. Tignor, A. Alegría, M. Craig, S. Langsdorf, S. Löschke, V. Möller, A. Okem (eds.)]. In H.-O. Pörtner, D. C. Roberts, M. Tignor, E. S. Poloczanska, K. Mintenbeck, A. Alegría, M. Craig, S. Langsdorf, S. Löschke, V. Möller, A. Okem, & B. Rama (Eds.), Climate change 2022: Impacts, adaptation and vulnerability. Contribution of working group II to the sixth assessment report of the intergovernmental panel on climate change (pp. 3–33). Cambridge University Press. https://doi.org/10.1017/9781009325844.001.
- Klein, R. J. T., Eriksen, S. E. H., Næss, L. O., Hammill, A., Tanner, T. M., … O’Brien, K. L. (2007). Portfolio screening to support the mainstreaming of adaptation to climate change into development assistance. Climatic Change, 84(1), 23–44. https://doi.org/10.1007/s10584-007-9268-x
- Leichenko, R., & Silva, J. A. (2014). Climate change and poverty: vulnerability, impacts and alleviation strategies. WIRES Climate Change, 5(4), https://doi.org/10.1002/wcc.287
- Leroy, J. L., Ruel, M., & Verhofstadt, E. (2009). The impact of conditional cash transfer programmes on child nutrition: a review of evidence using a programme theory framework. Journal of Development Effectiveness, 1(2), 103–129. https://doi.org/10.1080/19439340902924043
- Malerba, D. (2020). Poverty alleviation and local environmental degradation: An empirical analysis in Colombia. World development, 127. doi:10.1016/j.worlddev.2019.104776
- Nawaz, S. (2021). Energy poverty, climate shocks, and health deprivations. Energy Economics, 100, 105338.
- Nawaz, S., & Iqbal, N. (2021). How cash transfers program affects environmental poverty among ultra-poor? Insights from the BISP in Pakistan. Energy Policy, 148(Part B), 111978. https://doi.org/10.1016/j.enpol.2020.111978.
- Nguyen, C. V., Horne, R., Fien, J., & Cheong, F. (2017). Assessment of social vulnerability to climate change at the local scale: development and application of a Social Vulnerability Index. Climatic Change, 143(3-4), 355–370. https://doi.org/10.1007/s10584-017-2012-2
- O’Brien, K., Eriksen, S., Schjolden, A., & Nygaard, L. (2004). What’s in a word? Conflicting interpretations of vulnerability in climate change research. CICERO Working Paper 2004: 04. University of Oslo, Oslo.
- O’Brien, K., Sygna, L., Leinchenko, R., Adger, W. N., Barnett, J., Mitchell, T., Schipper, L., Tanner, T., Vogel, C., & Mortreux, C. (2008). Disaster Risk Reduction, Climate Change Adaptation and Human Security. GECHS Report 2008:3, Global Environmental Change and Human Security, Oslo, Norway.
- Otto, I. M., Reckien, D., Reyer, C. P. O., Marcus, M., Le Masson, V., Jones, L., Norton, A., & Serdeczny, O. (2017). Social vulnerability to climate change: a review of concepts and evidence. Regional Environmental Change, 17(6), 1651–1662. https://doi.org/10.1007/s10113-017-1105-9
- Oxfam. (2001). Participatory Capacities and Vulnerabilities Assessment: Finding the link between disasters and development. Oxfam Great Britain. Philippines Programme.
- Parry, M. (2009). Climate change is a development issue, and only sustainable development can confront the challenge. Climate and Development, 1(1), 5–9. https://doi.org/10.3763/cdev.2009.0012
- Premand, P., & Stoeffler, Q. (2020). Policy research working papers. Policy Research Working Paper, No. 9473. World Bank, Washington, DC. https://doi.org/10.1596/1813-9450-9473
- Schipper, L., & Pelling, M. (2006). Disaster risk, climate change and international development: scope for, and challenges to, integration. Disasters, 30(1), 19–38. https://doi.org/10.1111/j.1467-9523.2006.00304.x
- Skoufias, E., Parker, S., Behrman, J., & Pessino, C. (2001). Conditional cash transfers and their impact on child work and schooling: Evidence from the Progresa programme in Mexico. FCDN Discussion Paper No. 123. IFPRI, Washignton, DC.
- Tanner, T., & Mitchell, T. (2008). Entrenchment or enhancement: Could climate change adaptation help to reduce chronic poverty? IDS Bulletin, 39(4), 6–15. https://doi.org/10.1111/j.1759-5436.2008.tb00471.x
- The Economist. (2021). Bouncing back - How to make a social safety net for the post-covid world. [Online]. Available at: https://www.economist.com/leaders/2021/03/06/how-to-make-a-social-safety-net-for-the-post-covid-world [accessed 16 March 2020].
- Tol, R. S. J., & Yohe, G. W. (2007). The weakest link hypothesis for adaptive capacity: an empirical test. Global Environmental Change, 17(2), 218–227. doi:10.1016/j.gloenvcha.2006.08.001
- Wood, R. G. (2011). Is there a role for cash transfers in climate change adaptation? IDS Bulletin, 42(6), 79–85. doi:10.1111/j.1759-5436.2011.00277.x