
ABSTRACT
The urgent need to reduce greenhouse gas emissions, remove carbon from the atmosphere and stabilize natural carbon sinks has led to the development of many carbon management measures, increasingly including voluntary carbon offsets (VCOs). We studied carbon management in universities, institutions with large carbon footprints and considerable influence in climate science and policy fora. However, concerns that VCOs may deter adopters (including universities) from adopting other carbon reduction measures and limit emissions reductions, for example, through moral hazard, have been raised but understudied. We compared the carbon management characteristics (priorities, policies, practices and emissions) of universities that did and did not adopt VCOs. We found adopters measured carbon emissions for longer, and had set targets to reach net zero earlier than had non-adopters. Adopters of VCOs also undertook more carbon management practices in both 2010 and 2020 than non-adopters. We also found that both adopters and non-adopters significantly increased their carbon management practices over the decade studied, but with no difference between groups. Gross CO2 emissions were reduced significantly over time by adopters of VCOs but not by non-adopters, whereas carbon intensity and percentage annual emissions reductions did not relate to adoption status. Consequently, our study showed no indication of mitigation deterrence due to adoption of VCOs at the universities studied. Rather, greater emissions reductions correlated with earlier net zero target dates, and a higher number of policies and carbon management practices. However, our study was constrained to universities that were affiliated with a national environmental network, so research beyond these organizations, and with individuals, would be useful. The survey was voluntary, exposing the study to potential self-selection bias so the findings may not be generalized beyond the study group. Finally, we found the carbon accounting method currently required of universities for scope 1 and 2 emissions may underestimate emissions reductions, particularly for adopters of VCOs. Augmenting the current location-based accounting method with market-based carbon accounts may overcome this.
Key policy insights:
Adopters of voluntary carbon offsets (VCOs) undertook more carbon management practices than non-adopters. Evidence for mitigation deterrence was therefore not found (e.g. via moral hazard).
Both adopters and non-adopters of carbon offsets used mitigation hierarchies found in carbon management literature (measure, reduce then offset). However, clarity on reducing emissions to as low as reasonably practicable is lacking in the literature.
Reductions in scope 1 and 2 emissions may be underestimated, especially for adopters of VCOs who adopted more practices not included in current carbon reporting (e.g. purchasing renewable energy). This may be overcome by reporting market-based emissions alongside location-based emissions.
Introduction
Global carbon neutrality by 2050 followed by net negative emissions through rapid reductions of greenhouse gas emissions, removal of carbon from the atmosphere and stabilization of natural carbon pumps and sinks are required to increase the possibility of limiting global warming to below 1.5°C (Field et al., Citation2012; Hansen et al., Citation2017; IPCC, Citation2018; IPCC, Citation2023; Mach et al., Citation2014; Mascia & Mills, Citation2018; Reid et al., Citation2009). Voluntary carbon offsets (VCOs), which reduce carbon emissions or remove atmospheric carbon, have emerged as part of a combination of approaches to help address climate change (Kauppi et al., Citation2001). However, several authors claim adoption of VCOs, for example by universities, governments, individuals or businesses, deters the adoption of other carbon mitigation actions (Anderson, Citation2012; Canzi et al., Citation2006), while others claim the opposite (Reynolds, Citation2014), leading to confusion which may itself stall climate mitigation (Jebari et al., Citation2021). Therefore, we study the carbon management strategies, including carbon offsetting, by universities in the UK and USA, as they have large carbon footprints and are influential in climate science and policy (Mitchell-Larson et al., Citation2020).
Voluntary carbon offsets are certificates relating to one metric tonne of carbon dioxide (1MTCO2) emissions that are either reduced, for example through forest protection or renewable energy generation, or removed from the atmosphere, for example through afforestation (Broekhoff et al., Citation2019). Projects creating VCOs can be certified, for example, through Gold Standard (Gold-Standard, Citation2019), to ensure high environmental and ethical standards of VCOs. We define our use here of the term VCO to include carbon credits (Woo et al., Citation2021) but not Renewable Energy Certificates (see Supplementary Material 1 for more detail). Guidance on buying high-quality, ethical VCOs within a mitigation hierarchy that prioritizes emissions reductions before offsets are provided by VCO certification bodies and retailers including Climate Neutral Now (UNFCCC, Citation2022); government bodies such as UK’s Carbon Trust (Ceppi, Citation2006); and sector-specific bodies such as Second Nature and the Environmental Association of Universities and Colleges (EAUC) for academic institutions (Second-Nature, Citation2016; Mitchell-Larson et al., Citation2020). While carbon markets are beyond the scope of this study, and are described elsewhere (Woo et al., Citation2021), we note the International Carbon Reduction and Offsetting Accreditation (ICROA) and Integrity Council for the Voluntary Carbon Market work to improve performance of the VCO market.
VCO retailers, accreditation bodies and associated literature consistently specify that VCOs sit at the bottom of the carbon mitigation hierarchy which starts with measure, then reduce, then offset (Second-Nature, Citation2016; CNN, Citation2022; Gold-Standard, Citation2019). Elsewhere, VCOs are recommended only as a transition technology; to achieve net negative emissions; or be reserved for hard-to-avoid emissions (Allen et al., Citation2020; Mitchell-Larson et al., Citation2020). This is consistent with long-standing regulations on environmental protection and restoration, and prevention and remediation of wastes and pollution. For example, EU directives regulating environmental impacts on people, the environment and climate, include a mitigation hierarchy: avoid, reduce, remedy (e.g. through restoration or offsets), then compensate impacted communities (EU, Citation2011; Wathern, Citation1992).
Further, UK policies require that waste and pollution be reduced to as low as reasonably practicable (ALARP) (Burgman, Citation2005; Pike et al., Citation2020) using the best practicable environmental options (BPEO) (Lewis, Citation1988). More widely, the long-standing ‘polluter pays principle’ requires polluters to reduce and remedy their wastes and pollution, and pay compensation for damages, bearing the costs themselves (de Sadeleer, Citation2015; EU, Citation2004). Therefore, current conditions can be considered to require carbon emissions to be addressed first by avoiding and reducing carbon emissions to as low as reasonably practicable, then remedying and compensating for damages.
Despite this policy and legal context, concern exists that adopting VCOs may degrade action to reduce carbon emissions by polluters and hinder emissions reductions, possibly via moral hazard (Anderson, Citation2012; Canzi et al., Citation2006; Günther et al., Citation2020). Moral hazard is an insurance industry concept, with wide-ranging interpretations and uses, but generally describes the hidden effect whereby insurance removes incentives to reduce associated risks to the individual (Rowell & Connelly, Citation2012). The concept of moral hazard spread beyond insurance, economics and individuals, to organizational behaviours and carbon management (Jebari et al., Citation2021). Moral hazard shifts risks and costs onto other insurance holders or wider society, was appropriated as a populist pejorative term (Rowell & Connelly, Citation2012). However the term ‘moral hazard’ is considered a ‘misnomer’ in the context of VCOs, as the decision to pollute and offset reside with the same agent (Wagner & Zizzamia, Citation2022). Applying moral hazard to VCO adoption assumes VCOs are substituted for other carbon mitigation measures rather than being additional. Moreover, the climate mitigation literature indicates that the adoption of clusters of carbon reduction and removal technologies and solutions will be required (Ceppi, Citation2006; IPCC, Citation2018; Pacala & Socolow, Citation2004).
Claims of mitigation deterrence amongst individuals and organizations (e.g. via moral hazard) from adopting VCOs have been made without supporting data (e.g. Anderson, Citation2012; Canzi et al., Citation2006; Koberstein & Applegate, Citation2021). Some have suggested that claims of mitigation deterrence may themselves reduce climate mitigation action (Jebari et al., Citation2021). Others claim that adopting technologies to remove CO2 from the atmosphere, which could overlap with VCOs, may increase the adoption of other mitigation efforts (Reynolds, Citation2014). This is consistent with diffusion of innovation theory – which suggests that the adoption of one innovation (technology, idea or behaviour perceived as new by adopters) may trigger co-adoption of a cluster of associated innovations, increasing adoption outcomes (Rogers, Citation2003, p. 249). Associated innovations are understood by adopters as mutually supportive and inter-dependent (Carmichael et al., Citation2021).
These seemingly opposing views may not be mutually exclusive, and other psychological or sociological processes may influence behaviour. Amongst individuals, moral licensing, for example, seems plausible, whereby adoption of one pro-environmental behaviour decreases the likelihood of subsequent pro-environmental behaviours (Gholamzadehmir et al., Citation2019). Experiments found that individuals learning about carbon offsets reduced support for carbon mitigation measures in one study (Campbell-Arvai et al., Citation2017), and caused rebound behaviours in another, but that the rebound effect was corrected by information about the possibility of rebound effects (Günther et al., Citation2020). This self-correction is unsurprising given that individuals have strong preferences to remain consistent with their self-image, goals and prior behaviours (Locke & Latham, Citation2019). However, individuals’ ‘preference for consistency’ is not universally equal which leads to variability in outcomes (Brown et al., Citation2005; Guadagno et al., Citation2001).
At the organizational level, consistency over time is highly valued to help brand recognition (Beverland et al., Citation2015), and many use targets and theories of change to set, monitor and evaluate intended outcomes (Arensman et al., Citation2018; Hestres, Citation2015; Salazar et al., Citation2019). However, research into the effects of organizations adopting VCOs on other carbon management strategies is currently lacking.
With opposing claims and theories, variability in behavioural responses, and a paucity of empirical research, the question of whether the adoption of VCOs causes mitigation deterrence at organizational level remains understudied (Markusson et al., Citation2018). Our research tests for differences between adopters and non-adopters of VCOs amongst UK and USA universities, with a focus on three research questions: (1) are there differences in the characteristics of adopters and non-adopters (carbon data reporting, management priorities or policies, institution size and nation)? (2) are there between-group differences in changes in carbon management practices over time? and (3) are there between-group differences in carbon footprints and how these change over time?
Universities make a useful study population as they are influential leaders on climate action (Barron et al., Citation2021) and have large carbon footprints (Mitchell-Larson et al., Citation2020). Universities also influence climate science and policy fora, for example through university academics authoring IPCC reports. Additionally, many universities have carbon management and reduction strategies and net zero targets (Chadwick, Citation2016; Idundun et al., Citation2021); they also have a date by which they aim to balance carbon emissions with equivalent carbon removals or off-setting (Thomson et al., Citation2021) and make their carbon emissions data publicly available (HESA, Citation2021; Second-Nature, Citation2021). Some universities have adopted carbon offsets, providing guidance on the process (Allen et al., Citation2020), while others have rejected carbon offset adoption (Anderson, Citation2012) providing data for both adopters and non-adopters, as required for this study. We emphasize this study population may not reflect wider society or other organizations; for example, customer-oriented organizations that are obliged to publicly report their data may act differently to industrial-based companies (Kotchen & Moon, Citation2012). Therefore, we limit the interpretation of our results to the study population and recommend that research into other populations is undertaken.
Methods
The first step was to develop a survey instrument that would answer the three research questions above. To do this, we identified factors that we hypothesized may relate to the adoption of VCOs that could be measured and analysed to answer our research questions (, with more detail in S2.7). Firstly, this is informed by the diffusion of innovation theory that describes how the characteristics of innovations, potential adopters and the context in which they interact can affect the adoption of innovations (Balas & Chapman, Citation2018; Dearing & Cox, Citation2018; Kuehne et al., Citation2017; Rogers, Citation2003, pp. 36–38; Romero de Diego et al., Citation2021; Simin & Janković, Citation2014). Secondly, the factors in were selected from literature on carbon management in universities (Allen et al., Citation2020; Chadwick, Citation2016; Idundun et al., Citation2021; Malay et al., Citation2014; Tang & Luo, Citation2014; United Nations Environment Programme, Citation2020).
Figure 1. An illustration of the main factors hypothesized in this study that may relate to the adoption of VCOs in universities. This includes universities’ characteristics, carbon management practices adopted and carbon emissions.
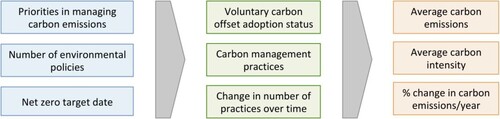
To answer the research questions in turn, we then tested whether universities’ characteristics (including institution size, carbon management priorities, number of environmental policies and net zero target dates), related to the number of carbon management practices adopted (including VCOs), carbon emissions and changes over time. National context was also considered as a potentially influential variable in adoption of innovations (Dearing & Cox, Citation2018) as policies, carbon reporting, electricity grids and social norms may differ between the nations studied.
Sample strategy
The sample strategy was limited a priori to universities in the UK and North America that are subscribed to sustainable education platforms such as EAUC in the UK and Second Nature in the USA. This minimized variability in the sample, as factors such as cultural norms, pro-environmental attitudes and internal capacity to consider environmental issues can influence adoption decisions (Rogers, Citation2003). We also limited the study temporally, to data from 2009 to 2020, to capture the most reliable carbon emissions data. This period pre-dated policies by funders that require carbon emissions from grant-related travel to be offset (e.g. Wellcome, Citation2022). This policy by Wellcome, a global funder of research, will turn the adoption decision of organizations in receipt of such funding from voluntary to compulsory, which follows a different adoption process (Rogers, Citation2003).
Ethics approval was granted by Imperial College London (SETREC 21IC6610) and sampling was undertaken during summer 2022 through a voluntary e-survey sent to university environmental or estate managers. EAUC distributed the survey to UK university members, comprising 60% of UK universities. We emailed over 500 USA universities in the Second Nature and STARs databases (covering 10% and 20% of USA degree-awarding universities, respectively). We posted the survey on USA ‘green schools’ Listserv and the Association for the Advancement of Sustainability in Higher Education (AASHE) advertised the survey to its members. We reached a small number of Canadian universities incidentally. Of the universities who responded, one representative from each university consented to and completed one survey.
Survey
The survey was tested amongst the study population for consistent interpretation and to balance the effort of completing the survey with the adequacy of data gathered. Definitions were provided on page one of the survey to clarify distinctions between VCOs that were counted in the survey and compulsory purchases of Certified Emissions Reductions (CERs), Renewable Energy Certificates (RECs) and green energy tariffs, which did not count as VCOs. Respondents completed a series of multiple-choice and matrix questions, where response options were automatically randomized. Open-box options provided opportunities for respondents to provide greater details about their decision-making choices. The survey measured three sets of variables:
universities’ characteristics, including adoption status; carbon management priorities, environmental policies and net zero targets;
carbon management practices in 2010 and 2020, such as, purchasing renewable energy, and policies to reduce carbon from food or travel; and
gross carbon emissions from 2009 to 2019 (excluding carbon offsets).
Carbon data provided in the survey were augmented and quality-checked against UK Higher Education Statistics Agency (HESA) and Second Nature databases (HESA, Citation2021; Second-Nature, Citation2021), and university size and location gleaned from the same online resources. Consistent with the United Nations Framework Convention on Climate Change (UNFCCC), universities report carbon in three ‘scopes’: scope 1 (direct emissions from owned or controlled sources); scope 2 (indirect emissions from the generation of purchased electricity, steam, heating and cooling); and scope 3 emissions (all other indirect emissions, for example, from business travel and food) (Table S2.1) (Ranganathan et al., Citation2015). Universities are expected to report scope 1 and 2 emissions, and may report some or all scope three emissions, and report only gross carbon emissions, excluding carbon offsets. Therefore, our research is limited to scope 1 and 2 emissions, as scope 3 emissions were not reported adequately. Universities use location-based carbon accounting method which does not account for renewable electricity generated onsite and sold to the grid, or to purchase of renewable electricity, whereas deductions for these are permitted with the market-based carbon accounting (Sotos, Citation2015). Whether universities adopted VCOs was determined through our survey, although we did not need to know how many tonnes of carbon were offset for this study.
Analysis
Data from 106 universities were received and quality checked, and 10 were removed from the sample due to incompleteness or failure to meet criteria set a priori, such as affiliation with a sustainability organization. The final sample analysed (n = 96) included adopters (n = 34) and non-adopters (n = 62) of VCOs. Responses were split across the UK (n = 36), USA (n = 58), and Canada (n = 2). To test whether data from differing nations for adopters and non-adopters could be amalgamated, we tested for associations between adoption status and national context, and found no significant association (Chi-Square 0.595, p = .440, n = 96). Therefore, further analysis was completed using adopters and non-adopters as a binary predictor variable, regardless of nation. To check for bias in our survey population, we compared the proportion of VCO adopters (those adopting VCOs) amongst USA survey respondents (34%) with the Second Nature database for USA universities invited to respond (14%). This indicates self-selection bias, possibly due to the voluntary nature of the survey (Robinson, Citation2013), therefore we limited interpretation of the analysis to the sample and avoided generalizations.
Descriptive analyses provided overall themes and patterns that compared adopters with non-adopters. We explored normality of distribution and homogeneity of variance in the data, and applied non-parametric tests accordingly in SPSS v25. We used Chi-square and Fisher’s Exact test to test for associations between categorical nominal variables, including adoption status and carbon management priorities. We used Welch tests to compare the number of policies, the number of practices and the carbon emissions between adopters and non-adopters.
We used repeated measures ANOVA to test firstly whether the number of carbon management practices, and secondly, carbon emissions, changed between 2010 and 2020. We also tested whether differences over time differed between adopters and similarly matched non-adopters (based on location, size and carbon emissions), with post-hoc G*Power analyses to test confidence levels in the results. We used regressions to test the rates of changes in carbon emissions, and adoption of carbon offsets over time. We used Spearman’s Rho to analyse correlations between how early net zero target dates were (number of years ahead of mandatory 2050 dates for net zero), number of policies and practices, and carbon outcomes, to assess interactions between variables (Motawa & Oladokun, Citation2015). Finally, we coded qualitative data from open-box questions for content analysis, presented below, to understand the direction of correlations and gain a deeper understanding of responses.
Results
Overall, adopters of VCOs had earlier net zero target dates and undertook more carbon management practices, and sooner, than non-adopters. Equivalent or greater emissions reductions were achieved by VCO adopters than non-adopters on the metrics tested. Greater emissions reductions correlated with earlier net-zero target dates, and number of carbon management policies and carbon management practices.
Carbon offsets were adopted by the universities studied at an increasing rate over time (), particularly in the UK (Figure S2.1). Adopters (n = 34) were classified as those who had purchased offsets (n = 16), those who had agreed and planned to purchase offsets (n = 9), and those who had funded or agreed to fund equivalent activities to offset carbon emissions (n = 9) (Figure S2.2). The reasons given for adopting VCO included: addressing emissions that cannot be avoided yet, for example, travel (32%), and to achieve their net zero targets (21%). None said they had adopted VCOs to set earlier net zero target dates. VCOs were also adopted to show leadership, and to support overseas development (e.g. through investment in clean cook-stoves), justice and social benefits to others.
Figure 2. Cumulative number of universities who adopted voluntary carbon offsets over time, with exponential regression line shown (linear regression, y = 1.3926x − 2794.5, R2 = 0.84331) (n = 28).
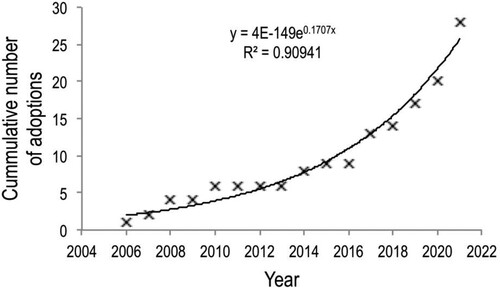
Non-adopters (n = 62) were classified as those who were undecided (n = 53), those who identified as non-adopters in open-box questions (n = 5), and those who rejected carbon offsets (n = 4) (Table S2.2). Some universities who had not decided whether to adopt VCOs reported that funding was a limiting factor, while others reported their current focus was on reducing emissions, and purchasing RECs which are not classified here as carbon offsets. Reasons given for rejecting VCOs were: cost; to focus on on-site reductions; and one held a ‘scientific belief that they do not deliver all that is promised and are a distraction’.
Addressing the first research question, we tested for differences in the characteristics of adopters and non-adopters ( and ). Priorities in managing carbon emissions were not significantly different between groups (Fisher’s Exact test, p = .412). Most respondents prioritized reducing emissions (71%), while none prioritized offsetting emissions alone, although some prioritized both (29%) (Figure S2.3). When asked to explain carbon management priorities, 19% of those who replied (n = 85) mentioned reducing emissions saves money, or funds were not available to purchase VCOs. Both adopters and non-adopters expressed concern about the efficacy of VCOs, but even some non-adopters rated both offsets and emission reductions as priorities, stating VCOs are useful for emissions where reductions were not possible, for example, from travel, which generate scope 3 emissions and not reported by many institutions.
Figure 3. Selection of attributes of adopters (light shading) and non-adopters (dark shading) of voluntary carbon offsets. Only four of eleven attributes tested using Welch tests (see below) show significant differences between adopters and non-adopters at the 95% level (*). (a) shows the mean frequency results for each attribute and 3(b) shows mean scope 1 and 2 carbon emissions in metric tonnes of CO2-equivalent (MT CO2) and mean carbon Intensity (MTCO2/full-time equivalent student), and how these change over time.
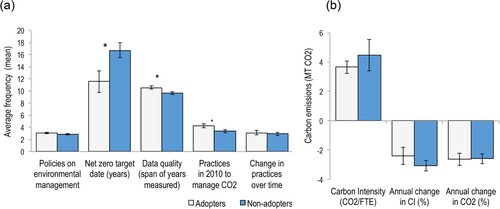
Table 1. Characteristics, practices and outcomes of adopters (n = 34) and non-adopters (n = 62) of voluntary carbon offsets for attributes encompassing respondents’ (a) characteristics and practices to mitigate carbon emissions, and (b) outcomes in terms of carbon emissions.
Further, the number of policies to manage carbon emissions, including accreditation, dedicated staffing and carbon reduction plans (Figure S2.4), was not significantly different between adopters and non-adopters of VCOs (Welch statistic 0.792, df1, p = .376), nor did it relate to institution size (number of full-time equivalent students) (Welch statistic 48.264, df1, p = .338). However, the detail of one of the policies did differ significantly between groups: target dates for achieving net zero for scope 1 and 2 emissions were significantly earlier for adopters than non-adopters (Welch statistic 5.606, df = 1, p = .022) (Figure S2.5). In fact, two adopters had reached net zero by 2018, and another aimed for ‘absolute zero’ (zero carbon emissions, rather than compensating for emissions with offsets) for scope 1 and 2 emissions by 2048. Net zero targets for scope 3 emissions were reported by some adopters and non-adopters (61% and 64%, respectively), some of whom reported scope 3 emissions, but not consistently. Only three respondents reported policies to achieve net negative emissions (carbon removal or offsetting of more than emitted), one VCO adopter and two non-adopters – one of which rejected VCO adoption. The strongest difference between groups was that adopters reported gross scope 1 and 2 carbon data for a longer time than did non-adopters (Welch statistic 7.103, df1, p = .009). There was no significant difference between groups for institution size (Welch statistic, 0.938, df = 1, p = .338), or nation (as described above).
Addressing the second research question of between-group differences in carbon management practices, the number of practices to manage carbon emissions and climate change, including purchasing or generating renewable electricity, and reducing carbon-intensive foods available onsite (Figure S2.6), was significantly greater for VCO adopters than non-adopters. This is apparent in both 2010 and 2020 (Welch test 4.509, p = .037 and 5.608, p = .021 respectively, n = 96). The number of practices increased between 2010 and 2020 significantly for both groups (Wilcoxon Ranked test −8.068, p = <.001), and the increase was not significantly different between groups (Welch test 0.196, p = .660, n = 96) (, Figure S2.7). Analysis of respondents with an adoption date between 2010 and 2020 (n = 10), compared with a group of matched non-adopters (n = 10), also found significant increases in practices for both groups over time, using repeated measures ANOVA (Wilk’s Lambda 0.476, p = <.001; within-subjects effects 52.90, p = <.001). The G*Power (Faul et al., Citation2007) was adequate for this within-subject test (96% chance of correctly rejecting the null hypothesis). Between-subjects effects for adopters and non-adopters were not significant (Type III sums of Squares 14.40, p = .062), indicating no mitigation deterrence post-adoption of VCOs, although confidence was lower in this result due to sample size.
Table 2. Practices to manage carbon emissions and climate change undertaken by adopters and non-adopters of VCO in 2010 and 2020 (%) classified into three carbon emission groups: A, those affecting scope 1&2 emissions which are counted in location-based accounting; B, those affecting scope 1&2 emissions but are not counted in location-based accounting; and C, those affecting scope 3 emissions and are not counted (n/a indicates carbon management strategies which cannot be accounted for with current data).
Considering individual practices separately, we found adopters of VCOs had the greatest adoption of energy efficiency (94%), followed by energy-saving practices (91%) in 2010, rising to close to 100% in 2020. These two practices were also the most prevalent practices for non-adopters, but less so, with greater room for growth over the decade with <80% adoption in 2010, and >95% in 2020 for both practices. Purchase of RECs and generation of renewable electricity was far greater amongst VCO adopters than non-adopters, and rose in both groups over the decade, particularly amongst non-adopters. The largest increase in practices by adopters involved reducing emissions from food (, Figure S2.6). These practices affect scope 1, 2 and 3 carbon emissions reported by universities differently. Therefore, we categorized practices into three groups ():
A, those affecting scope 1 & 2 emissions that are counted in location-based accounting;
B, those affecting scope 1 & 2 emissions but not counted in location-based accounting;
C, those affecting scope 3 emissions and not counted in carbon emissions reports.
Addressing the third research question of whether carbon emissions differed between VCO adopters and non-adopters, and how emissions changed over time, we consider the scope 1 and 2 emissions data. Gross carbon emissions and carbon intensity (scope 1 and 2 without accounting for carbon offsetting) averaged over the decade studied were not significantly different between adopters and non-adopters (Welch test, 0.196, p = .659 and 0.510, p = .477 respectively) (). Also, there were no significant differences between adopters and non-adopters in annual percentage change in gross CO2 emissions (Welch statistic 0.005, p = .942); or carbon intensity (Welch statistic 0.927, p = .340) averaged over the decade.
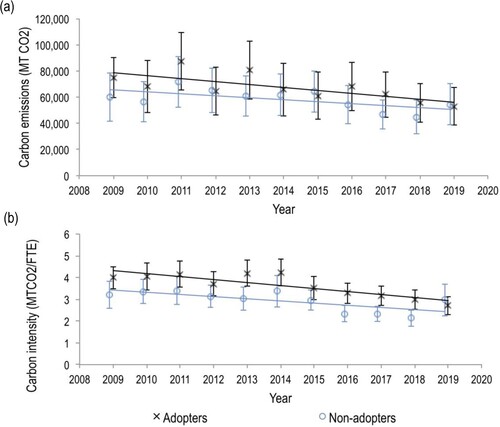
However, regression analysis showed that adopters reduced gross scope 1 and 2 CO2 emissions significantly over time (Spearman’s Rho, −0.745, p = .008), while non-adopters did not (Spearman’s Rho, −0.591, p = .056) (, Table S2.3). Both groups reduced percentage change in carbon intensity (CO2 emissions per full-time equivalent student) significantly over time (Spearman’s Rho, −0.797, p = .002 and −0.645, p = .032, respectively). However, as universities report gross location-based emissions that do not account for some carbon management practices such as exporting renewable electricity to the grid or purchasing renewables from the grid, reductions in emissions may be even greater if measured using market-based accounting, which do take account of these practices. This is especially true for adopters of VCOs, based on their greater co-adoption of these carbon management practices, as described above ().
Figure 4. Mean annual carbon emissions and carbon intensity from 2009 to 2019 for adopters (n = 34) and non-adopters (n = 62) of voluntary carbon offsets. (a) illustrates carbon emissions in metric tonnes (MT) of gross scope 1 and 2 CO2-equivalent (CO2), which adopters reduced significantly over time (Spearman’s Rho, −0.745, p = .008) while non-adopters did not (Spearman’s Rho, −0.591, p = .056). (b) carbon intensity (CI) illustrates MTCO2 per full-time equivalent student (FTE). Both adopters and non-adopters reduced carbon intensity significantly over time (Spearman’s Rho, −0.797, p = .002 and −0.645, p = .032, respectively).
We found country-level differences in the characteristics of the universities studied in the UK and USA and their carbon emissions (Table S2.4). For example, UK universities held more policies, and reported data for longer than did USA respondents (Welch tests 21.680, p = <.001; and 94.003, p = <.001, respectively). UK and USA respondents did not undertake a significantly different number of practices to manage their carbon emissions in 2010. However, UK respondents showed a greater increase in the number of practices over the decade and undertook more practices to manage carbon emissions in 2020 than USA respondents (Welch tests 0.004, p = .952; 22.362, p = <.001; and 23.120, p = <.001, respectively). The mean carbon emissions of UK respondents were significantly lower than their USA counterparts, and UK respondents achieved a greater annual percentage decrease in carbon intensity and gross CO2 over the decade measured (Welch tests 17.075, p = <.001; 14.898, p = <.001; and 8.870, p = .004, respectively). Carbon emissions are influenced by the carbon intensity of electricity supplied via the grid, which varies spatially and temporally, and generally declined over the decade studied (de Chalendar et al., Citation2019; Risner & Sutherland, Citation2021) (Figure S2.9). The proportion of adopters to non-adopters did not differ significantly between nations (Chi-Square value 0.797, p = .372, n94), neither did net zero target dates, or university size (Welch test 2.842, p = .96; and 1.932, p = .168, respectively).
Although adoption status was not significantly related to reductions on most carbon emissions metrics tested, other variables were, including net zero target date and number of carbon management practices in 2020 (, S2.7, ). Across the whole sample (n = 96), the greatest number of significant Spearman’s Rho correlations arose from the number of policies held by universities. The number of policies correlated positively with the number of practices taken in 2010 (Spearman’s Rho coefficient (coef.) 0.224, p = .029) and in 2020 (coef. 0.463, p = <.001) (), and the increase over time (coef. 0.254, p = .013) (, ). The number of policies also positively correlated with the number of years carbon emissions were reported (coef. 0.270, p = .008). The number of policies correlated with lower average carbon intensity (coef. −0.337, p = .001), and greater reductions in both CO2 emissions and carbon intensity over time () (coef. −0.275, p = .007 and coef. −0.344, p = .001, respectively).
Figure 5. Correlations between attributes of the universities sampled and their carbon emissions for all survey respondents (n = 96) to illustrate a selection of significant Spearman’s Rho correlations (), including between (a) number of environmental policies held by universities (not including a policy to offset carbon emissions) and number of practical actions taken in 2020 (p = <.001); (b) net zero target date and % change in CO2/year (p = .024); (c) number of policies in 2020 and mean carbon intensity (p = .001); and (d) changes in the number of practical actions and % change in carbon intensity/year (p = .010).
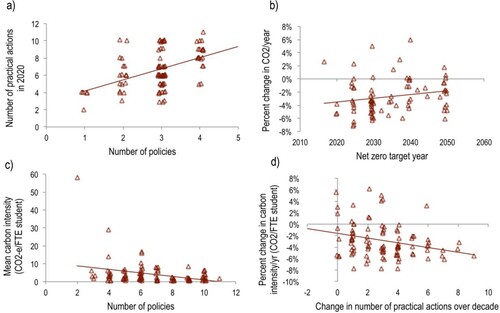
Table 3. Correlations between different attributes of both adopters and non-adopter respondents combined (n = 96) indicating that the number of policies and practices are correlated significantly with each other and with carbon emissions outcomes using Spearman’s Rho correlation in SPSS (2-tailed).
Earlier net zero target dates correlated with lower mean gross CO2 emissions () but not mean carbon intensity (coef. −0.260, p = .020 and coef. −0.219, p = .051, respectively). Earlier net zero target dates also correlated significantly with greater annual percentage reductions in CO2 emissions (coef. −0.252 p = .024) (, (b)). Although cause and effect are not experimentally tested, open-box question responses indicated directionality. For example, an adopter with a net zero target date of 2030 explained
We see it as the responsibility of wealthy institutions and countries to make material reductions in CO2 emissions. It is unsustainable for us to ‘buy our way’ to reduction. Further, we believe that our students have come to understand the difference and expect us to meet a higher standard.
Discussion
Voluntary carbon offsets have been developed to help reduce emissions and remove carbon from the atmosphere, for example through renewable energy provision and afforestation, and each offset relates to one Metric Tonne (MT) of carbon dioxide (1 MTCO2) emissions that are either reduced or removed from the atmosphere (Broekhoff et al., Citation2019). However, differing views exist about the impacts of adopting VCOs on the adoption of other mitigation measures, and consequently on carbon emissions (e.g. Anderson, Citation2012; Jebari et al., Citation2021; Markusson et al., Citation2018; Reynolds, Citation2014). Given net negative emissions are necessary to minimize climate change and net zero targets are widespread, some carbon removal with durable storage is required (IPCC, Citation2023; Jebari et al., Citation2021), which in turn could involve carbon removal-based VCOs. Additionally, under the polluter pays principle, polluters should pay clean-up costs and compensate for damages from carbon emissions (Snyder, Citation2020; Tilton, Citation2016). Yet, possibile ‘mitigation deterrence’ from adopting VCOs remains a concern and is understudied (Markusson et al., Citation2018).
We compared carbon management priorities, policies, practices and emissions of universities who did and did not adopt VCOs. Our finding that both adopters and non-adopters prioritized on-site emissions reductions rather than offsets is consistent with mitigation hierarchies in laws, literature and advice from governments, funders, VCO accreditors and retailers (Allen et al., Citation2020; Ceppi, Citation2006; CNN, Citation2022; EU, Citation2011; Gold-Standard, Citation2019; ICROA, Citation2022; Ulibarri & Han, Citation2022; Wellcome, Citation2022). To formalize mitigation hierarchies in carbon management, some researchers have proposed that VCO should sit within a mitigation hierarchy that includes reducing carbon emissions to as low as reasonably practical (ALARP) using best practicable environmental options (BPEO) (Mitchell-Larson et al., Citation2020). ALARP and BPEO are long-standing environmental protection and pollution management practices (Burgman, Citation2005; Pike et al., Citation2020; Lewis, Citation1988), consistent with environmental pollution and risk management (EU, Citation2004). However, protocols and guidance for reducing carbon emissions to ALARP using BPEO are lacking and warrants further research. With this approach emissions reductions followed by or concurrent with offsetting of hard-to-abate emissions may avoid mitigation deterrence and supports the view that decarbonization should be prioritized over offsetting (Barron et al., Citation2021).
We found adopters of VCOs reported carbon data for longer, had earlier net zero target dates, and undertook more practical actions to manage carbon emissions in both 2010 and 2020 than did non-adopters. An increase in practical actions over the decade studied was similar for both groups. Mean carbon emissions and carbon intensity reductions (in scope 1 and 2 reporting) were similar between adopters and non-adopters. While VCO adopters reduced their gross CO2 emissions over time significantly, the reductions were not significant for non-adopters. However, the percentage annual reduction in carbon intensity over time was significant for both groups, although still greater for VCO adopters. These results therefore do not support claims that adoption of VCOs causes mitigation deterrence (Anderson, Citation2012; Canzi et al., Citation2006; Koberstein & Applegate, Citation2021). Rather, co-adoption of carbon management practices including VCOs was found; indeed VCO adopters undertook significantly more carbon management actions, which is consistent with literature describing the adoption of mutually re-enforcing technology clusters (Carmichael et al., Citation2021; Reynolds, Citation2014; Rogers, Citation2003, p. 249).
One explanatory factor for these results may be that adopters described the adoption of VCOs as relating to pro-social and pro-environmental behaviours (Steg & Vlek, Citation2009; Wittek & Bekkers, Citation2015); in turn, this may protect against moral licensing in some cases (Gholamzadehmir et al., Citation2019). Additionally, VCOs add financial costs that internalize the externalities of carbon emissions to some extent for adopters (Kuhn & Uler, Citation2019). This is the opposite to moral hazard, where costs and risks are placed onto others. The implication is that adopting VCOs follows the polluter pays principle (Munir, Citation2013), in line with academic recommendations (Ibanitoru, Citation2021; Snyder, Citation2020) and environmental law, where polluters have a duty to reduce pollution and pay for clean-up costs and damages (de Sadeleer, Citation2015; EU, Citation2004). These results suggest that the concept of moral hazard, by definition of placing risks and costs onto others (Rowell & Connelly, Citation2012), can be extended to releasing carbon pollution and not paying for this pollution to be removed or compensating those impacted.
Universities currently report location-based carbon accounts, rather than market-based accounts (which allocate emissions reductions differently, for example for purchasing renewable electricity) (Sotos, Citation2015), which can influence perceived carbon emissions reductions and misinform decision-makers (Thomson et al., Citation2021). We found certain carbon management activities that are not counted in location-based accounting were undertaken more by VCO adopters than non-adopters such as generating renewable electricity which may be exported to the grid, and purchasing renewable electricity from the grid. Location-based accounting allocates emissions for all electricity purchased from the grid regardless of whether renewable energy exported to or purchased from the grid, whereas market-based emissions deducts these units from carbon emissions reported (REFs). Thus, there may be systematic under-reporting of emissions reductions, particularly amongst VCO adopters, that may be captured with market-based reporting. This is reminiscent of agricultural life-cycle analysis, water foot-printing and feed conversion efficiency methods where changing methods and metrics can reverse the direction of the results (Gerbens-Leenes et al., Citation2011; Wilkinson, Citation2011; Yang, Citation2017).
The results in this study show that greater numbers of policies and earlier net zero targets correlate with higher numbers of carbon management practices and significantly greater emissions reductions. While this does not prove causation, the results are consistent with theories of change underpinning many advocacy and campaign strategies (Arensman et al., Citation2018; Hestres, Citation2015; Salazar et al., Citation2019). Literature also indicates that policies and targets increase the adoption of practices with intended outcomes (Locke & Latham, Citation2019; Rogers, Citation2003). We emphasize, however, that our results relate to the study population of universities, i.e. organizations with formal processes for setting targets, monitoring and evaluating, which may act differently to industrial-oriented companies that are less consumer-facing and do not publicly report environmental performance (Kotchen & Moon, Citation2012). Therefore, these results cannot be generalized other types of organizations.
Limitations and future research
The study population here has been constrained to universities that are affiliated with a national environmental network. It also covers a period dating prior to the Wellcome Trust’s policy requiring universities in receipt of their funding to offset associated carbon emissions. Additionally, the e-survey was voluntary, which is central to ethical good practice but plausibly opens it to self-selection bias (Robinson, Citation2013). Consequently, we have not generalized the results beyond the survey sample. Further research including longitudinal studies and research into other sectors and individuals is thus warranted. Additionally, reporting of market-based emissions data would facilitate research to better understand the mitigation performance of universities or other organizations. Finally, further research into the views of non-adopters who actively rejected VCOs would be useful, for example, to help understand how they plan to meet net zero targets, including net-negative emissions targets.
Conclusions
Amongst universities studied, we found adopters of VCOs measured their carbon emissions sooner and had earlier net-zero target dates than non-adopters. We also found greater co-adoption of carbon management practices amongst VCO adopters. We found variables such as the policies and practices of universities correlated with carbon emission reductions, and that adopters reduced their carbon emissions over time to a similar degree to non-adopters. Therefore, among the universities adopting VCOs studied here, our results suggest that mitigation deterrence, moral hazard and moral licensing were not present, and mitigation hierarchies were used effectively.
However, we conclude that practice and policies to control and remediate emissions, pollution and wastes are relevant but lacking in carbon mitigation. Firstly, waste emissions and risks of impacts should be reduced to as low as reasonably practicable (ALARP) using best practicable options (BPEO). Secondly, polluters must remediate and compensate for their emissions under the polluter pays principle. This may reduce risks of mitigation deterrence and increase effectiveness of carbon mitigation.
Data accessibility statement
Data and code can be accessed online (https://doi.org/10.5281/zenodo.7023154) and can be used under the Creative Commons Attribution License CC BY-NC.
Ethics statement
Ethics approval was granted by Imperial College London: SETREC number 21IC6610.
Supplemental Material
Download MS Word (13.1 MB)Supplemental Material
Download MS Word (26.4 KB)Acknowledgements
The authors are grateful to the following people: Charles Joly, Dave Reay and Dave Newport for feedback on survey questions; Lisa Gecchele, for statistical advice; Noah Lewis-Brown and Sachin Yuvaraj Dinesh Babu for help sourcing email addresses from online public sources; Fiona Goodwin of EAUC, and AASHE for distributing the survey, and Second Nature for providing carbon data.
Disclosure statement
No potential conflict of interest was reported by the author(s).
Additional information
Funding
References
- Allen, M., Axelsson, K., Caldecott, B., Hale, T., Hepburn, C., Hickey, C., Mitchell-Larson, E., Malhi, Y., Otto, F., Seddon, N., & Smith, S. (2020). The Oxford principles for net zero aligned carbon offsetting. Retrieved from Oxford, UK.
- Anderson, K. (2012). The inconvenient truth of carbon offsets. Nature (London), 484(7392), 7-7. https://doi.org/10.1038/484007a
- Arensman, B., van Waegeningh, C., & van Wessel, M. (2018). Twinning ‘practices of change’ with ‘theory of change’: Room for emergence in advocacy evaluation. American Journal of Evaluation, 39(2), 221–236. https://doi.org/10.1177/1098214017727364
- Balas, E. A., & Chapman, W. W. (2018). Road map for diffusion of innovation in health care. Health Affairs, 37(2), 198–204. https://doi.org/10.1377/hlthaff.2017.1155
- Barron, A. R., Domeshek, M., Metz, L. E., Draucker, L. C., & Strong, A. L. (2021). Carbon neutrality should not be the end goal: Lessons for institutional climate action from U.S. higher education. One Earth, 4(9), 1248–1258. https://doi.org/10.1016/j.oneear.2021.08.014
- Beverland, M. B., Wilner, S. J. S., & Micheli, P. (2015). Reconciling the tension between consistency and relevance: Design thinking as a mechanism for brand ambidexterity. Journal of the Academy of Marketing Science, 43(5), 589–609. https://doi.org/10.1007/s11747-015-0443-8
- Broekhoff, D., Gillenwater, M., Colbert-Sangree, T., & Cage, P. (2019). Securing climate benefit: A guide to using carbon offsets. Retrieved from Offsetguide.org/pdf-download/.
- Brown, S. L., Asher, T., & Cialdini, R. B. (2005). Evidence of a positive relationship between age and preference for consistency. Journal of Research in Personality, 39(5), 517–533. https://doi.org/10.1016/j.jrp.2004.07.001
- Burgman, M. A. (2005). Risks and decisions for conservation and environmental management. Cambridge University Press.
- Campbell-Arvai, V., Hart, P. S., Raimi, K. T., & Wolske, K. S. (2017). The influence of learning about carbon dioxide removal (CDR) on support for mitigation policies. Climatic Change, 143(3–4), 321–336. https://doi.org/10.1007/s10584-017-2005-1
- Canzi, G., Kronick, C., & Clough, K. (2006). Joint statement on offsetting carbon emissions – by Friends of the Earth, Greenpeace and WWF-UK. London, UK.
- Carmichael, R., Gross, R., Hanna, R., Rhodes, A., & Green, T. (2021). The demand response technology cluster: Accelerating UK residential consumer engagement with time-of-use tariffs, electric vehicles and smart meters via digital comparison tools. Renewable and Sustainable Energy Reviews, 139, 110701. https://doi.org/10.1016/j.rser.2020.110701
- Ceppi, P. (2006). Developing a Robust carbon offsetting strategy. Retrieved from London, UK: https://prod-drupal-files.storage.googleapis.com/documents/resource/public/Developing A Robust Carbon Offsetting Strategy – REPORT.pdf.
- Chadwick, D. (2016). Carbon management in the higher education sector: A guide to good practice. Retrieved from London.
- CNN, U. (2022). UN climate neutral now guidelines for participation. Retrieved from https://unfccc.int/sites/default/files/resource/CNN Guidelines.pdf.
- Dearing, J. W., & Cox, J. G. (2018). Diffusion of innovations theory, principles, and practice. Health Affairs, 37(2), 183–190. https://doi.org/10.1377/hlthaff.2017.1104
- de Chalendar, J. A., Taggart, J., & Benson, S. M. (2019). Tracking emissions in the US electricity system. Proceedings of the National Academy of Sciences, 116(51), 25497–25502. https://doi.org/10.1073/pnas.1912950116
- de Sadeleer, N. (2015). Preliminary reference on environmental liability and the polluter pays principle: Case C-534/13, Fipa. Review of European, Comparative & International Environmental Law, 24(2), 232–237. https://doi.org/10.1111/reel.12115
- Directive 2004/35/CE of the European Parliament and of the Council of 21 April 2004 on environmental liability with regard to the prevention and remedying of environmental damage, (2004).
- EU Directive on the assessment of the effects of certain public and private projects on the environment. 2011/92/EU C.F.R. (2011).
- Faul, F., Erdfelder, E., Lang, A.-G., & Buchner, A. (2007). G*Power 3: A flexible statistical power analysis program for the social, behavioral, and biomedical sciences. Behavior Research Methods, 39(2), 175–191. https://doi.org/10.3758/BF03193146
- Field, C. B., Barros, V., Stocker, T. F., Qin, D., Dokken, D. J., Ebi, K. L., Mastrandrea, M. D., Mach, K. J., Plattner, G.-K., Allen, S. K., Tignor, M., & Midgley, P. M. (2012). Managing the risks of extreme events and disasters to advance climate change adaptation. A special report of working groups I and II of the intergovernmental panel on climate change. Pp. 1-582.
- Gerbens-Leenes, P. W., Mekonnen, M. M., & Hoekstra, A. Y. (2011). A comparative study on the water footprint of poultry, pork and beef in different countries and production systems. Retrieved from Delft, the Netherlands.
- Gholamzadehmir, M., Sparks, P., & Farsides, T. (2019). Moral licensing, moral cleansing and pro-environmental behaviour: The moderating role of pro-environmental attitudes. Journal of Environmental Psychology, 65, 101334. https://doi.org/10.1016/j.jenvp.2019.101334
- Gold-Standard. (2019). Gold standard for the global goals: Principles and requirements.
- Guadagno, R. E., Asher, T., Demaine, L. J., & Cialdini, R. B. (2001). When saying yes leads to saying no: Preference for consistency and the reverse foot-in-the-door effect. Personality & Social Psychology Bulletin, 27(7), 859–867. https://doi.org/10.1177/0146167201277008
- Günther, S. A., Staake, T., Schöb, S., & Tiefenbeck, V. (2020). The behavioral response to a corporate carbon offset program: A field experiment on adverse effects and mitigation strategies. Global Environmental Change, 64, 102123. https://doi.org/10.1016/j.gloenvcha.2020.102123
- Hansen, J., Sato, M., Kharecha, P., von Schuckmann, K., Beerling, D. J., Cao, J., Marcott, S., Masson-Delmotte, V., Prather, M. J., Rohling, E. J., Shakun, J., Smith, P., Lacis, A., Russell, G., & Ruedy, R. (2017). Young people’s burden: Requirement of negative CO2 emissions. Earth System Dynamics, 8(3), 577–616. https://doi.org/10.5194/esd-8-577-2017
- HESA. (2021). Open data and official statistics. Retrieved from https://www.hesa.ac.uk/data-and-analysis
- Hestres, L. E. (2015). Climate change advocacy online: Theories of change, target audiences, and online strategy. Environmental Politics, 24(2), 193–211. https://doi.org/10.1080/09644016.2015.992600
- Ibanitoru, P. (2021). A critical analysis of the polluter pays principle in international climate change law (Degree of Master of Laws 2020). University of Aberdeen.
- ICROA. (2022). ICROA code of best practice.
- Idundun, E., Hursthouse, A. S., & McLellan, I. (2021). Carbon management in UK higher education institutions: An overview. Sustainability, 13(19), 10896. https://doi.org/10.3390/su131910896
- IPCC. (2018). Summary for policymakers. In: Global warming of 1.5°C. An IPCC special report on the impacts of global warming of 1.5°C above pre-industrial levels and related global greenhouse gas emission pathways, in the context of strengthening the global response to the threat of climate change, sustainable development, and efforts to eradicate poverty. Retrieved from Geneva, Switzerland.
- IPCC. (2023). Summary for policymakers.
- Jebari, J., Táíwò, O. m. O., Andrews, T. M., Aquila, V., Beckage, B., Belaia, M., Clifford, M., Fuhrman, J., Keller, D. P., Mach, K. J., Morrow, D. R., Raimi, K. T., Visioni, D., Nicholson, S., & Trisos, C. H. (2021). From moral hazard to risk-response feedback. Climate Risk Management, 33. https://doi.org/10.1016/j.crm.2021.100324
- Kauppi, P., Sedjo, R., Apps, M., Cerri, C., Fujimori, T., Janzen, H., Krankina, O., Makundi, W., Marland, G., Masera, O., Nabuurs, G.-J., Razali, W., Ravindranath, N. H., Keith, D., Kheshgi, H., & Liski, J. (2001). Technological and economic potential of options to enhance, maintain, and manage biological carbon reservoirs and geo-engineering. Retrieved from https://archive.ipcc.ch/ipccreports/tar/wg3/pdf/4.pdf
- Koberstein, P., & Applegate, J. (2021). Carbon Conundrum: A native Alaskan company’s promise to save its forests benefits local ecosystems, but given the zero-sum game that's carbon offsets, it delays meaningful action on climate change. Earth Island Journal, 35(4), 33.
- Kotchen, M., & Moon, J. J. (2012). Corporate social responsibility for irresponsibility. The B.E. Journal of Economic Analysis & Policy, 12(1). https://doi.org/10.1515/1935-1682.3308
- Kuehne, G. L., Rick, P., David, J., Wilkinson, R., Dolling, P., Ouzman, J., & Ewing, M. (2017). Predicting farmer uptake of new agricultural practices: A tool for research, extension and policy. Agricultural Systems, 156, 115–125. https://doi.org/10.1016/j.agsy.2017.06.007
- Kuhn, K.-U., & Uler, N. (2019). Behavioral sources of the demand for carbon offsets: an experimental study. A Journal of the Economic Science Association, 22(3), 676–704. https://doi.org/10.1007/s10683-018-09601-y
- Lewis, J. (1988). Royal commission on environmental pollution: Twelfth report. H.M.S.O.
- Locke, E. A., & Latham, G. P. (2019). The development of goal setting theory: A half century retrospective. Motivation Science, 5(2), 93–105. https://doi.org/10.1037/mot0000127
- Mach, K. J., Planton, S., & Stechow, C. v. (2014). Annex II: Glossary In: Climate change 2014: Synthesis report. Contribution of working groups I, II and III to the fifth assessment report of the intergovernmental panel on climate change. Retrieved from Geneva, Switzerland.
- Malay, D., Zhonhua, G., Deo, P., & Fengting, L. (2014). Greening University Toolkit V2.0. Retrieved from https://wedocs.unep.org/bitstream/handle/20.500.11822/11964/Greening University Toolkit V2.0.pdf?sequence=1&isAllowed=y
- Markusson, N., McLaren, D., & Tyfield, D. (2018). Towards a cultural political economy of mitigation deterrence by negative emissions technologies (NETs). Global Sustainability, 1. https://doi.org/10.1017/sus.2018.10
- Mascia, M. B., & Mills, M. (2018). When conservation goes viral: The diffusion of innovative biodiversity conservation policies and practices. Conservation Letters, 11(3), 12442–12451. https://doi.org/10.1111/conl.12442
- Mitchell-Larson, E., Green, T., Lewis-Brown, E., Jennings, N., Joly, C., Goodwin, F., Reay, D., Rothman, R., Scott, C., Allen, M., & Forster, P. (2020). How can carbon offsetting help UK further and higher education institutions achieve net zero emissions? COP26 Universities Network Briefing. Retrieved from https://www.gla.ac.uk/media/Media_770459_smxx.pdf
- Motawa, I., & Oladokun, M. G. (2015). Structural equation modelling of energy consumption in buildings. International Journal of Energy Sector Management, 9(4), 435–450. https://doi.org/10.1108/ijesm-11-2014-0004
- Munir, M. (2013). History and development of the polluter pays principle. SSRN Electronic Journal. http://doi.org/10.2139/ssrn.2322485
- Pacala, S., & Socolow, R. (2004). Stabilization wedges: Solving the climate problem for the next 50 years with current technologies. Science (American Association for the Advancement of Science), 305(5686), 968–972. https://doi.org/10.1126/science.1100103
- Pike, H., Khan, F., & Amyotte, P. (2020). Precautionary Principle (PP) versus As Low As Reasonably Practicable (ALARP): Which one to use and when. Process Safety and Environmental Protection, 137, 158–168. http://doi.org/10.1016/j.psep.2020.02.026
- Ranganathan, J., Corbier, L., Bhatia, P., Schmitz, S., Gage, P., & Oren, K. (2015). The greenhouse gas protocol: A corporate accounting and reporting standard. Retrieved from Washington, USA: https://ghgprotocol.org/corporate-standard
- Reid, P. C., Fischer, A. C., Lewis-Brown, E., Meredith, M. P., Sparrow, M., Andersson, A. J., Antia, A., Bates, N. R., Bathmann, U., Beaugrand, G., Brix, H., Dye, S., Edwards, M., Furevik, T., Gangstø, R., Hátún, H., Hopcroft, R. R., Kendall, M., Kasten, S., … Washington, R. (2009). Chapter 1 Impacts of the oceans on climate change. In D. W. Sims (Ed.), Advances in marine biology (Vol. 56, pp. 1–150). Academic Press.
- Reynolds, J. (2014). A critical examination of the climate engineering moral hazard and risk compensation concern. The Anthropocene Review, 2(2), 174–191. https://doi.org/10.1177/2053019614554304
- Risner, J., & Sutherland, A. (2021). Static grid carbon factors – can we do better? Building Services Engineering Research and Technology, 42(3), 257–277. https://doi.org/10.1177/0143624421991964
- Robinson, O. C. (2013). Sampling in interview-based qualitative research: A theoretical and practical guide. Qualitative Research in Psychology, 11(1), 25–41. https://doi.org/10.1080/14780887.2013.801543
- Rogers, E. M. (2003). Diffusion of innovations (5th ed.). Free Press.
- Romero de Diego, C., Dean, A., Jagadish, A., Witt, B., Mascia, M. B., & Mills, M. (2021). Drivers of adoption and spread of wildlife management initiatives in Mexico. Conservation Science and Practice, 3(7). https://doi.org/10.1111/csp2.438
- Rowell, D., & Connelly, L. B. (2012). A history of the term ‘moral hazard’. The Journal of risk and insurance, 79(4), 1051–1075. https://doi.org/10.1111/j.1539-6975.2011.01448.x
- Salazar, G., Mills, M., & Verissimo, D. (2019). Qualitative impact evaluation of a social marketing campaign for conservation. Conservation Biology, 33(3), 634–644. https://doi.org/10.1111/cobi.13218
- Second-Nature. (2016). Carbon markets and offsets guidance. Retrieved from Boston, USA: https://secondnature.org/wp-content/uploads/Carbon-Markets-and-Offsets-Guidance-1.pdf
- Second-Nature. (2021). Second nature reporting platform. Retrieved from https://reporting.secondnature.org/.
- Simin, M. T., & Janković, D. (2014). Applicability of diffusion of innovation theory in organic agriculture. Journal of the Economics of Agriculture, 61(2), 517–529.
- Snyder, B. F. (2020). Beyond the social cost of carbon: Negative emission technologies as a means for biophysically setting the price of carbon. Ambio, 49(9), 1567–1580. https://doi.org/10.1007/s13280-019-01301-y
- Sotos, M. (2015). GHG protocol scope 2 guidance. Retrieved from USA.
- Steg, L., & Vlek, C. (2009). Encouraging pro-environmental behaviour: An integrative review and research agenda. Journal of Environmental Psychology, 29(3), 309–317. https://doi.org/10.1016/j.jenvp.2008.10.004
- Tang, Q., & Luo, L. (2014). Carbon management systems and carbon mitigation. Australian Accounting Review, 24(1), 84–98. https://doi.org/10.1111/auar.12010
- Thomson, I., Tuck, P., Channuntapipat, C., Charnock, R., O’Bonsu, N., & TyreeHageman, J. (2021). Net Zero Accounting for a Net Zero UK. Retrieved from Birmingham UK.
- Tilton, J. E. (2016). Global climate policy and the polluter pays principle: A different perspective. Resources Policy, 50, 117–118. https://doi.org/10.1016/j.resourpol.2016.08.010
- Ulibarri, N., & Han, D. (2022). NEPA and climate change: Consideration of climate mitigation and adaptation in infrastructure review processes. Environmental Research: Infrastructure and Sustainability, 2(1), 1. https://doi.org/10.1088/2634-4505/ac5006
- UNFCCC. (2022). Climate Neutral Now Brochure. In UNFCCC (Ed.). http://climateneutralnow.org (Vol. 1, pp. 2). https://unfccc.int/climate-action/climate-neutral-now: UNFCCC.
- United Nations Environment Programme, G. a. B. I. T. (2020). The little book of green nudges: 40 nudges to spark sustainable behaviour on campus. Retrieved from Nairobi and Arendal.
- Wagner, G., & Zizzamia, D. (2022). Green moral hazards. Ethics, Policy & Environment, 25(3), 264–280. https://doi.org/10.1080/21550085.2021.1940449
- Wathern, P. (1992). Environmental impact assessment: Theory and practice (P. Wathern, Ed.). Routledge.
- Wellcome. (2022). Carbon offset policy for travel. Retrieved from https://wellcome.org/grant-funding/guidance/carbon-offset-policy-travel.
- Wilkinson, J. M. (2011). Re-defining efficiency of feed use by livestock. Animal, 5(7), 1014–1022. https://doi.org/10.1017/S175173111100005X
- Wittek, R., & Bekkers, R. (2015). Altruism and prosocial behavior. In J. D. Wright (Ed.), International encyclopedia of the social & behavioral sciences (2nd ed.) (pp. 579–583). Elsevier.
- Woo, J., Fatima, R., Kibert, C. J., Newman, R. E., Tian, Y., & Srinivasan, R. S. (2021). Applying blockchain technology for building energy performance measurement, reporting, and verification (MRV) and the carbon credit market: A review of the literature. Building and Environment, 205, 108199. https://doi.org/10.1016/j.buildenv.2021.108199
- Yang, Y. (2017). Rethinking system boundary in LCA – reply to ‘Lifting the fog on the characteristics and limitations of hybrid LCA’ by Thomas Gibon and Thomas Schaubroeck (2017). The International Journal of Life Cycle Assessment, 22(6), 1009–1011. https://doi.org/10.1007/s11367-017-1295-x