
ABSTRACT
As an instrument supporting the realization of EU climate neutrality targets by 2050 and encouraging decarbonization outside its borders, the current proposed Carbon Border Adjustment Mechanism (CBAM) is facing opposition from some countries. Focusing on Brazil, this paper evaluates the impacts of the CBAM on the Brazilian economy through a comprehensive analysis of various scenarios based on the potential EU implementation of the CBAM and Brazil’s climate scenarios. Results obtained in this research alleviate concerns of detrimental and competitiveness losses from Brazilian industries. Rather, the implementation of the EU CBAM improves the trade balance of Brazil’s Energy-Intensive Industries (EII). The relatively low CO2 contents of Brazilian EII are elemental to this result, while contributions of carbon-free technologies in electricity generation are also critical factors in maximizing this trade surplus. Other consequential factors affecting these results are the contributions of CO2 removal from Brazil’s forestry of land used, and homogeneity of CBAM-imposed products.
Key policy highlights
Relatively lower CO2 intensity of Energy-Intensive Industries (EII) in Brazil leads to a benefit of a trade gain when the EU CBAM is implemented.
Collective implementation of CBAM involving the US and China increases Brazil's gain and creates more than 160,000 jobs in Brazilian EII.
Nevertheless, the overall macroeconomics shows adverse impacts in Brazil with a significant welfare cost per inhabitant.
Brazil's commitment to carbon neutrality in 2050 and its participation in a climate club with the EU, China and the US economies still benefits EII.
The land use sector matters to managing the costs of mitigation and CBAM implementation; with a lower contribution from the land-use sector, a significant additional cost will occur.
1. Introduction
To support the ongoing efforts to achieve climate neutrality targets by 2050, the European Parliament and the Council have agreed to implement the Carbon Border Adjustment Mechanism (CBAM). This upcoming policy instrument aims to facilitate a new EU-emissions reduction target of 55%, from the 1990s level, by 2030 and carbon neutrality by 2050, by supporting the transition to stop free allowances under the EU-Emissions Trading System (ETS). Its implementation mirrors the EU ETS, implying this mechanism will be applied to all products under the ETS likely as an import tariff. The initial proposal includes the power sector and the Energy Intensive Industries (EII) of cement, steel, aluminium and fertilizer. This is a significant landmark for the EU to impose a fair carbon price that further reduces leakages and encourages a reciprocity, a more significant abatement effort in non-EU countries (Clora et al., Citation2023).
Following its commencement plan by 2025, some countries, mostly EU trading partners, publicly exposed opposition against the imposition of the EU CBAM (Fleming & Giles, Citation2021). Brazil, China, India, and South Africa formally communicated their strong opposition to the CBAM at the end of their April 2021 BASIC group meeting on climate change (Dadush, Citation2021; South African Government, Citation2021; Venzke & Vidigal, Citation2022). Some studies also show that the imposition of CBAM-like measures will be particularly challenging for developing countries (Zhang, Citation2010), despite the relative risk from the EU CBAM varying based on countries’ exports.
This paper focuses on Brazil, where the EU is among the top 3 major trading partners with 15% of Brazilian CBAM-related exports. Being one of the largest reserves of high-quality ore (Hebeda et al., Citation2023), iron and steel production are important, accounted 3% of Brazil's GDP with 62% of national production for export. As for Brazilian aluminium, the EU represents 9% of the total exported worldwide. This potential risk of export exposure (Zhong & Pei, Citation2022), a disproportionate burden and export impediment resulting from the CBAM, and issues of lack of competitiveness in supplying high-value-added and technological products (Feijó & Kuik, Citation2018) become the main cause of Brazil opposition.
Concerns about the EU CBAM are also relevant, following Brazil’s insufficient and less stringent mitigation commitment expressed in the recent Nationally Determined Contribution (NDC) targets than it initially submitted in 2016. Brazil’s contributions to global emissions cannot be neglected, but carbon pricing still has not been integrated into its abatement and long-term climate strategy (Moz-Christofoletti & Pereda, Citation2021). Potential distributional issues remain the constraint (Garaffa et al., Citation2021), covering up the effectiveness of carbon tax policy to reach the medium environmental target. An exemption from the EU CBAM is possible but unlikely. The proposal only notes that the EU should support less developed countries (LDCs), which by definition should exclude Brazil. Given these factors, the EU CBAM implementation on Brazilian products is likely inevitable.
Since the distribution of the EU-CBAM impacts across the globe is likely uneven (Eicke et al., Citation2021), it is important to develop an analysis of the developing country's point of view to understand to what extent domestic economies of countries with different productive structures and emissions profiles will be affected. While literature discussing the EU CBAM impacts on BASIC has mostly focused on the negative effect on China (eg. Li and Zhang (Citation2012), Qi et al. (Citation2022) and Lin and Zhao (Citation2023)), quantitative analyzes of how the EU CBAM impacts Brazil is minimal. A recent study by Magacho et al. (Citation2023) finds that the impact may be insignificant as the EU is not the primary market for Brazil's industry, but the EU CBAM stimulates other developed countries to adopt similar measures. Taking this potential adoption into account, Brazil becomes one of the most exposed countries, making the concept of Brazil implementing CBAM alongside other countries (i.e. as part of climate clubs) relevant.
This paper aims to capture this and comprehensively analyze the EU CBAM implementation in the Brazilian economy and industries. It starts by quantifying the impacts of the EU CBAM on Brazil's EII's production and trade balance, along with the macroeconomic impacts on GDP and welfare. The analysis is then based on developing relevant scenarios of the potential EU CBAM imposition and Brazil's climate strategies, including joining other countries implementing CBAM. The objective is to evaluate Brazil's bargaining position within the EU CBAM.
In providing an overview of Brazil’s position and its recent abatement targets, the following Section 2 outlines Brazil’s mitigation targets. The initial assessment of the exposure of its exports and understanding of the EU CBAM implementation is also discussed in this section. Section 3 details the modelling approach and different scenarios development, followed by the analysis of these simulations. Results are described in Section 4.
2. Brazil: mitigation targets, exports share, and perspective of the EU-CBAM
2.1 Mitigation targets
As a country with significant emissions (World Resources Institute, Citation2017) and population (World Bank, Citation2017), the cornerstone of Brazilian NDC is agriculture, forest and land use (Köberle et al., Citation2020). Brazil's substantial emissions are contributed by deforestation (Boden et al., Citation2009; Friedlingstein et al., Citation2019), with carbon removals in Land Use, Land-Use Change and Forestry (LULUCF) playing an increasingly important role in reducing emissions and achieving its NDC.
Brazil NDC was last updated in March 2022, which revisited Brazil's short-term climate ambitions and updated them to below 50% of the 2005 levels by 2030 (UNFCCC, Citation2022). Absolute emissions (excluding LULUCF) in 2030 is 962 MtCO2eq (58% above 1990, or −4% below 2010). Brazil has also indicated the aim to reach climate neutrality by 2050, but it does not provide any details in this regard. Contributions of carbon removal set for LULUCF remain unspecified (Wiltshire et al., Citation2022) because of complexities and uncertainties in quantifying Brazil's historic land-use emissions and removals. Difficulties in estimating the potential mitigation of the natural and undisturbed carbon sink also aggravate Brazil's indecisiveness regarding this issue.
As the current EU CBAM does not envision covering products associated with these land-used types of emissions, such as those from agriculture, we opted to focus the analysis on the sectoral and nationwide effects of the EU CBAM on Brazil. And in fact, the industrial sector is key to the Brazilian economy and responds to 32.1% of the national energy consumption (BEN, Citation2022), with energy-intensive industries accounting for 6.4% of the total Brazilian emissions. CBAM sectors were responsible for 55 million tonnes in 2020, considering both fuel combustion derived (14%) and industrial process emissions (86%). Yet, Brazil's strategy detailing their initially pledged commitments for their industrial sectors’ transit towards a low-carbon pathway also lacks details (Santos et al., Citation2019), and the new NDC still excludes the reference to implementing sectoral mitigation actions.
2.2. The EU CBAM on Brazil: export exposure and inimical concern
Focusing on the EII, Brazil’s share of exports to the EU is the smallest in the BASIC group.Footnote1 Brazil’s share of the overall EU imports of EII goods (excluding EU intra-regional trade) is only 1.46%, the lowest compared to China (14.98%), India (3.08%) and South Africa (2.05%). This export share, however, is the highest in the Latin America region (a), indicating the EU’s preference and significance of the EU markets for Brazilian industries. The EU spent more than € 3 billion on Brazilian iron imports in 2017 (Eurostat, Citation2018), despite perilous safety standards and extensive deforestation driven by mining (Sonter et al., Citation2017). The EU is an important partner of Brazil, and there are specific interests on the part of the country (da Silva & Volpato, Citation2022).
Figure 1. a. Share of the EU Imports of EII from Central and South America Region; b. Exports Exposure and Vulnerability Risk: BASIC Countries and Russia.
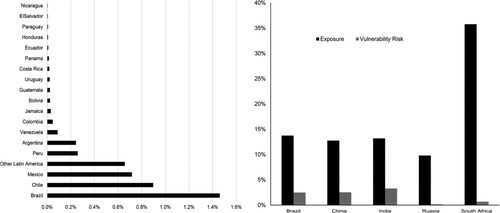
Following the CBAM assessment risk index by Overland and Sabyrbekov (Citation2022), Brazil’s opposition index is not among the top of the overall EU trading partners. However, it is still the highest compared to countries in Central and South America regions. In line with this, our previous assessment of countries’ exposure and vulnerability risks of the EU CBAM corroborates these results (Perdana & Vielle, Citation2022).Footnote2 Exposure to CBAM measures how significant the EII trade to the EU is for the national economy. The degree of Brazil’s exposure lies at 13.75% (b). This is not the highest among all developing countries, yet slightly higher compared to China (12.76%) and India (13%). Brazil’s vulnerability risk, on the other hand, is rather small (2.49%). This number reflects the diversity of Brazilian export destinations. Export to the EU only holds a small percentage relative to the worldwide export.
Although the CBAM proposal briefly refers to the Common But Differentiated Principles & Respective Capabilities (CBDP-RC), there are hardly any signs that the EU would differentiate between foreign producers on the basis of the country of origin (Venzke & Vidigal, Citation2022). In addition to this, the EU’s central role in global mitigation tends to see other large emitters as perpetuating hierarchical Euro-centric relations and never projects them as an equal partner (Sandrin & Ribeiro Hoffmann, Citation2019). It is difficult to imagine that the largest emitters, including Brazil whose exports of affected products to the EU represent a tiny fraction of the total, would be prompted to change course on carbon policies because of the EU’s CBAM (Dadush, Citation2021).
Brazil’s perspective towards the implementation of the EU-CBAM tends to be negative, with concerns about the harm it will cause. The carbon border tax is seen as having potential for discrimination, protectionism and violation of international rules, with the greater concern about Brazil’s steel and iron exports (Moreira, Citation2021). The United Nations Conference on Trade and Development (UNCTAD) estimated that Brazilian steel could have to pay a tax of US$ 3.3 per tonne, which increases costs for exporters. With almost US$ 2 billion of exports to the EU market, Brazil is estimated to be the eighth most vulnerable country to the tax (Moreira & Murakawa, Citation2021). But this estimation seems limited compared to UNCTAD's estimation to other partners, indicating CBAM implications will be rather limited on Brazil's economy.
The impacts may be different if the EU does join a coalition in implementing CBAM. As the amount of CBAM deduces from the current carbon price applied in the country of origin, it stimulates EU partners to adopt similar carbon price mechanisms. Considering this political consequence, Brazil could be the most exposed country following its significant exports to North America, particularly the USA (Magacho et al., Citation2023). Further questions lie on implications for Brazil should the EU form a climate club along with its trading partners, and if Brazil should join the coalition. The carbon intensity of the Brazilian energy mix is fairly low, where renewables hold a substantial share of 83% of power generation, with 64% from hydropower and a significant use of biofuels (Grottera et al., Citation2022). This low per-capita energy-related GHG emissions (and considerably low deforestation rate) might be the motivation to join the climate club, but Brazil still faces challenges in building low energy practices within decarbonization strategies (La Rovere, Citation2017).
This gives Brazil a unique position; thus, scrutinizing each potential implementation option for the CBAM is important for Brazilian policymakers. The carbon intensity of Brazil is critical in evaluating the implication of CBAM, as it becomes the basis of emissions content calculation methods of the tax imposition. It follows that the scale of impacts will be conditional upon the CBAM calculation methodology of these emissions contents and countries’ carbon intensity profile in their EII production. To fill gap in literature quantifying these different scales of impacts, this paper develops relevant scenarios of EU-CBAM and analyzes how different methods of calculating emissions contents or imposition design will impact the Brazilian economy.
3. Modelling approach, scenarios, and results
A critical aspect of determining the impact of CBAM is the methodology of calculating emissions content. Following Cosbey et al. (Citation2019), there are three categories or scopes of emissions. Carbon contents could be based on either direct emissions from fuel combustion within the sector boundary (scope 1), direct emissions plus the CO2 content of electricity consumed by the sector or indirect emissions associated with energy use (scope 2), or direct emissions and any indirect production-related emissions including all the CO2 content of intermediate consumption by the sector (scope 3). Methodologies for calculating these emission contents are detailed in the Supplementary Materials for this paper.
The final details of the CBAM are still under negotiation. The initial public consultation of the European Commission (Citation2021) is considered to compute the carbon content from scope 1. While discussions among the European Parliament, the European Commission and the Council of the European Union tend towards scope 2, which includes not only direct emissions but also those that are included in electricity generation (European Parliament, Citation2021). The latest proposal of the European Parliament (Citation2022), however, has re-proposed that the EU CBAM would only be applied, based on direct emissions (scope 1) to ensure administrative simplicity (European Parliament, Citation2022). Yet for a comprehensive analysis, scenario development in this paper covers all three emissions contents of CBAM, assuming EU CBAM will be applied as an import tariff. All impacts made by these climate policies, including scenarios with these various implementations of CBAM, are measured relative to a reference scenario, which is based on the current policies per region.
In general, quantitative analysis of CBAM uses Computable General Equilibrium (CGE) as its features are widely adaptable to address mitigation policies and fit to perform international trade analysis (Branger & Quirion, Citation2014). The related carbon leakage issues have been addressed mostly by CGE models such as Mattoo et al. (Citation2009); Antimiani et al. (Citation2013); Fouré et al. (Citation2016); Böhringer et al. (Citation2017, Citation2021) and our latest analysis of Perdana and Vielle (Citation2023). For this analysis, we use the latest modification of a model of GEMINI-E3 (Bernard & Vielle, Citation2008), yet focusing more on international trade analysis and economic impact on Brazil. Details of GEMINI -E3 model is in Appendix A of the Supplementary Materials.
3.1. Reference: current policies scenario
This scenario includes a subset of the high-impact policies collected and analyzed over the period 2015–2030 (detailed in Supplementary Material Appendix C). For the EU, the current policies scenario assumes that its previous NDC commitment is implemented. The EU climate target follows the Climate and Energy Framework of a −43% emissions decrease with respect to 2005 for ETS and the −30% for non-ETS emissions in 2030. These two carbon prices are then assumed to rise in line with GDP per-capita rates until 2040. For other countries, the current policies scenario considers a subset of climate and energy policies mainly related to renewables. GEMINI-E3 projects a reduction in CO2 emissions for Brazil over the period 2015–2040 of around 11%, comparable to those calculated in Sognnaes et al. (Citation2021) by the ICES-XPS and MUSE models.
3.2. Scenario of European climate policy without CBAM
The scenario design now integrates the EU ‘Fit for 55’ package and incorporates carbon neutral targets in 2050 by adjusting the abatement target in precedent years. This new stringent policy results in a higher EU ETS price, from approximately € 80 per tonne of CO2 in 2040 (European Commission, Citation2021) to US$ 132 in 2040. The Fit for 55 package negatively impacts the European GDP, which is estimated to fall by 3.6% by 2040. The European EII production is estimated to fall by 13.8% by 2040. The output production decreases by 5.5% and import increases by 13.9% by 2030. Results of these scenarios from a European perspective are detailed in our earlier study (Perdana & Vielle, Citation2022).
Simultaneously, the EU Fit for 55 policy will have a significant impact on the Brazilian EII (). Brazil’s EII exports decrease by 21.6% in 2040, while imports fall by 22.7% compared with the reference scenario. The new European policy negatively impacts the global trade of these commodities by 14%, and it induces a reallocation of international trade that benefits Brazil. The sectoral trade balance of EII is improved by US$2014 9,990 million, half of this trade surplus comes from Europe. The increase in the ETS price deteriorates the competitiveness of European goods and reduces Brazilian imports from the EU by 35%, while Brazilian exports to the EU are reduced by only 13%. Brazil also improves its trade balance with all other trading partners except China. Nonetheless, the impact on Brazil’s production is rather limited, increasing by only 1.7%, which allows the creation of 71 thousand jobs. CO2 emissions from EII increase by 2 MtCO2 eq.
Table 1. Main Results of the Brazilian Economy and Energy Intensive Industries – Year 2040 (in % with respect to the Current Policies Scenario).
The impact on the Brazilian GDP is negligible, around 0.04%. The average household consumption significantly decreases by 0.87%, due to the negative terms of trade effect. The European policy sequentially induces an increase in European and worldwide prices. This change in terms of trade effect decreases welfare, which is equal to 0.86% of household consumption.
3.3. Scenarios of European climate policy with CBAM
The Climate Policy Scenario is then developed by introducing CBAM with its three different methods of calculating emission contents. Results are listed in the same , which surprisingly reveals no significant impact on Brazil’s EII. In fact, quite the opposite, the production slightly increases once CBAM is implemented using scope 2. Trade balance to the EU increases from US$2014 5,648 to 7,331 million using scope 1, and US$2014 10,393 million with scope 2 (see Table D.1 Appendix). This improvement likely indicates lower emissions intensity in Brazil’s EII production, particularly for electricity.
In comparison with other countries, only Brazil experiences such an improvement (a). Russia, India, Africa and China face a significant deterioration of their trade balances after the implementation of CBAM. The other regions/countries are less affected, but their trade balances in EII goods still deteriorate.
Figure 2. a. Change in EII trade balance in % of trade transactions∗ when CBAM scope 2 is implemented, with respect to a scenario without CBAM – year 2040 (∗trade transactions = imports + exports of EII commodities); b. CO2 content in 2025 with respect to the EU (EUR = 100).
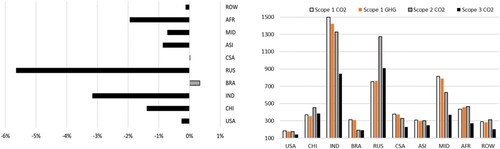
The improvement in Brazil’s trade surplus inarguably lies in the CO2 content of Brazilian EII relative to other regions. As seen in b Brazilian carbon contents are rather low in comparison to other countries. As a consequence of implementing the EU CBAM, Brazil’s EII commodities become more competitive, and increasing their exports compared to the absence of CBAM. Meanwhile in the EU, CBAM raises the prices of domestically produced EII commodities (due to the high level of imported intra intermediate consumption), thus lowering the European exports to Brazil. Nonetheless, the EU CBAM implementation still negatively impacts Brazil’s overall trade balance with other main partners, apart from the USA and Central and South America (CSA). The EU CBAM also increases the Brazilian welfare cost from 0.86% to 0.92% due to the increasing negative terms of the trade effect.
The competitiveness of Brazil’s EII is mainly due to the low CO2 emissions level generated by Brazilian electricity. Electricity is mainly produced from carbon-free technologies, which makes switching from scope 1–2, clearly a matter affecting Brazil's EII competitiveness and understanding of the EU-CBAM. Using scope 3, however, does not provide any substantial changes relative to scope 2.Footnote3
Despite not foreseeing CBAM generating any subsidies for European exports, we extend the scenario of the EU imposition as both import tariff and export subsidy at the CO2 content level using scope 2. Again, our estimated results for Brazil do not significantly change. This scenario aims to improve the European industries by boosting their exports to other regions, but the impacts are evidently moderate, confirming the results found with the same model in Perdana and Vielle (Citation2023). The EU exports are 49.7% lower relative to the reference scenario when CBAM is implemented on imports, and 46.5% lower when export subsidies are also added. Export subsidies do not compensate for the increase in production costs resulting from the adoption of more energy-efficient technologies. For Brazil, this leads to a lower performing trade balance in EII goods with the EU, compared to the scenario of CBAM only applied on imports. The Brazilian trade surplus with the EU decreases by US$ 458 million (9,936–10,393).
The last extended scenario is the EU exemption policy to the LDCs, aiming to limit the burden of CBAM. This is one of the potential complementary policies that the EU may consider to achieve a sensibly designed CBAM (Bellora & Fontagné, Citation2022), which was analyzed in our previous works (Perdana & Vielle, Citation2022). Under this scenario, the EU implements CBAM with scope 2, but exempts India, aggregated regions of Africa, the rest of Asia, and Central and South America. The results prove that exempting LDCs will limit the improvement in Brazilian firms compared to the absence of such exemptions (only with respect to scope 2 scenario). Brazil’s trade surplus to the EU is reduced to US$2014 6,375, as now LDCs are more competitive and increase their exports to the EU. Following LDCs’ escalation in production, they also increase their imports from Brazil. This improves the Brazilian trade surplus to these LDCs and offsets losses in exports to the EU.
3.4. Scenario with a climate club
Climate club scenarios show the potential impacts if climate action is collectively implemented. For CBAM, such a coalition is feasible, given the opportunity for coordination with the affected regions remains open in the EU legislative proposal. Allying as part of a climate club has been widely discussed and subject to many policies-related analyzes (e.g. Nordhaus, Citation2015). The potential EU coalition relevant to Brazil should involve the North American regions as an essential partner for the county in CBAM products. As regional aggregation in our model limits this option, the US is chosen as a potential country to be in a coalition with the EU. The club also includes China, given its commitment to a more stringent climate approach to reach climate neutrality. The climate clubs of the EU, the US, and China has geopolitical advantages (Helm et al., Citation2012; Perdana & Vielle, Citation2023) that may potentially stimulate other developed countries to adopt the same scheme (Magacho et al., Citation2023) and universal climate abatement (Perdana & Tyers, Citation2020).
The two last columns of show the results of these scenarios. If we assume that the climate policy is implemented by a group of countries, this amplifies the gains in competitiveness of the Brazilian EII whose production increases by 4.1%. The balance of trade in these goods is improving not only with the EU but also with the US and China. When the club sets up a CBAM, we find a mechanism similar to that found in the case of a unilateral European climate policy where Brazil's trade balance in these goods is improving vis-à-vis club members. The production increases by 4% and the gains in terms of employment amount to 154,000 jobs. GDP increases by 0.18% but welfare decreases, due to higher world commodity prices following the implementation of the club's climate policy.
3.5. A climate policy scenario for Brazil
Next, a further scenario is developed by taking into consideration Brazil’s commitment to implement its NDC in 2030 and to reach carbon neutrality by 2050. These scenarios assume that the countries in the ‘club’ also implement their NDCs and their long-term climate strategy. We also assume that club member countries, including Brazil, apply a CBAM on imports from non-club partners. In defining Brazil mitigation targets, our concerns lie in uncertainties about the LULUCF targets, since they are not referenced in the current NDC version and they vary across existing studies. LULUCF is not represented in our model, therefore we use exogenous assumption on its contribution. The analysis done by den Elzen et al. (Citation2022) found Brazil’s LULUCF to be 216 Mt CO2 in 2030, while the study by Fyson and Jeffery (Citation2019) shows a more optimistic view on zero emissions contributions from this sector.
For analytical purposes, we evaluate the historical values of Brazil’s LULUCF emissions (Figure C.1 Supplementary Material), and estimate two potential optimistic and less optimistic LULUCF emissions in 2030 (see Table C.2 Supplementary Material). These assumptions are based on the recent Global Outlook 2022 (Keramidas et al., Citation2022) that evaluates the Brazilian LULUCF emissions to −494 Mt CO2 and −750 Mt CO2, respectively, in 2050 and 2060 in a Long Term Strategy scenario limiting the global temperature increase to below 2°C.
First, we consider a low contribution of LULUCF emissions removal. We assume emissions contributed from LULUCF will be equal to 250 Mt CO2 of net emissions in 2030. It is further assumed that Brazil is aiming for carbon neutrality by 2050, supported by an active policy implemented in the forestry sector, as mentioned in Section 2. For this, we follow the assessment by Favero et al. (Citation2018) for the effectiveness of forest-based actions, as low-cost climate change mitigation options that generate significant CO2 removal. Based on this, we estimate that emissions removal from LULUCF in 2050 will be equal to 600 Mt CO2. We refer to this scenario as Long-Term Strategy Low (LTS Low).
Meanwhile, the second scenario assumes a more significant contribution of LULUCF to remove emissions in the long term. For this we estimate that emissions contributed from LULUCF will be equal to 100 Mt CO2 in 2030, and 800 Mt CO2 emissions removal by 2050. We refer to this scenario as Long-Term Strategy High (LTS High). Our estimation is below the one used by DDP (Citation2021) which assumes a removal from LULUCF of 971 Mt CO2 (see Figure C.2 of Appendix). We project the Brazilian climate policies scenario by implementing a uniform GHG price. High contributions from LULUCF removal mean less pressure from other sectors to abate. It corresponds to a 23.5% GHG emission reduction with respect to the Current Policies Scenario in 2040. Low emissions removal applies more pressure on other sectors for abatement. This results in a 37.7% reduction for the same year.
provides the results of Brazil’s new commitment alongside joining the club implementing CBAM, with these two assumptions. In the scenario with high LULUCF removal to the climate policy (LTS High), the Brazilian GHG tax reaches US$ 127 in 2040. The economic cost of the policy is significant, corresponding to 0.15% of GDP loss or 1.5% welfare cost of household consumption. One third of this cost comes from the dead-weight loss of the Brazilian GHG tax, with the remainder due to the terms of trade effect of climate policies implemented in EU, USA and China.
Table 2. Brazilian climate policies scenarios (in % with respect to the current policies scenario) – year 2040.
The production of EII is positive but 1.6% lower than the scenario of Brazil not joining the club. As CBAM only applied as import tariff, exports fall (−28%), and domestic demand is also declining as a result of higher production prices for energy-intensive goods. The impact on the trade balance is still positive and Brazil's participation in the Club and CBAM protects Brazilian industries. Trade balance with club members deteriorates relative to a scenario without joining the club, but significantly improves with other trading partners. The EII CO2 emission contribution is significantly lower due to Brazil’s stringent climate abatement targets.
In the less optimistic scenario (LTS Low), the tax reaches US$ 144 and the GDP decreases by −0.34%. If less CO2 removal occurs during LULUCF, negative emissions from electricity generation with biofuel plus Carbon Capture and Sequestration (BECCS) increase and reach 180 Mt CO2 in 2040 (compared with 122 Mt CO2 in the previous scenario). Findings on this trade-off between LULUCF and BECCS are also identified by Köberle et al. (Citation2020) for a lower contribution of Agriculture, Forestry and Land Use (AFOLU) and a higher potential for BECCS. The DDP (Citation2021) scenarios lead to a similar conclusion: if their scenarios do not use BECSS, they assume a significant negative contribution from LULUCF. The impact on EII remains positive but their production increases only by 2.1% and job creation reaches 152,000.
3.6. Limitations of this study and a sensitivity analysis
For a better understanding and interpretation of these results, we note caveats from the model used in this study. The first limitation lies in the common assumption of a CGE model related to a constant return to scale, full employment, and technological change (Carbone & Rivers, Citation2017), which tends to be less flexible and affects our results’ predictive precision. The second is related to the industrial classification used by the model, in which CBAM-imposed products are integrated into EII. Representing each sector subject to CBAM improves the generalisability of our results in estimating precise impacts based on sectors’ contributions to the Brazilian GDP. This is a matter to be addressed in future work. The last is on the CGE model framework which does not capture the potential reduction in damages from climate change due to the implementation of climate policies. The macroeconomic impacts of our results do not take these potential benefits into account.
One key parameter of our evaluation lies in the value of the Armington elasticity (Armington, Citation1969). This elasticity is commonly used for trade, assuming that goods from different regions are imperfect substitutes. This analysis uses a relatively high elasticity value for energy-intensive goods (equal to 12) since the goods are quite homogeneous across countries. This high elasticity value is needed to stimulate trade growth when industrial products are relatively homogenous for applied equilibrium models. These models need elasticities of 12 or 13 (Ruhl, Citation2008) to measure competitiveness loss due to stringent abatement and to differ to cases where products are significantly differentiated (Paroussos et al., Citation2015). Empirical works of trade find the range of Armington elasticities between 4 and 15 (Yi, Citation2003) or between 2.5 and 5.1 (Bajzik et al., Citation2020), thus the appropriate values to be applied seems to be subjective (Feenstra et al., Citation2018). For robustness and empirical consistency of estimation, we perform a sensitivity analysis with a set of five alternative values of this Armington elasticity, equal to 0.9, 1.5, 3, 6 and 9 for the reference case, followed by the EU Fit for 55, and CBAM imposition scenarios.
a shows that when the Armington elasticity increases, the change in Brazilian EII exports and imports also increases in the scenario of Fit for 55 without CBAM. Increasing the elasticity from 0.9 to 12, the fall in exports will be 8.4-fold (and respectively 4.7 for imports). From a macroeconomic point of view, increasing the Armington elasticity decreases the welfare cost by improving the trade balance of EII goods.
Figure 3. a. Scenario European policies without CBAM – Change in Brazilian EII exports & imports (in %), and welfare change (in US$ million) with respect to current policies and according to different Armington elasticities Year 2040; b. Change in Brazilian welfare (x-axis) vs change in Brazilian EII trade surplus (y- axis) with CBAM implementation versus a scenario without CBAM according to different Armington elasticities in US$ million – Year 2040.
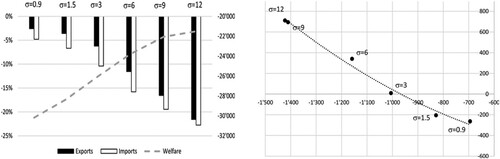
Focusing on the impacts of CBAM implementation on Brazil’s welfare and trade balance (b), the decrease in this elasticity has two opposite effects. First, as expected, it reduces the gain on the trade balance of Brazilian EII products. High Armington elasticities increase Brazil’s competitive advantage over non-European trading partners. When this elasticity is less than 3, this gain becomes a loss. The second outcome is less trivial. As the Armington elasticity increases, implementation of CBAM will be more impactful, resulting in a higher appreciation of the Euro (€), which consequently induces a negative terms of trade effect for Brazil.
4. Conclusion
The upcoming implementation of the EU CBAM in 2025 has raised concerns among the EU trading partners, which has led to opposition from emerging economies, including Brazil. Focusing on the current proposal with energy-intensive CBAM commodities, this paper aims to address concerns from Brazilian industries through a comprehensive analysis of the implications of CBAM. Several scenarios are developed based on the potential imposition of the EU CBAM, including when and how it is being implemented (e.g. collectively or not), and Brazil’s climate targets and likely policies responses.
Three critical findings emerge from this analysis. First, despite the EU’s new climate commitment, the Fit for 55 create costs to Brazil’s economy, but the impact is rather positive for its EII. A higher ETS price pressures EU competitiveness, making Brazilian products relatively more competitive. Brazil’s EII exports and imports decline, yet reductions in its imports exceed those for exports, resulting in a trade surplus for these commodities. Contradictory to Brazilian industries’ concerns about losing competitiveness, CBAM improves the EII trade balance for Brazil. Imposition of CBAM based on direct emissions contents and electricity used (scope 2) maximizes the trade surplus. The low CO2 content of Brazilian EII is a determining factor with the contribution of carbon-free technologies (hydro-electricity, other renewables and nuclear) in electricity generation improving competitiveness. This is a particular outcome for Brazil. Thus, the EU decision upon imposing the CBAM using both scope 1 (only direct emission contents) and scope 2 will be a critical factor for Brazil’s acceptance of CBAM.
Second, joining a CBAM club certainly imposes cost on Brazil’s economy. But in terms of its EII, both production and trade balance are still positive despite being lower than in the scenario of not joining the coalition. EII’s contributed emissions are also significantly lower as consequence of higher mitigation commitments by joining the club.
Yet, another significant factor stems from the contribution of LULUCF. Our analysis confirms that Brazil’s contribution to LULUCF is a critical variable, affecting all distributional impacts. A lower contribution to mitigation goals from LULUCF means more abatement pressure in industrial sectors, which results in higher carbon and commodity prices. Tackling the deforestation issues for more significant contributions of carbon removal is consequential since it will ease the abatement pressure of the industrial sectors and minimize these negative distributional effects. Adding to this, more transparent and accountable emissions from this LULUCF sector is important for Brazil if a new phase of the CBAM is to be set up to incorporate land use-related such as agriculture-based emissions.
The final finding lies in the homogeneity of CBAM-imposed products. The sensitivity analysis conducted in this study proves that the homogeneity of the CBAM-imposed products across countries is one of the key parameters affecting the results. When the products tend to be varied and heterogenous, the substitutability of the import source tends to be lower, and it may cause a deficit in the Brazilian trade balance. In the absence of a CBAM literature focusing on Brazil, this study complements existing studies of CBAM and becomes a point of reference for Brazil’s policymakers.
Supplemental Material
Download MS Word (77.8 KB)Acknowledgements
The content of this paper does not necessarily reflect the opinions of the European Commission or the Swiss Confederation, and the responsibility for it lies solely with its authors. We warmly thank GTAP 26th and EAERE 28th Annual Conference participants for discussions and feedback. We thank three anonymous reviewers and editor-in-chief for their thoughtful review and invaluable assistance refining the manuscript.
Disclosure statement
No potential conflict of interest was reported by the author(s).
Additional information
Funding
Notes
1 Authors’ estimation based on GTAP 10 Database, in line with the preceding work documented in Perdana and Vielle (Citation2022).
2 Indicators are based on Eicke et al. (Citation2021), in which country’s exposure indicates the significance of trade with the EU for the national economy. It is estimated by total EII export relative to overall export to the EU vulnerability risk reflects the diversification of exports and is estimated by comparing of EIIs exported to the EU on the overall country’s export worldwide.
3 We also compute scope 1 by integrating other greenhouse gases (CH4, N2O and F-gases), which represent a small share of the EII’s emissions (less than 10%) and do not change the hierarchy between countries.
References
- Antimiani, A., Costantini, V., Martini, C., Salvatici, L., & Tommasino, M. C. (2013). Assessing alternative solutions to carbon leakage. Energy Economics, 36, 299–311. https://doi.org/10.1016/j.eneco.2012.08.042
- Armington, P. S. (1969). A theory of demand for products distinguished by place of production (Une théorie de la demande de produits différenciés d'après leur origine) (Una teoría de la demanda de productos distinguiéndolos según el lugar de producción). Staff Papers-International Monetary Fund, 159–178.
- Bajzik, J., Havranek, T., Irsova, Z., & Schwarz, J. (2020). Estimating the Armington elasticity: The importance of study design and publication bias. Journal of International Economics, 127. https://doi.org/10.1016/j.jinteco.2020.103383
- Bellora, C., & Fontagné, L. (2022). EU in search of a WTO-compatible carbon border adjustment mechanism. Available at SSRN 4168049.
- BEN. (2022). Balanço Energético Nacional.
- Bernard, A., & Vielle, M. (2008). GEMINI-E3, a general equilibrium model of international–national interactions between economy, energy and the environment. Computational Management Science, 5(3), 173–206. https://doi.org/10.1007/s10287-007-0047-y
- Boden, T. A., Marland, G., & Andres, R. J. (2009). Global, regional, and national fossil-fuel CO2 emissions. Carbon dioxide information analysis center, Oak Ridge national laboratory, US department of energy, Oak Ridge, Tenn., USA.
- Böhringer, C., Garcia-Muros, X., Cazcarro, I., & Arto, I. (2017). The efficiency cost of protective measures in climate policy. Energy Policy, 104, 446–454. https://doi.org/10.1016/j.enpol.2017.01.007
- Böhringer, C., Schneider, J., & Asane-Otoo, E. (2021). Trade in carbon and carbon tariffs. Environmental and Resource Economics, 78(4), 669–708. https://doi.org/10.1007/s10640-021-00548-y
- Branger, F., & Quirion, P. (2014). Would border carbon adjustments prevent carbon leakage and heavy industry competitiveness losses? Insights from a meta-analysis of recent economic studies. Ecological Economics, 99, 29–39. https://doi.org/10.1016/j.ecolecon.2013.12.010
- Carbone, J. C., & Rivers, N. (2017). The impacts of unilateral climate policy on competitiveness: evidence from computable general equilibrium models. Review of Environmental Economics and Policy, 11(1), 24–42. http://doi.org/10.1093/reep/rew025.
- Clora, F., Yu, W., & Corong, E. (2023). Alternative carbon border adjustment mechanisms in the European Union and international responses: Aggregate and within-coalition results. Energy Policy, 174, 113454. https://doi.org/10.1016/j.enpol.2023.113454
- Cosbey, A., Droege, S., Fischer, C., & Munnings, C. (2019). Developing guidance for implementing border carbon adjustments: lessons, cautions, and research needs from the literature. Review of Environmental Economics and Policy, 13(1), 3–22. http://doi.org/10.1093/reep/rey020.
- Dadush, U. (2021). The EU’s carbon border Tax is likely to do more harm than good. Policy Brief, 21, 21.
- da Silva, A. L. R., & Volpato, V. (2022). The role of the European Union in the Brazilian foreign policy: An analysis of the Brazil-European union strategic partnership. Revista Sul-Americana de Ciência Política, 8(1), 1–25. https://doi.org/10.15210/rsulacp.v8i1.21382
- DDP (2021). Policy lessons on deep decarbonization in large emerging economies. Deep decarbonization pathways (DDP) initiative-IDDRI. Paris.
- den Elzen, M. G. J., Dafnomilis, I., Forsell, N., Fragkos, P., Fragkiadakis, K., Höhne, N., Kuramochi, T., Nascimento, L., Roelfsema, M., van Soest, H., & Sperling, F. (2022). Updated nationally determined contributions collectively raise ambition levels but need strengthening further to keep Paris goals within reach. Mitigation and Adaptation Strategies for Global Change, 27(5), 33. https://doi.org/10.1007/s11027-022-10008-7
- Eicke, L., Weko, S., Apergi, M., & Marian, A. (2021). Pulling up the carbon ladder? Decarbonization, dependence, and third-country risks from the European carbon border adjustment mechanism. Energy Research & Social Science, 80, 102240. https://doi.org/10.1016/j.erss.2021.102240
- European Commission. (2021). Regulation of the European parliament and of the council establishing a carbon border adjustment mechanism.
- European Parliament. (2021). A WTO-compatible EU carbon border adjustment mechanism. European Parliament resolution of 10 March 2021 towards a WTO-compatible EU carbon border adjustment mechanism (2020/2043(INI)).
- European Parliament. (2022). EU carbon border adjustment mechanism: Implications for climate and competitiveness. https://www.europarl.europa.eu/RegData/etudes/BRIE/2022/698889/EPRS_BRI(2022)698889_EN.pdf.
- Eurostat. (2018). Brazil-EU international trade in goods statistics. https://ec.europa.eu/eurostat/statistics-explained/index.php?title=BrazilEU__international_trade_in_goods_statistics#Most_traded_goods:_aircraft_and_associated_equipment.
- Favero, A., Sohngen, B., Huang, Y., & Jin, Y. (2018). Global cost estimates of forest climate mitigation with albedo: a new integrative policy approach. Environmental Research Letters, 13(12), 125002. https://doi.org/10.1088/1748-9326/aaeaa2
- Feenstra, R. C., Luck, P., Obstfeld, M., & Russ, K. N. (2018). In search of the Armington elasticity. The Review of Economics and Statistics, 100(1), 135–150. https://doi.org/10.1162/REST_a_00696
- Feijó, F. T., & Kuik, O. (2018). Brazilian competitiveness of energy-intensive and trade-exposed industrial sectors vis-à-vis the adoption of border carbon adjustments by the EU: an approach using the GTAP-EP model. In Anais do XLIV Encontro Nacional de Economia [Proceedings of the 44th Brazilian Economics Meeting] (No. 100). ANPEC-Associaà § ã o Nacional dos Centros de Pós-Graduaà § ã o em Economia [Brazilian Association of Graduate Programs in Economics].
- Fleming, S., & Giles, C. (2021). OECD seeks global plan for carbon prices to avoid trade wars. Financial Times, 13.
- Fouré, J., Guimbard, H., & Monjon, S. (2016). Border carbon adjustment and trade retaliation: What would be the cost for the European Union? Energy Economics, 54, 349–362. https://doi.org/10.1016/j.eneco.2015.11.021
- Friedlingstein, P., Jones, M. W., O’Sullivan, M., Andrew, R. M., Hauck, J., Peters, G. P., … Zaehle, S. (2019). Global carbon budget 2019. Earth System Science Data, 11(4), 1783–1838. https://doi.org/10.5194/essd-11-1783-2019
- Fyson, C. L., & Jeffery, M. L. (2019). Ambiguity in the land use component of mitigation contributions toward the Paris Agreement goals. Earth's Future, 7(8), 873–891. https://doi.org/10.1029/2019EF001190
- Garaffa, R., Cunha, B. S., Cruz, T., Bezerra, P., Lucena, A. F., & Gurgel, A. C. (2021). Distributional effects of carbon pricing in Brazil under the Paris Agreement. Energy Economics, 101, 105396. https://doi.org/10.1016/j.eneco.2021.105396
- Grottera, C., Naspolini, G. F., La Rovere, E. L., Schmitz Gonçalves, D. N., Nogueira, T. d. F., Hebeda, O., Dubeux, C. B. S., Goes, G. V., Moreira, M. M. R., Mota da Cruz, G., Gesteira, C. J. M., Wills, W., Castro, G. M., D'Agosto, M. d. A., Le Treut, G., da Cunha, S. H. F., & Lefèvre, J. (2022). Energy policy implications of carbon pricing scenarios for the Brazilian NDC implementation. Energy Policy, 160, 112664. https://doi.org/10.1016/j.enpol.2021.112664
- Hebeda, O., Guimarães, B. S., Cretton-Souza, G., La Rovere, E. L., & Pereira, A. O. (2023). Pathways for deep decarbonization of the Brazilian iron and steel industry. Journal of Cleaner Production, 401, 136675. https://doi.org/10.1016/j.jclepro.2023.136675
- Helm, D., Hepburn, C., & Ruta, G. (2012). Trade, climate change, and the political game theory of border carbon adjustments. Oxford Review of Economic Policy, 28(2), 368–394. https://doi.org/10.1093/oxrep/grs013
- Keramidas, K., Fosse, F., Diaz Rincon, A., Dowling, P., Garaffa, R., Ordonez, J., … Weitzel, M. (2022). Global Energy and Climate Outlook 2022: Energy trade in a decarbonised world (No. JRC131864). Joint Research Centre (Seville site).
- Köberle, A. C., Rochedo, P. R., Lucena, A. F., Szklo, A., & Schaeffer, R. (2020). Brazil’s emission trajectories in a well-below 2°C world: the role of disruptive technologies versus land-based mitigation in an already low-emission energy system. Climatic Change, 162(4), 1823–1842. https://doi.org/10.1007/s10584-020-02856-6
- La Rovere, E. L. (2017). Low-carbon development pathways in Brazil and ‘Climate Clubs’. Wiley Interdisciplinary Reviews: Climate Change, 8(1), e439. https://doi.org/10.1002/wcc.439
- Li, A., & Zhang, A. (2012). Will carbon motivated border tax adjustments function as a threat? Energy Policy, 47, 81–90. https://doi.org/10.1016/j.enpol.2012.04.023
- Lin, B., & Zhao, H. (2023). Evaluating current effects of upcoming EU Carbon Border Adjustment Mechanism: Evidence from China's futures market. Energy Policy, 177, 113573. https://doi.org/10.1016/j.enpol.2023.113573
- Magacho, G., Espagne, E., & Godin, A. (2023). Impacts of the CBAM on EU trade partners: consequences for developing countries. Climate Policy, 1–17. https://doi.org/10.1080/14693062.2023.2200758
- Mattoo, A., Subramanian, A., Van Der Mensbrugghe, D., & He, J. (2009). Reconciling climate change and trade policy. Center for Global Development Working Paper, 189.
- Moreira, A. (2021). Brazil warns EU about discrimination in carbon tax plan. Valor International Business. November 2021. https://valorinternational.globo.com/business/news/2021/11/21/brazil-warns-eu-about-discrimination-in-carbon-tax-plan.ghtml.
- Moreira, A., & Murakawa, F. (2021). Brazil’s steel more vulnerable to EU carbon tax. Valor International Business, Geneva, July 2021. https://valorinternational.globo.com/economy/news/2021/07/14/brazils-steel-more-vulnerable-to-eu-carbon-tax.ghtml.
- Moz-Christofoletti, M. A., & Pereda, P. C. (2021). Winners and losers: the distributional impacts of a carbon tax in Brazil. Ecological Economics, 183, 106945. https://doi.org/10.1016/j.ecolecon.2021.106945
- Nordhaus, W. (2015). Climate clubs: Overcoming free-riding in international climate policy. American Economic Review, 105(4), 1339–1370. https://doi.org/10.1257/aer.15000001
- Overland, I., & Sabyrbekov, R. (2022). Know your opponent: Which countries might fight the European carbon border adjustment mechanism? Energy Policy, 169, 113175. https://doi.org/10.1016/j.enpol.2022.113175
- Paroussos, L., Fragkos, P., Capros, P., & Fragkiadakis, K. (2015). Assessment of carbon leakage through the industry channel: the EU perspective. Technological Forecasting and Social Change, 90, 204–219. https://doi.org/10.1016/j.techfore.2014.02.011
- Perdana, S., & Tyers, R. (2020). Global climate change mitigation: strategic incentives. The Energy Journal, 41(3), 183–206. https://doi.org/10.5547/01956574.41.3.sper
- Perdana, S., & Vielle, M. (2022). Making the EU carbon border adjustment mechanism acceptable and climate friendly for least developed countries. Energy Policy, 170, 113245. https://doi.org/10.1016/j.enpol.2022.113245
- Perdana, S., & Vielle, M. (2023). Carbon border adjustment mechanism in the transition to net-zero emissions: collective implementation and distributional impacts. Environmental Economics and Policy Studies, 1–31.
- Qi, S., Xu, Z., & Yang, Z. (2022). China's carbon allowance allocation strategy under the EU carbon border adjustment mechanism: An integrated non-parametric cost frontier approach. Science of The Total Environment, 831, 154908. https://doi.org/10.1016/j.scitotenv.2022.154908
- Ruhl, K. J. (2008). The international elasticity puzzle. http://users.econ.umn.edu/~tkehoe/classesNew/Ruhl.pdf.
- Sandrin, P., & Ribeiro Hoffmann, A. (2019). The EU seen from Brazil: Images and perceptions. Shaping the EU global strategy: Partners and perceptions, 27–54.
- Santos, L., Lucena, A. F., & Garaffa, R. (2019). Would different methodologies for assessing carbon leakage exposure lead to different risk levels? A case study of the Brazilian industry. Climate Policy, 19(9), 1102–1116. https://doi.org/10.1080/14693062.2019.1627180
- Sognnaes, I., Gambhir, A., van de Ven, D.-J., Nikas, A., Anger-Kraavi, A., Bui, H., Campagnolo, L., Delpiazzo, E., Doukas, H., Giarola, S., Grant, N., Hawkes, A., Köberle, A. C., Kolpakov, A., Mittal, S., Moreno, J., Perdana, S., Rogelj, J., Vielle, M., & Peters, G. P. (2021). A multi-model analysis of long-term emissions and warming implications of current mitigation efforts. Nature Climate Change, 11(12), 1055–1062. https://doi.org/10.1038/s41558-021-01206-3
- Sonter, L. J., Herrera, D., Barrett, D. J., Galford, G. L., Moran, C. J., & Soares-Filho, B. S. (2017). Mining drives extensive deforestation in the Brazilian Amazon. Nature Communications, 8(1), 1013. https://doi.org/10.1038/s41467-017-00557-w
- South African Government. (2021). Joint statement issued at the conclusion of the 30th BASIC ministerial meeting on climate change hosted by India on 8th April 2021. https://www.gov.za/nr/speeches/joint-statementissued-conclusion-30th-basic-ministerial-meeting-climate-change-hosted.
- UNFCCC. (2022). Brazil: Federal republic of Brazil intended nationally determined contribution - second revision. https://unfccc.int/sites/default/files/NDC/2022-06/Updated%20-%20First%20NDC%20-%20%20FINAL%20-%20PDF.pdf.
- Venzke, I., & Vidigal, G. (2022). Are trade measures to tackle the climate crisis the End of differentiated responsibilities? The case of the EU carbon border adjustment mechanism (CBAM). Amsterdam Law School Legal Studies Research Paper. 2022-02.
- Wiltshire, A. J., von Randow, C., Rosan, T. M., Tejada, G., & Castro, A. A. (2022). Understanding the role of land-use emissions in achieving the Brazilian Nationally Determined Contribution to mitigate climate change. Climate Resilience and Sustainability, 1(1), e31. https://doi.org/10.1002/cli2.31
- World Bank. (2017). The World Bank Data: Latin America and Caribbean. http://data.worldbank.org/region/latin-america-and-caribbean; 2017.
- World Resources Institute. (2017). CAIT climate data explorer: historical emission. http://cait.wri.org/; 2017.
- Yi, K. M. (2003). Can vertical specialization explain the growth of world trade? Journal of Political Economy, 111(1), 52–102. https://doi.org/10.1086/344805
- Zhang, Z. (2010). The US proposed carbon tariffs, WTO scrutiny and China’s responses. International Economics and Economic Policy, 7(2-3), 203–225. https://doi.org/10.1007/s10368-010-0166-8
- Zhong, J., & Pei, J. (2022). Beggar thy neighbor? On the competitiveness and welfare impacts of the EU's proposed carbon border adjustment mechanism. Energy Policy, 162, 112802. doi:10.1016/j.enpol.2022.112802