
ABSTRACT
Disruptive policy packages that fundamentally change the current unsustainable passenger transport structures and enable low-carbon mobility transformation are inevitable. This implies the use of more stringent and multiple restrictive (i.e. push) measures. To enable successful implementation, public acceptance is critical, but what drives this acceptance? In this study, two main hypotheses were tested using survey methods that combined a two-group framing with a conjoint experiment: (1) The acceptance of push measures decreases as disruption increases; (2) disruptive push measures are less likely to be rejected when communicated as part of a policy package that included complementary pull measures (i.e. incentives). We conducted this survey with a quota-representative sample of 1,032 respondents from Austria. Two main findings emerge: First, we find low public acceptance of push measures, but observe differences based on the level of disruption (i.e. the measures’ intensity or rapidity of implementation). The more disruptive the measure (e.g. a registration ban for fossil fuel cars or a fuel price increase), the more negatively these measures were evaluated by survey respondents. Second, our results indicate the need to communicate and implement high-impact, more restrictive push measures (e.g. car bans) as part of policy packages that include acceptance-boosting pull measures.
Key policy insights
Successful and acceptable mitigation policies for low-carbon mobility require multiple push measures that are communicated in policy packages together with pull measures.
Acceptance levels of push measures are generally low, but acceptance differs depending on how disruptive the respective policy is, with the more disruptive policies being less well accepted.
Acceptable combinations of push measures may include higher parking fees, car-free city centres, and street redesign to, e.g. prioritize non-motorized modes of transport.
Responses to the presented push measures vary across society, with frequent car users showing higher levels of rejection dependent on the included policy measures, underlining the need to tailor policies for specific contexts.
1. Introduction
The current transport policies are not stringent enough to meet the emission reduction targets pledged in the fight against anthropogenic climate change. This lack of stringency is especially true for passenger road transport, where greenhouse gas (GHG) emissions are still increasing (Axsen et al., Citation2020; Brand et al., Citation2021), being responsible for 20.7% of global CO2 emissions (Statista, Citation2023) and nearly returning back to their pre-pandemic level in 2022 (IEA, Citation2023). Regarding passenger inland transport (i.e. transport by road, rail, and inland waterways), cars with internal combustion engines are the dominant mode of travel. These accounted for 87.2% of such transport in the EU-27 in 2020 (Eurostat, Citation2022), underlining the prevalent consumer carbon lock-in (Ivanova et al., Citation2018; see also Unruh, Citation2000 for a general description of the carbon lock-in concept) and the need to implement demand-side measures. Therefore, radical or so-called ‘disruptive’ policy measures developed to overturn existing sectoral structures are needed to fundamentally change the current unsustainable passenger transport structures and enable a low-carbon mobility transformation (Axsen et al., Citation2020; Hamdi-Cherif et al., Citation2021; Thaller et al., Citation2021; Wicki et al., Citation2020). This proposal is based on Kivimaa et al.’s (Citation2021) definition of disruption in a systematic review on disruption in sustainability transitions:
a high-intensity effect in the structure of the sociotechnical system(s), demonstrated as long-term change in more than one dimension or element, unlocking the stability and operation of incumbent technology and infrastructure, markets and business models, regulations and policy, actors, networks and ownership structures, and/or practices, behaviour and cultural models.
Another aspect influencing policy acceptance is the way policies are communicated. In this context, framing is a widely used, as well as heterogenous, approach (see Badullovich et al., Citation2020 for a systematic review of framing used as a tool in climate change communication). According to Chong and Druckman (Citation2007), framing effects ‘occur when (often small) changes in the presentation of an issue or an event produce (sometimes large) changes of opinion.’ Framing is often used and studied in the context of so-called strategic issue framing, where different thematical frames (e.g. health or the local environment) are applied to see whether this can change the behavioural or policy responses (see, e.g. Bain et al., Citation2012; Hart & Feldman, Citation2018; Stevenson et al., Citation2018). However, this approach has been criticized. For example, Fesenfeld et al. (Citation2021) surveyed a large sample including respondents from China, Germany, and the United States and found that applying strategic issue framing in isolation is unlikely to effectively change behaviour or increase public support for demand-side policies. Existing values and social norms are further aspects that are often targeted in framing experiments. Several publications on communication in the climate and environmental area indicate that framing can effectively alter public support for specific policies and/or behavioural intentions across different population groups, where the frames align with the individuals’ existing values and prior beliefs (Bolderdijk et al., Citation2013; Boomsma & Steg, Citation2014; Graham & Abrahamse, Citation2017; Nilsson et al., Citation2016). In a recent study on food waste, Fesenfeld et al. (Citation2022) showed that messages emphasizing national or international social norms could increase public support for stronger reduction targets.
In our study, we adopted a policy-package perspective by focusing on combinations of policies needed for climate change mitigation, namely, multiple push measures. Research on the public acceptance of policy packages has increased recently (cf. Brückmann & Bernauer, Citation2020; Wicki et al., Citation2019), and the literature indicates that policy packaging can increase acceptance for push measures in passenger transport (Fesenfeld, Citation2022; Hössinger et al., Citation2023; Wicki et al., Citation2020). However, the question of effective communication remains, and few studies have focused on how to frame disruptive policy packages to enhance acceptance by explicitly focusing on and differentiating between multiple push measures. This study was performed for two reasons. First, we sought to define which kind of push measures have the highest levels of public acceptance. We hypothesized that higher levels of disruptions would lead to lower public acceptance, as suggested by Attari et al. (Citation2009) and Wicki et al. (Citation2019). Second, given the crucial but difficult role push measures play in mitigation, we asked whether including framing and communicating disruptive push measures in policy packages could increase their acceptance levels. We also examined two potential factors that have been shown to affect public acceptance, namely, car use and environmental awareness. Car use is an indicator for policy proximity, which has been shown to negatively affect support (Huber & Wicki, Citation2021). Environmental awareness represents personal ideology and beliefs, which has been found to positively influence acceptance (Eriksson et al., Citation2008; Kitt et al., Citation2021). Thus, we tested the following main and secondary hypotheses, derived from existing literature:
H1: The acceptance of push measures decreases with higher levels of disruption (main).
H2: Disruptive push measures are less likely rejected when communicated as part of a policy package that also includes complementary pull measures (main).
H3: Car users show lower acceptance levels for disruptive push measures (secondary).
H4: Respondents with high environmental awareness levels show higher acceptance levels for disruptive push measures (secondary).
2. Materials and methods
2.1. Questionnaire design and experimental settings
illustrates the overall survey design and highlights how the experimental settings were embedded in the survey. The framing experiment was carried out to assess whether the acceptance of push measures increases if they are communicated as part of a policy package together with pull measures. For this purpose, our sample was randomly split into two groups. Respondents of Group 1 (n = 537, 52%) and 2 (n = 495, 48%) received different instructions to fulfil the choice tasks. Both groups were asked to imagine that the federal government would implement policy measures to address challenges in passenger transport (e.g. GHG and particulate matter emissions, noise, poor air quality). Group 1 was then informed that a set of pull measures is combined with push measures into policy packages, but Group 2 was not notified about this joint implementation (see Supplement A.2 for the translated version of the information provided). The two groups were compared to assess differences in their response behaviour in the subsequent conjoint experiment.
Figure 1. Illustration of experiment design.
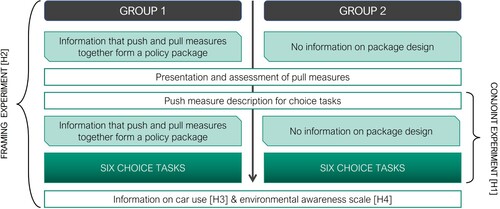
This conjoint experiment (with different framings for Groups 1 and 2) was performed to examine critical aspects in disruptive policy package design; therefore, the experiment only measured differences in push measure implementation.Footnote1 Survey respondents were first presented with an overview of the push measures, including a brief description of each policy to clarify its purpose (see for a detailed overview). Before performing the choice tasks, Group 1 respondents again received information about the package design. They were then asked to compare two sets of eight push measures, respectively, and to indicate whether they preferred combination A or combination B (binary forced-choice). Overall, six choices with two combinations each (A and B) and randomly varied attribute levels were presented to each respondent. We assumed that all respondents would not be able to remember the descriptions in detail; therefore, an info button was provided for each choice task, allowing respondents to review the measure descriptions again if needed. After each task, respondents were asked to rate both combinations (A and B) separately on a seven-point scale, ranging from 1 (‘I strongly reject’) to 7 (‘I strongly support’). An example of a choice task, including the rating items, is provided in Supplement A.3.
Table 1. Push measures: attributes, descriptions, and levels.
After the conjoint experiment was conducted, the environmental awareness scale was included (H4), as this scale is recommended for German-speaking countries (Best, Citation2006). On this scale, nine items addressing three dimensions of environmental awareness – the respondents’ feelings about environmental problems, problem awareness, and their willingness to perform environmentally-friendly actions – were included using a five-point scale, ranging from 1 (‘strongly disagree’) to 5 (‘strongly agree’). The questionnaire also included a question on car use (i.e. kilometres driven in the previous year 2020, H3) and several items related to the respondents’ sociodemographic characteristics. Participants were asked to state their year of birth, gender, highest completed level of education, net monthly household income, and political orientation (ten-point left-to-right scale, whereby 1 was labelled ‘left’ and 10 ‘right’). With respect to the respondents’ residential location, they were asked whether they lived in a rural, rather rural, rather urban, or urban area.
2.2. Statistical analysis
To analyse the main results of the combined experimental design, the average marginal component effects (AMCEs) were estimated. These depict the marginal effect of a given attribute on the choice probability across the joint distribution of all other attributes (Hainmueller et al., Citation2014). AMCEs were estimated separately for both the full sample and the two framing groups (package information for Group 1, no package information for Group 2). In practice, AMCEs are typically calculated by regressing a dummy variable to indicate whether a respondent preferred a particular combination of attributes and using cluster-robust standard errors to account for within-respondent clustering. In other words, the level of a specific attribute increases or decreases acceptance for the policy combination relative to the baseline level (in this study, indicating that the specific policy was not included) over all respondents and other policy attributes.
Moreover, marginal means (MM) were calculated as by Leeper et al. (Citation2020), as conjoint experiment results are sensitive to baseline categories. This approach is critical to test hypotheses involving experimental interactions and heterogeneous treatment effects and, thus, was appropriate for identifying differences between the two framing groups. Marginal means can be interpreted as the probability of choosing packages with a particular attribute level, marginalizing across all other attributes. Calculating the AMCEs and marginal means allowed us to examine whether push measures were more socially acceptable when communicated as part of a policy package together with pull measures (H1) and to determine how the respondents evaluated the push measures differently, depending on their extent of disruption (H2). We used a full factorial design with restricted randomization. For restriction (a), the ICEV use ban could only be introduced after the registration ban, if one was present in the combination, and for restriction (b), a city toll could only be installed if no permanent inner-city car ban was present in the same combination.
To additionally test for potential interaction effects, we predicted the acceptance of different attribute levels in the conjoint experiment by including interaction effects of an annual driving range (H3) and environmental awareness (H4) by performing a mixed-effects linear regression. The predicted acceptance level was calculated based on the seven-point scale to assess the acceptance of the individual proposals used in the conjoint task. We also log-transformed the annual driving range to control for large values and controlled for sociodemographic variables. All steps taken, ranging from data cleaning to the statistical analyzes, were done in R (R Core Team, Citation2020, version 4.3.1). See Supplement D for a detailed overview of the used R packages.
3. Results
3.1. Sample description
The survey was fielded in May 2021, and the final sample (N = 1,032) is representative of Austria’s population in terms of gender, education, and size of residential area.Footnote2 See for an overview of the sociodemographic sample characteristics. The participants were between 16 and 81 years old, with an average age of 44.65 years. Regarding their income, the median income group was 2,201-3,000 euros per month. Additionally, around half of the respondents (48.9%) stated to live in urban or rather urban areas. With respect to the respondents’ political orientation (n = 844), an overall tendency towards the middle could be observed, with an average of 5.2, a median of 5, and a mode of 5. Car users (n = 702) drove on average 19,996 (median = 15,000) kilometres by car in 2020, with a considerable range between 30 and 140,000 kilometres.Footnote3 Participants scored slightly positive (mean = 3.4) on the environmental awareness scale (α = 0.88).
Table 2. Sociodemographic sample characteristics.
3.2. Overall conjoint effects: AMCEs and marginal means for rating (H1)
Findings from the rating tasks for all respondents are presented below, whereas the findings from the forced-choice task are provided in Supplement C.2. Overall, the marginal means for policy ratings ranged between 2.98 and 3.24 on the seven-point scale. Pricing mechanisms had a predominantly negative effect on the rating of the overall combination of push measures. Increasing fuel prices had the most substantial effect, with an AMCE of −0.53 from no fuel price increase (baseline, MM = 3.51) to tripling prices (MM = 2.98). Similarly, increased parking prices and a toll in city centres showed significant adverse effects, but at smaller effect levels. This effect tendency is similar to that seen for a capacity-based measure: introducing a mileage cap on car use (AMCE = −0.22 for reduction by 3,000 km as compared to no mileage cap). In comparison to the other measures, we do not find significant differences in the AMCEs with respect to the baseline for these two measures (inner-city car ban and street redesign), meaning that people do not have strong preferences on whether the policies are included in the packages or not. Note that the results presented in this section include the responses of all participants, therefore not further distinguishing between the two groups (with/without packaging information). Find an overview of the marginal means and AMCEs for both the forced-choice and the rating task for all respondents and per group in Supplement C.
3.3. Treatment effect (H2)
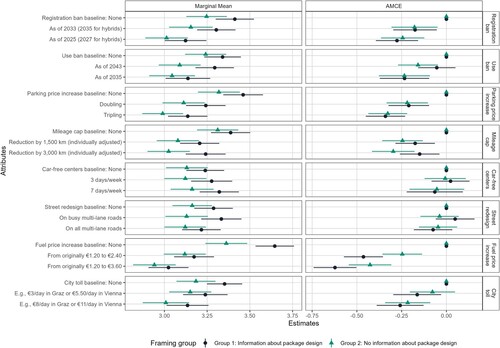
To determine whether the framing experiment (communicating push measures as part of a policy package together with pull measures vs. no information) influenced the average rating of push measure combinations per group, we calculated a two-sided t-test. We find a significant (p < 0.01) but negligible (Cohen’s d = 0.08) effect: Regarding the overall rating of policy combinations, Group 1 received a mean rating of 3.28, while the combinations in Group 2 were on average rated with 3.14 (mean rating overall: 3.21). shows both the marginal means and AMCEs of all attribute levels of policy options based on the rating task in the conjoint experiment per group (see Supplement C for general results for all respondents as well as results for the forced choice, which are similar). Regarding the marginal means, combinations from Group 1 on average received higher ratings than those from Group 2; for example, a registration ban as of 2025 received a marginal mean of 3.12 for Group 1 and a marginal mean of 3.01 for Group 2. These results reflect the t-test findings. Despite these differences in the overall ratings, no differences were found between the two groups regarding the mere direction of effects visible in the signs of the AMCEs. However, when looking at the changes in MMs represented through AMCEs, a fuel price increase more negatively affected Group 1 (AMCE = −0.62 for Group 1 and AMCE = −0.43 for Group 2, respectively, for a tripling of the fuel price), while the opposite was the case for the mileage cap (AMCE = −0.15 for Group 1 and AMCE = −0.30 for Group 2, respectively, for a reduction by 3,000 km).
Figure 2. Estimated marginal means and average marginal component effects (AMCE) of rating task by framing group. Error bars show 95% confidence intervals.
3.4. Predicting acceptable push measure combinations (H1 and H2)
To identify combinations of push measures that were not strongly rejected, we predicted ratings for the 13,122 combinations generated by our conjoint design based on their distribution, including interactions among the single attributes (see Supplement C.2). We focused on the ratings instead of the forced choice results, as this enabled us to detect framing differences more clearly between groups and attributes regarding the general acceptance of the full policy package. Overall, we identified 102 policy combinations that attracted ratings of 4 or higher in their distribution (on a seven-point scale) for Group 1, and 7 for Group 2.
Packages including a tripling of parking prices or generally increasing fuel prices did not receive ratings of 4 or higher in either of the groups. The two groups differed notably in several aspects: For example, doubling parking prices in Group 1 resulted in average acceptance levels above 4 for some of the included packages, while this was not the case in Group 2.
We also potentially identified the most effective policy combinations that imply higher behavioural costs due to their stringency and received the highest ratings from both framing groups. Various policy combinations are possible for Group 1 that receive ratings above 4, although none of these included increased fuel prices. Some of these combinations, however, included a doubling of parking prices together with (partially) car-free city centres, and street redesigns. Such combinations could also receive ratings above 4 if – instead of a parking price increase – any of the two following policies were included: a mileage reduction of 3,000 km, or a mid-level city toll. In Group 2, the most stringent combination of push measures that received acceptance levels above 4 included car-free city centres on three days per week, and street redesign on all multi-lane roads.
3.5. Predicted average ratings by individual driving behaviour and environmental awareness (H3 and H4)
Overall, with increasing annual driving range a downward trend for the predicted ratings is observed for all investigated measures and intensity levels (see Figure B.1.1 in the Supplement). However, we do not find a direct significant effect between the annual driving range and the overall policy package ratings. Regarding interaction effects with specific attribute levels, barely significant differences could be found. Notable exceptions are, for example, the fuel price increases as well as the ICEV use bans, which received significantly lower acceptance levels from frequent drivers than from less frequent drivers (see model 2.2 in Table C.2.2 in the Supplement). These findings offer partial confirmation of Hypothesis H3, which posits that car users state lower acceptance levels for disruptive push measures. This support is conditional, revealing that the influence of car use on public acceptance varies depending on the specific design and attribute characteristics of the policy package.
In general, a positive trend between the predicted ratings and higher environmental awareness is observed across all policy measures and intensity levels (see Figure B.1.2 in the Supplement). However, we do not find a significant direct effect between higher levels of environmental awareness and higher overall rating levels for combinations of policy measures (see model 2.2 in Table C.2.2 in the Supplement). Regarding interaction effects with specific attribute levels, however, we find significant positive effects for five out of the eight policies (registration and use ban, car-free city centers, street redesign, and city tolls). These findings indicate partial support to Hypothesis H4, which suggests that individuals with high environmental awareness are more accepting of disruptive push measures. This partial confirmation is influenced by the specific nature of the policy measures, indicating that the effect of environmental awareness on public acceptance is not uniformly applicable across all policies, but varies with their particular designs and implementations.
3.6. Sociodemographic differences in ratings
To test whether certain demographic traits affected the overall acceptance of push measure combinations, we also controlled for several demographic variables (age, gender, education, employment, political orientation, urban-rural differences, and income) and the primary outcome measures of rating preferences (see model 2.3 in Table C.2.2 in Supplement C). The results only indicate a statistically significant difference for respondents based on their political orientation, where a more right-wing political orientation was related to significantly lower ratings of the presented policy combinations.
4. Discussion
This study was carried out to answer two main questions, namely, which kind of push measures are the most publicly acceptable and whether framing and communicating disruptive push measures as part of policy packages could increase their acceptability.
Regarding the first question, our results indicate that acceptance levels of most of the investigated push measures decreased as the disruption caused by introducing these measures increased. These results provide support for H1 (The acceptance of push measures decreases with higher levels of disruption). Our findings are thus consistent with those of Hössinger et al. (Citation2023), who used participatory value evaluation to examine citizens’ preference for a range of different transport policies and found a strong aversion among participants to adopt highly restrictive measures when composing potential policy bundles. For example, for the registration bans of ICEVs, respondents evaluated an earlier introduction of car bans more negatively. These findings may have implications for the latest plans to effectively ban the sale of new petrol and diesel cars starting in 2035 at the EU level (EC, Citation2021) and for similar intentions in multiple other regions worldwide (Plötz et al., Citation2019).
Concerning preferences between different types of push measures, for example between economic and regulatory measures, no definitive conclusions can be drawn based on our study, in contrast to other literature, which typically finds regulatory measures to be favoured by the public (Hössinger et al., Citation2023; Wicki et al., Citation2019). At the same time, however, fuel taxation was primarily viewed negatively and showed the strongest negative effects in terms of policy package acceptance. This result might be interpreted in the light of fairness considerations (Drews & van den Bergh, Citation2016): An increase in the fuel price – as the current energy crisis illustrates – is felt much more strongly by low-income households than by wealthy households (Nikodinoska & Schröder, Citation2016; Wang et al., Citation2016). In this context, it should be noted that the policy packages presented in our study did not explicitly mention any kind of monetary compensation measures for households that would be strongly affected by increases in the price of fossil fuels, an aspect that might influence policy regressiveness and their subsequent acceptance (Ohlendorf et al., Citation2021).. We also did not address the issue of transparently using additional tax revenues, for example, by earmarking these for the expansion of public transport or infrastructure for active mobility (Creutzig et al., Citation2020). This could also explain the fact that increasing parking fees (by doubling or tripling) was rated lower than maintaining the current parking fee level.
Regarding H2 (Disruptive push measures are less likely rejected when communicated as part of a policy package that also includes complementary pull measures), the results show that negligible, but significant differences exist between the framing groups in terms of their public acceptance. Push measures in Group 1, where they were framed as part of a policy package together with pull measures, were less frequently rejected than in Group 2, where respondents did not receive any information regarding policy packaging. While we found combinations of push measures that were acceptable to both groups, clearly more combinations were acceptable to Group 1. This difference in options indicates that communicating them as part of a policy package to be implemented together with ancillary pull measures might indeed help increase the acceptance of the most restrictive measures. Regarding policy communication and framing, other research has shown that aligning presented policy information with individuals’ beliefs can increase public acceptance (Bolderdijk et al., Citation2013; Boomsma & Steg, Citation2014; Nilsson et al., Citation2016), thus indicating that communication should emphasize pull measures that clearly benefit the respective population groups. This reveals an existing tension in communication: On the one hand, policymakers need to explain the framework in which push measures are embedded to make them more acceptable and, on the other hand, the explanations need to be short and simple, for example, to be disseminated via the media.
Like Kitt et al. (Citation2021), we further found that respondents with high levels of environmental awareness demonstrated higher acceptance levels for all eight push measures and all intensity levels than respondents with lower levels of awareness. However, the relationship between environmental awareness and public acceptance does not apply uniformly to all combinations of measures, but varies depending on their design and implementation as part of the respective policy package, which partially supports H4.This is an interesting result, as previous research indicated that environmental values apply only to low-cost behaviour change, resulting in the formulation of the low-cost hypothesis (Diekmann & Preisendörfer, Citation2003). Our study findings, however, show that the push measures examined are highly disruptive and, therefore, costly. While our survey results do not directly reflect actual behaviour change – a common downside of empirical research on self-reported behavioural intentions – this still indicates that awareness-raising in public campaigns could play an important role as a complementary measure. In addition, we detected significant effects between respondents with comparably higher yearly driving ranges and those with lower levels of policy acceptance, although this depends on the included policy attributes. For example, we found that frequent drivers rated combinations without fuel price increases significantly higher than infrequent drivers, with no differences seen across intensity levels. These findings partially support H3 and indicate that those most heavily affected by the proposed policy packages show the lowest acceptance levels for such usage-dependent measures, as Huber and Wicki (Citation2021) showed for the example of road pricing. This may be due to the fact that the costs for these kinds of usage-dependent measures are more clearly visible and straightforward than for other measures, where such costs are only indirectly accessible. Regarding sociodemographic factors, we found a significant effect with respect to the respondents’ political orientation, with left-wing voters showing higher acceptance levels for the push measures, a result that agrees with that of Drews and van den Bergh (Citation2016).
This study had certain limitations. First, the perceived policy fairness and effectiveness (see Bergquist et al., Citation2022, in their recent meta-analysis on public opinion of taxes and regulations; Thaller et al., Citation2023) and the level of trust in the government (Hössinger et al., Citation2023; Kitt et al., Citation2021) are relevant factors for public acceptance; however, these factors were not included in the survey design. Furthermore, we focused on two relevant selection criteria for policies (i.e. mitigation effectiveness and resulting policy acceptance, see Axsen and Wolinetz (Citation2021)), but did not consider other criteria such as cost effectiveness or environmental consequences. At the same time, the used research design only allows us to capture hypothetical policy preferences; we cannot guarantee that all respondents understood the proposals in the same way or as intended. This might also partly explain the non-significant results for the inner-city car ban and the street redesign, where particularly for the former, different perceptions of the affected urban area could have influenced the results. Regarding the framing experiment, we also cannot eliminate the possibility that experimenter demand effects potentially affect the results. In other words, respondents may have perceived the treatment as a cue regarding what constitutes appropriate response behaviour. We attempted to reduce the possibility of eliciting this social desirability bias by not informing participants about the specific focus of the survey, e.g. by studying individual attitudes towards packaging policies (de Quidt et al., Citation2018; Mummolo & Peterson, Citation2019). Additionally, empirical evidence of framing effects is often generated through survey experiments, and these are seen as a gold standard for assessing the effectiveness of frames in altering public opinion (Badullovich et al., Citation2020; Druckman & McGrath, Citation2019). Regarding the hypothetical bias mentioned above, the annual mileage cap would particularly need to be individually designed in practice, and respondents may have found this hard to grasp when presented generically in the survey. In the selection of pull measures, one policy also dealt with reallocating more public space to alternative modes of transport, which is arguably overlapping (but not interchangeable) with the presented push measure on the reduction and redesign of street space. Finally, we conducted quota-representative research for the specific case of Austria. We believe, however, that our results are closely related to those from studies conducted in other industrialized European countries; thus, to a certain extent, they are generalizable and applicable for other countries as well.
5. Conclusions
Climate policy currently faces a dilemma around passenger transport. The climate crisis clearly indicates that a rapid and massive transition to climate neutrality is imperative, but significant changes in transport behaviour are difficult to achieve due to prevalent carbon lock-in dynamics. Furthermore, disruptive policy measures are failing to be implemented at the same time due to the fear of a lack of public acceptance. Our study highlights several relevant aspects that can help overcome the present inertia. First, we find differences in acceptability among push measures, and most prominently based on the levels of disruption, even though the public acceptance of push measures is often viewed as uniformly negative. Acceptable policy packages could include higher parking fees, car-free city centres, and street redesign measures. Second, our study also indicates a potential for communicating these push measures as part of comprehensive demand-side policy packages, where they are embedded in a set of carefully selected pull measures to increase the attractiveness of climate-friendly alternatives. Finally, we find that responses to these push measures vary across groups of society, where frequent car drivers are both the most heavily affected by proposed policy packages and show the lowest acceptance for fuel tax increases. These results underscore the need to tailor policies and communication efforts to reach different societal groups effectively, avert public resistance, and ensure a just mobility transition.
Ethics statement
This study was approved by the Ethics committee of the University of Graz in April 2021 (approval number: GZ.39/92/63 ex 2020/21).
Supplemental Material
Download PDF (1.4 MB)Acknowledgments
We thank Sara Crockett for proofreading and several anonymous reviewers as well as Dr. Jan Corfee-Morlot for their constructive feedback. The authors acknowledge the financial support by the University of Graz.
Disclosure statement
No potential conflict of interest was reported by the author(s).
Data availability statement
We preregistered the present study on the Open Science Framework (OSF) on May 11, 2021. The data set and the corresponding codes in R can be accessed using the following link: https://osf.io/h34c7.
Additional information
Funding
Notes
1 For information on the assessment and description of the pull measures, see Supplement C.1.
2 Although we originally also sampled by age group, we were unable to achieve a quota-representative distribution for this variable.
3 Note: Cases further than 2.5 times the standard deviation from the mean were excluded from this variable for plausibility reasons.
References
- Attari, S. Z., Schoen, M., Davidson, C. I., DeKay, M. L., Bruine de Bruin, W., Dawes, R., & Small, M. J. (2009). Preferences for change: Do individuals prefer voluntary actions, soft regulations, or hard regulations to decrease fossil fuel consumption? Ecological Economics, 68(6), 1701–1710. https://doi.org/10.1016/j.ecolecon.2008.10.007
- Axsen, J., Plötz, P., & Wolinetz, M. (2020). Crafting strong, integrated policy mixes for deep CO2 mitigation in road transport. Nature Climate Change, 10(9), 809–818. https://doi.org/10.1038/s41558-020-0877-y
- Axsen, J., & Wolinetz, M. (2021). Taxes, tolls and ZEV zones for climate: Synthesizing insights on effectiveness, efficiency, equity, acceptability and implementation. Energy Policy, 156, 112457. https://doi.org/10.1016/j.enpol.2021.112457
- Badullovich, N., Grant, W. J., & Colvin, R. M. (2020). Framing climate change for effective communication: A systematic map. Environmental Research Letters, 15(12), 123002. https://doi.org/10.1088/1748-9326/aba4c7
- Bain, P. G., Hornsey, M. J., Bongiorno, R., & Jeffries, C. (2012). Promoting pro-environmental action in climate change deniers. Nature Climate Change, 2(8), 600–603. https://doi.org/10.1038/nclimate1532
- Bergquist, M., Nilsson, A., Harring, N., & Jagers, S. C. (2022). Meta-analyses of fifteen determinants of public opinion about climate change taxes and laws. Nature Climate Change, 12(3), 235–240. https://doi.org/10.1038/s41558-022-01297-6
- Best, H. (2006). Die Umstellung auf ökologische Landwirtschaft als Entscheidungsprozess. VS Verlag für Sozialwissenschaften.
- Bolderdijk, J. W., Gorsira, M., Keizer, K., & Steg, L. (2013). Values determine the (in)effectiveness of informational interventions in promoting pro-environmental behavior. PLoS One, 8(12), e83911. https://doi.org/10.1371/journal.pone.0083911
- Boomsma, C., & Steg, L. (2014). The effect of information and values on acceptability of reduced street lighting. Journal of Environmental Psychology, 39, 22–31. https://doi.org/10.1016/j.jenvp.2013.11.004
- Brand, C., Götschi, T., Dons, E., Gerike, R., Anaya-Boig, E., Avila-Palencia, I., Nazelle, A. d., Gascon, M., Gaupp-Berghausen, M., Iacorossi, F., Kahlmeier, S., Int Panis, L., Racioppi, F., Rojas-Rueda, D., Standaert, A., Stigell, E., Sulikova, S., Wegener, S., & Nieuwenhuijsen, M. J. (2021). The climate change mitigation impacts of active travel: Evidence from a longitudinal panel study in seven European cities. Global Environmental Change, 67, 102224–15. https://doi.org/10.1016/j.gloenvcha.2021.102224
- Brückmann, G., & Bernauer, T. (2020). What drives public support for policies to enhance electric vehicle adoption? Environmental Research Letters, 15(9), 094002. https://doi.org/10.1088/1748-9326/ab90a5
- Chong, D., & Druckman, J. N. (2007). Framing theory. Annual Review of Political Science, 10(1), 103–126. https://doi.org/10.1146/annurev.polisci.10.072805.103054
- Creutzig, F., Javaid, A., Koch, N., Knopf, B., Mattioli, G., & Edenhofer, O. (2020). Adjust urban and rural road pricing for fair mobility. Nature Climate Change, 10(7), 591–594. https://doi.org/10.1038/s41558-020-0793-1
- de Quidt, J., Haushofer, J., & Roth, C. (2018). Measuring and bounding experimenter demand. American Economic Review, 108(11), 3266–3302. https://doi.org/10.1257/aer.20171330
- Diekmann, A., & Preisendörfer, P. (2003). Green and greenback. Rationality and Society, 15(4), 441–472. https://doi.org/10.1177/1043463103154002
- Drews, S., & van den Bergh, J. (2016). What explains public support for climate policies? A review of empirical and experimental studies. Climate Policy, 16(7), 855–876. https://doi.org/10.1080/14693062.2015.1058240
- Druckman, J. N., & McGrath, M. C. (2019). The evidence for motivated reasoning in climate change preference formation. Nature Climate Change, 9(2), 111–119. https://doi.org/10.1038/s41558-018-0360-1
- EC. (2021). Proposal for a regulation of the European Parliament and of the Council amending Regulation (EU) 2019/631 as regards strengthening the CO2 emission performance standards for new passenger cars and new light commercial vehicles in line with the Union’s increased climate ambition.
- Ejelöv, E., Harring, N., Hansla, A., Jagers, S., & Nilsson, A. (2022). Push, pull, or inform - an empirical taxonomy of environmental policy support in Sweden. Journal of Public Policy, 529–552. https://doi.org/10.1017/S0143814X21000271
- Eriksson, L., Garvill, J., & Nordlund, A. M. (2008). Acceptability of single and combined transport policy measures: The importance of environmental and policy specific beliefs. Transportation Research Part a: Policy and Practice, 42(8), 1117–1128. https://doi.org/10.1016/j.tra.2008.03.006
- Eurostat. (2022). Key figures on European transport – 2022 edition. https://ec.europa.eu/eurostat/documents/15216629/15589759/KS-07-22-523-EN-N.pdf.
- Fesenfeld, L. (2022). The effects of policy design complexity on public support for climate policy. Behavioural Public Policy, 1–26. https://doi.org/10.1017/bpp.2022.3
- Fesenfeld, L., Rudolph, L., & Bernauer, T. (2022). Policy framing, design and feedback can increase public support for costly food waste regulation. Nature Food, 3(3), 227–235. https://doi.org/10.1038/s43016-022-00460-8
- Fesenfeld, L., Sun, Y., Wicki, M., & Bernauer, T. (2021). The role and limits of strategic framing for promoting sustainable consumption and policy. Global Environmental Change, 68, 102266. https://doi.org/10.1016/j.gloenvcha.2021.102266
- Givoni, M. (2014). Addressing transport policy challenges through policy-packaging. Transportation Research Part a: Policy and Practice, 60, 1–8. https://doi.org/10.1016/j.tra.2013.10.012
- Givoni, M., Macmillen, J., Banister, D., & Feitelson, E. (2013). From policy measures to policy packages. Transport Reviews, 33(1), 1–20. https://doi.org/10.1080/01441647.2012.744779
- Graham, T., & Abrahamse, W. (2017). Communicating the climate impacts of meat consumption: The effect of values and message framing. Global Environmental Change, 44, 98–108. https://doi.org/10.1016/j.gloenvcha.2017.03.004
- Groot, J. I. d., & Schuitema, G. (2012). How to make the unpopular popular? Policy characteristics, social norms and the acceptability of environmental policies. Environmental Science & Policy, 19-20, 100–107. https://doi.org/10.1016/j.envsci.2012.03.004
- Hainmueller, J., Hopkins, D. J., & Yamamoto, T. (2014). Causal inference in conjoint analysis: Understanding multidimensional choices via stated preference experiments. Political Analysis, 22(1), 1–30. https://doi.org/10.1093/pan/mpt024
- Hamdi-Cherif, M., Li, J., & Ó Broin, E. (2021). Leveraging the transport sector to mitigate long-term climate policy costs in China: A behavioural perspective. Climate Policy, 21(4), 475–491. https://doi.org/10.1080/14693062.2020.1867491
- Hart, P. S., & Feldman, L. (2018). Would it be better to not talk about climate change? The impact of climate change and air pollution frames on support for regulating power plant emissions. Journal of Environmental Psychology, 60, 1–8. https://doi.org/10.1016/j.jenvp.2018.08.013
- Hössinger, R., Peer, S., & Juschten, M. (2023). Give citizens a task: An innovative tool to compose policy bundles that reach the climate goal. Transportation Research Part A: Policy and Practice, 173, 103694. https://doi.org/10.1016/j.tra.2023.103694
- Huber, R. A., & Wicki, M. (2021). What explains citizen support for transport policy? The roles of policy design, trust in government and proximity among Swiss citizens. Energy Research & Social Science, 75, 101973. https://doi.org/10.1016/j.erss.2021.101973
- IEA. (2023). Transport – CO2 emissions. https://www.iea.org/energy-system/transport#overview.
- Ivanova, D., Vita, G., Wood, R., Lausselet, C., Dumitru, A., Krause, K., Macsinga, I., & Hertwich, E. G. (2018). Carbon mitigation in domains of high consumer lock-in. Global Environmental Change, 52, 117–130. https://doi.org/10.1016/j.gloenvcha.2018.06.006
- Kitt, S., Axsen, J., Long, Z., & Rhodes, E. (2021). The role of trust in citizen acceptance of climate policy: Comparing perceptions of government competence, integrity and value similarity. Ecological Economics, 183, 106958. https://doi.org/10.1016/j.ecolecon.2021.106958
- Kivimaa, P., Laakso, S., Lonkila, A., & Kaljonen, M. (2021). Moving beyond disruptive innovation: A review of disruption in sustainability transitions. Environmental Innovation and Societal Transitions, 38, 110–126. https://doi.org/10.1016/j.eist.2020.12.001
- Leeper, T. J., Hobolt, S. B., & Tilley, J. (2020). Measuring subgroup preferences in conjoint experiments. Political Analysis, 28(2), 207–221. https://doi.org/10.1017/pan.2019.30
- Levi, S. (2021). Why hate carbon taxes? Machine learning evidence on the roles of personal responsibility, trust, revenue recycling, and other factors across 23 European countries. Energy Research & Social Science, 73, 101883. https://doi.org/10.1016/j.erss.2020.101883
- Long, Z., Kitt, S., & Axsen, J. (2021). Who supports which low-carbon transport policies? Characterizing heterogeneity among Canadian citizens. Energy Policy, 155, 112302. https://doi.org/10.1016/j.enpol.2021.112302
- Maier, R., Posch, A., Proß, C., Plakolb, S., & Steininger, K. W. (2023). Cutting social costs by decarbonizing passenger transport. Transportation Research Part D: Transport and Environment, 122, 103878. https://doi.org/10.1016/j.trd.2023.103878
- Mummolo, J., & Peterson, E. (2019). Demand effects in survey experiments: An empirical assessment. American Political Science Review, 113(2), 517–529. https://doi.org/10.1017/S0003055418000837
- Nikodinoska, D., & Schröder, C. (2016). On the emissions–inequality and emissions–welfare trade-offs in energy taxation: Evidence on the German car fuels tax. Resource and Energy Economics, 44, 206–233. https://doi.org/10.1016/j.reseneeco.2016.03.001
- Nilsson, A., Hansla, A., Heiling, J. M., Bergstad, C. J., & Martinsson, J. (2016). Public acceptability towards environmental policy measures: Value-matching appeals. Environmental Science & Policy, 61, 176–184. https://doi.org/10.1016/j.envsci.2016.04.013
- Ohlendorf, N., Jakob, M., Minx, J. C., Schröder, C., & Steckel, J. C. (2021). Distributional impacts of carbon pricing: A meta-analysis. Environmental and Resource Economics, 78(1), 1–42. https://doi.org/10.1007/s10640-020-00521-1
- Plötz, P., Axsen, J., Funke, S. A., & Gnann, T. (2019). Designing car bans for sustainable transportation. Nature Sustainability, 2(7), 534–536. https://doi.org/10.1038/s41893-019-0328-9
- R Core Team. (2020). R: A Language and Environment for Statistical Computing. https://www.R-project.org/.
- Statista. (2023). Distribution of carbon dioxide emissions worldwide in 2022, by sector. https://www.statista.com/statistics/1129656/global-share-of-co2-emissions-from-fossil-fuel-and-cement/.
- Stevenson, K. T., King, T. L., Selm, K. R., Peterson, M. N., & Monroe, M. C. (2018). Framing climate change communication to prompt individual and collective action among adolescents from agricultural communities. Environmental Education Research, 24(3), 365–377. https://doi.org/10.1080/13504622.2017.1318114
- Thaller, A., Fleiß, E., Brohmer, H., Köstenbaumer, D., Posch, A., & Athenstaedt, U. (2023). When perceived fairness and acceptance go hand in hand–Drivers of regulatory and economic policies for low-carbon mobility. PLOS Climate, 2(5), e0000157. https://doi.org/10.1371/journal.pclm.0000157
- Thaller, A., Posch, A., Dugan, A., & Steininger, K. (2021). How to design policy packages for sustainable transport: Balancing disruptiveness and implementability. Transportation Research Part D: Transport and Environment, 91, 102714. https://doi.org/10.1016/j.trd.2021.102714
- Umweltbundesamt. (2023). Klimaschutzbericht 2023. https://www.umweltbundesamt.at/fileadmin/site/publikationen/rep0871.pdf.
- Unruh, G. (2000). Understanding carbon lock-in. Energy Policy, 28(12), 817–830. https://doi.org/10.1016/S0301-4215(00)00070-7
- van Essen, H., van Wijngaarden, L., Schroten, A., Sutter, D., Bieler, C., Maffii, S., Brambilla, M., Fiorello, D., Fermi, S., Parolin, S., & El Beyrouty, K. (2020). Handbook on the external costs of transport: version 2019–1.1. https://data.europa.eu/doi/10.283251388.
- Wang, Q., Hubacek, K., Feng, K., Wei, Y.-M., & Liang, Q.-M. (2016). Distributional effects of carbon taxation. Applied Energy, 184, 1123–1131. https://doi.org/10.1016/j.apenergy.2016.06.083
- Whitmarsh, L., Poortinga, W., & Capstick, S. (2021). Behaviour change to address climate change. Current Opinion in Psychology, 42, 76–81. https://doi.org/10.1016/j.copsyc.2021.04.002
- Wicki, M., Fesenfeld, L., & Bernauer, T. (2019). In search of politically feasible policy-packages for sustainable passenger transport: Insights from choice experiments in China, Germany, and the USA. Environmental Research Letters, 14(8), 084048. https://doi.org/10.1088/1748-9326/ab30a2
- Wicki, M., Huber, R. A., & Bernauer, T. (2020). Can policy-packaging increase public support for costly policies? Insights from a choice experiment on policies against vehicle emissions. Journal of Public Policy, 40(4), 599–625. https://doi.org/10.1017/S0143814X19000205