
 ?Mathematical formulae have been encoded as MathML and are displayed in this HTML version using MathJax in order to improve their display. Uncheck the box to turn MathJax off. This feature requires Javascript. Click on a formula to zoom.
ABSTRACT
Existing literature on the sustainability transition towards a low-carbon economy provides conceptual frameworks for designing combinations of policy interventions but lacks empirical evidence regarding their application. This paper aims to test whether a mix of policy instruments represents a potential valid solution to manage carbon abatement effectively. We refer to the European Union Emissions Trading System (EU ETS) as an example of demand-pull environmental policy, while we include the Structural and Cohesion Funds (SCFs) and the Horizon 2020 funds as examples of technology-push policies. Through the application of a panel event study, we find that the EU ETS generates a positive impact on environmental patent applications in the light manufacturing sector during the period 2013–2020, while EU ETS participation and financial support contribute to environmental innovation and CO2 emission reduction in the energy sector. Hence, those sectors where market dynamics allow avoidance of complete internalization of the carbon price may benefit from financial support to re-direct the technological change towards the sustainability transition. We demonstrate that the analysed policy mix contributed to a reduction of about 2.2% of total emissions produced by energy firms in the EU ETS during Phase III, which is in line with EU climate targets. Overall, our work may support policymakers in understanding the relevant factors that affect the impact of the policy mix on the environmental transition.
Key policy insights
A Demand-pull policy instrument like EU ETS fosters patent applications of firms with limited cost pass-through options, particularly in the light manufacturing sector.
A policy mix of EU ETS and regional development funds is required to effectively improve the environmental innovation of firms that can easily transfer the costs of CO2 emissions to the final users, such as in the energy sector.
The interaction of regional development policies and innovation policies crowds in additional investments and catalyses R&D activities, contributing to environmental innovation for EU ETS firms.
1. Introduction
Sustainability transitions are extensive, multi-faceted transformation processes through which well-established socio-technical systems evolve towards more sustainable modes of production and consumption (Lindberg et al., Citation2019; Markard et al., Citation2012; Rogge & Reichardt, Citation2016). The sustainability transition requires complex technological change, and single policy instruments cannot adequately drive such a structural transformation (Milhorance et al., Citation2020). A policy mix, constituting the set of interactions and interdependences between different policy instruments, represents a valid approach to address key priorities in the policymakers’ agenda, such as climate change, natural resources depletion, and environmental degradation (European Commission, Citation2018; Flanagan et al., Citation2011; IPCC, Citation2014).
Alternative laissez-faire approaches may produce unintended consequences, with the quality of natural ecosystems falling below critical thresholds due to intensive exploitation of dirty technologies (Acemoglu et al., Citation2012). However, the design of optimal environmental regulatory frameworks is complex, as different factors may affect the direction of the technological change and the type of needed policy intervention (Huppes et al., Citation2017). For instance, while carbon taxes may be sufficient to re-direct innovation towards the green transition in cases of wide usage of exhaustible resources and high elasticity of substitution between dirty and green technologies, a more complex combination of policy instruments may be required in cases of a significant development gap between the two technologies (Acemoglu et al., Citation2014; Acemoglu et al., Citation2016).
However, a clear comprehension of the impact of policy packages designed at national and international levels to stimulate the sustainability transition towards a low-carbon economy is still lacking (Ulibarri et al., Citation2022). First, it is still not evident whether different regulatory frameworks generate positive synergies, strengthening the credibility of single instruments, or if, instead, they tend to overlap, producing conflicts in their interaction and weakening the overall environmental impact (Åhman et al., Citation2017; Fais et al., Citation2015; Oikonomou et al., Citation2014; Van den Bergh et al., Citation2021).
Second, the bulk of extant research is constituted by conceptual studies and theoretical frameworks on the policy mix, and different scholars have argued that the current impasse on policy contribution to environmental innovation is partially due to the lack of empirical works (Flanagan et al., Citation2011; Mavrot et al., Citation2019; Rogge & Reichardt, Citation2016; Schmidt & Sewerin, Citation2019). Few exceptions are represented by Peters et al. (Citation2012), Veugelers (Citation2012) and Costantini et al. (Citation2017), who obtained mixed results on the most effective combinations of instruments to foster environmental innovation.
Finally, empirical studies do not extract practical guidelines to support policymakers in properly understanding the development dynamics of technological innovation systems (Bergek et al., Citation2008). Moreover, they suffer from the fact that they often analyse a single policy instrument only, rely on survey data that are not disclosed by official international statistical offices, focus on a single country and study-specific niche sub-sectors, thus limiting the possibility to generalize the results (Cantner et al., Citation2016; Guerzoni & Raiteri, Citation2015; Rogge et al., Citation2011; Rogge & Hoffmann, Citation2010; Rogge & Schleich, Citation2018).
Against this background, we investigate the impact of different types of policies aiming to foster environmental innovation, focusing on two broad categories of public intervention: demand-pull and technology-push instruments (Dai & Xue, Citation2015; Nemet, Citation2009). We analyse the European Union Emissions Trading System (EU ETS), which constitutes a prominent example of demand-pull policy instruments in the environmental sector, representing the cornerstone of the European Commission (EC) climate policy and covering about 45% of European Union’s Green House Gases (GHG) emissions. In terms of technology-push policies, we take into account the two most relevant programmes of financial support at the EU level, namely the ‘Structural and Cohesion Funds’ (SCFs) and ‘Horizon 2020’ (H2020), constituting the main pillar of EU Cohesion Policy and the largest funding programme for research and innovation aiming to tackle climate change, respectively.
Relying on a unique dataset covering the environmental performances in terms of patent applications and carbon emissions of European firms, we disentangle the impact of alternative policy mix instruments on environmental results over the time frame 2013–2020. Through the application of a panel event study framework (Callaway & Sant’Anna, Citation2021), we demonstrate that the effect of the EU ETS is heterogeneous across sectors with stronger benefits for firms established in sectors characterized by higher international competition and the absence of the cost pass-through mechanism. Furthermore, we highlight that the policy mix has an additional positive impact with respect to demand-pull instruments on environmental innovation and CO2 emissions reduction only for firms established in the energy and heavy manufacturing sectors.
The paper is structured as follows: Section 2 describes the different types of environmental policies that are analysed and introduces the research framework and hypotheses. Section 3 explains the data and the methodology employed for the empirical analysis. Section 4 highlights and discusses the main findings, while Section 5 concludes.
2. Research framework and hypotheses
Our research framework aims to investigate the relationship between the policy mix and environmental performances at the firm level. In terms of policy instruments, we focus on two broad categories of public interventions: demand-pull and technology-push measures (see ).
Figure 1. Research framework.
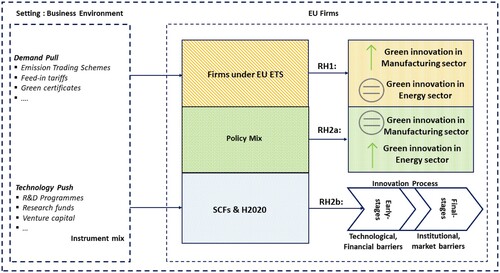
2.1. Demand-pull policies
Demand-pull policies indicate instruments that stimulate the adoption of innovation on the demand side or standard-setting measures and regulatory frameworks aiming to constrain the usage of pollution-intensive technologies and reduce the uncertainty on the adoption of clean innovation (Edler et al., Citation2012; Jaffe et al., Citation2002; Peters et al., Citation2012). They include regulatory instruments such as feed-in tariffs, tax incentives for final users, green procurement policies and emission trading schemes aiming to create a protected niche market where innovative clean technologies can compete with incumbent dirty technologies that have cost advantages due to negative externalities and consolidated path-dependencies (Cox & Edwards, Citation2019; Nill & Kemp, Citation2009; Rogge & Reichardt, Citation2016).
In terms of demand-pull policy, we analyse the impact of the EU ETS. It is the largest carbon market, and it relies on the ‘cap and trade’ principle (Ellerman et al., Citation2020). Firms under this regulation cannot emit in aggregate an amount of GHGs higher than a cap, which is reducing in time to stimulate carbon abatement. Firms can trade carbon allowances, which represent the right to emit one tonne of CO2 (or its equivalent). Robust allowances prices provide, therefore, a relevant economic rationale for policy-led demand for investments in clean and low-carbon intensive technologies.
Doubts on the correct design of the EU ETS mechanism arise because it may allow firms to implement ‘cost pass-through’ practices, preventing a full internalization of the carbon price into production costs (Neuhoff & Ritz, Citation2019). The cost pass-through is defined as the extent to which the rise in production costs associated with a growth in CO2 emission costs can be directly transferred to the client through an increase in the output price. Different factors may affect the intensity of the cost transfer. First, higher competition is expected to be associated with a lower opportunity for cost pass-through, as firms cannot easily increase the output price without losing market share (Wang & Zhou, Citation2017). Second, strictly regulated markets are exposed to a lower risk of cost transfer since final prices might be controlled (Sijm et al., Citation2012). Conversely, the cost pass-through tends to be more present in case of less fragmented markets, price inelastic demand and information asymmetries (Cludius et al., Citation2020; Sijm et al., Citation2012).
For such reasons, the cost pass-through is expected to be high for the energy sector. Indeed, it is naturally characterized by high-frequency changing prices that make it easier for energy producers to justify small daily price variations. Moreover, the energy sector represents an oligopoly facing a price inelastic demand facilitating output price adjustments with a low risk of losing clients (Neuhoff & Ritz, Citation2019). Consistently with economic theory, empirical evidence shows a solid consensus on the high-cost transfer in the energy sector. Sijm et al. (Citation2006) estimate pass-through rates between 60% and 100% of CO2 cost for this sector in Germany and the Netherlands. Conversely, empirical evidence on the cost pass-through is less conclusive for other sectors. Cludius et al. (Citation2020) estimate significant cost transfer for the petrochemical, fertilizers and refineries sectors, while lower values are found for the cement, iron and steel, and glass sectors. Similarly, Alexeeva-Talebi (Citation2011) identifies a wide range of cost pass-through rates from 0% to 75% for the chemical sector, from 24% to less than 60% in the glass sector and equal to 0% in the paper sector. Based on these insights, we postulate our first research hypothesis (see also ):
RH1: The impact of the EU ETS on environmental innovation is heterogeneous across sectors and more significant for the manufacturing sector that may not implement the cost pass-through mechanism to avoid a full internalisation of carbon cost price.
2.2. Technology-push policies
Technology-push policies are measures such as innovation funds, R&D financial support programmes, venture capital instruments and fiscal incentives that foster firms’ advances in science and technology from the supply side (Dimos et al., Citation2022; Nemet, Citation2009).
We focus on two prominent programmes of financial support at the EU level. The first is H2020, which, with a budget of around 80 billion € over the time frame 2014–2020, represents the largest ever implemented funding programme for research and innovation aiming to support climate action. The second is SCFs, which constitute a cornerstone of EU Cohesion policy. We restrict our analysis to the portion of SCFs devoted to the sustainable transition, being a key priority area targeted by different thematic objectives (TO) such as low carbon economy (TO 4), adaption to climate change, risk prevention (TO 5) and improving environmental protection and resource efficiency (TO 6). Overall, around 78 billion €, corresponding to more than 20% of the EU Cohesion Policy budget, has been allocated to support the sustainability transition.
The EU Cohesion Policy had a positive impact on the environmental sector in terms of water supply, public sanitation, waste collection and the share of renewable energy sources (Medeiros, Citation2014). Furthermore, it allowed the implementation of projects with positive environmental effects despite the limited financial performances (Florio et al., Citation2018). Nonetheless, there is still an open debate on the extent to which the EU Cohesion Policy stimulates further investments and R&D activities in the environmental sector without simply substituting alternative funding sources (Bachtler et al., Citation2017; Crescenzi et al., Citation2020; Mairate, Citation2006).
Empirical evidence shows that the crowding in effect of public funds is more relevant during the early stages of the innovation process when firms should invest in high-risk exploration activities. Indeed, private financial markets may not provide adequate financial support to projects targeting the sustainability transition that may be perceived as too uncertain during the initial phases (Geddes & Schmidt, Citation2020; Polzin, Citation2017). Therefore, public finance raises expectations on future technology development trajectories due to a commitment from public international institutions to the development of clean technologies that encourage capital attraction at reasonable costs from different private investors.
Overall, as reported in , technology-push instruments should trigger the innovation process to stimulate initial R&D activities and promote crowding in mechanisms, allowing projects to successfully manage the following innovation process phases (Geddes & Schmidt, Citation2020; Vogl et al., Citation2021). Based on these insights, we postulate the following research hypotheses:
RH2a: SCFs and H2020 have a significant impact on firms’ environmental performances in the energy sector, where the cost transfer may prevent firms from fully internalizing carbon costs, thus reducing the innovation effects of a demand-pull policy.
RH2b: The mechanism explaining the effect postulated in H2a is represented by an increase in R&D activities conducted by beneficiaries of SCFs and H2020 funds that contribute to activating virtuous innovation processes that could not be performed with the same intensity in the absence of such initiatives of financial support.
3. Data and methods
To assess the impact of alternative policy combinations on environmental innovation, we adopt the panel event study recently introduced by Callaway and Sant’Anna (Citation2021). It represents a robust econometric model for the analysis of the causal impact of policy interventions since it enables testing for the parallel trend assumption, thus providing the possibility to check that the treated and control units experience similar dynamics before the implementation of the analysed policy. This should allow us to demonstrate that the estimated effect is due to the analysed policy discontinuation and not due to other confounding factors. Furthermore, this approach is suitable for empirical settings where firms enter the treatment at different years (staggered treatment adoption). Finally, it solves some issues of the traditional Difference in Differences (DiD) linear regression, such as the ‘negative weight problem’ and the parameters estimation that is particularly sensitive to the group size, treatment timing and overall number of analysed time periods (De Chaisemartin & d’Haultfoeuille, Citation2020; Goodman-Bacon, Citation2021).
In particular, defining Gi as the year in which unit i is treated for the first time (Gi = year t: ) and Gi,g = 1{Gi = g}, we estimate the average treatment on treated (ATT) based on the following equation:
(1)
(1) where
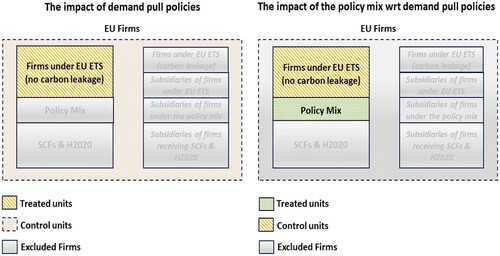
is our treatment variable that is equal to 1 if unit i is treated in year t and 0 otherwise.Footnote1 Treated units are firms subject to the EU ETS regulatory framework when we aim to estimate the impact of demand-pull policies (yellow area in the left panel in ). We remove from the treated group those EU ETS firms that are at risk of carbon leakageFootnote2, meaning that they are established in sectors that may relocate their business activities to countries with laxer emission constraints due to the additional costs related to EU climate policies (top grey area in the left panel in ). Since installations in these sectors received during Phase III a free allowances allocation equivalent to 100% of the most efficient benchmark (European Commission, Citation2014), we exclude such firms from our analysis. Indeed, free allowances represent compensation for carbon costs that can also be interpreted as a financial contribution to foster environmental innovation and prevent the transfer of business activities in a different jurisdiction (Juergens et al., Citation2013; Teixidó et al., Citation2019). Considering that such support is more in the spirit of technology-push policies, we remove firms in carbon leakage sectors when we aim to disentangle the impact of demand-pull policies as they are more in line with an example of policy mix. In this scenario, control units are represented by EU firms that, over the analysed time frame, were not liable entities under the EU ETS scheme and did not receive funds from programmes of financial support such as SCFs and H2020 (light red area in the left panel in ).
Figure 2. The figure shows the treated and control groups when we analyse the impact of demand-pull and policy mix instruments.
Yt is our dependent variable observed in year t, represented by the natural logarithm in the number of cumulative patent applications. We employ this variable as the distribution of patents tends to be highly skewed, with few firms accounting for the largest number of overall patents (Harhoff et al., Citation2003; Jaffe et al., Citation2002). Under this empirical setting, the ATT can be interpreted as the percentage by which, on average, patent applications of firms under the EU ETS is higher or lower with respect to those of firms that are not subject to this regulatory framework.
When we analyse the effects generated by the policy mix, treated units are firms under the EU ETS and receiving either SCFs or H2020 funds (green area in the right panel in ). Control units are represented by firms not receiving financial support from SCFs and H2020 but being liable entities under the EU ETS (yellow area).Footnote3 In all cases, we exclude from the control group also subsidiaries of firms in the EU ETS and of firms receiving SCFs and H2020 funds as potential spillovers may confound our results.
Moreover, when we analyse the impact of the policy mix, as a dependent variable, we consider not only the natural logarithm in the number of cumulative patent applications but also employ firms’ carbon intensity, defined as the natural logarithm of the ratio between CO2 emissions and total assets, as an alternative proxy of environmental performance. Here, the ATT can be interpreted as the percentage by which, on average, patent applications or carbon intensity of firms experiencing a policy mix is higher or lower with respect to firms that are subject to the EU ETS only.
Since the environmental innovation process might differ across sectors depending on the level of firms’ energy intensity, we perform some heterogeneity analyses distinguishing among sectors where firms are established. In particular, we consider a more general case accounting for firms in All sectors, and then we focus specifically on the Manufacturing and Energy sectors. Since our main analysis excludes firms in carbon leakage sectors, when we refer to the manufacturing sector, we basically consider Light Manufacturing activities. A discussion about the differences in the impact of the policy mix between Light and Heavy Manufacturing sectors is reported in Section SM4.
Finally, Xt corresponds to a vector of control variables accounting for a set of financial dimensions. In particular, we consider total assets, intangible assets, financial leverage, long-term debt, current assets and liabilities, current ratio, and return on equity (ROE).
We also estimate additional summary measures of the causal impact of the analysed policy. Specifically, provides information on the average effect of participating in the treatment when firms are observed exactly e years away from the start of the treatment. Moreover,
is an aggregated average of the treatment effect across all groups and years, thus summarizing the policy impact over the whole analysed time frame. In formula:
(2)
(2)
(3)
(3) where
are weighting functions representing the size of each set of units observed in a specific year t and belonging to group g. Although the estimator
allows us to test for the condition of pre-treatment parallel trends, before estimating Equation (1), we apply a Propensity Score Matching (PSM) procedure to restrict the analysis to a set of firms with similar observable characteristics. This approach should further increase the internal validity of our analysis ensuring that we are considering comparable treated and control units. We use the same set of variables contained in the vector of control variables Xt introduced in Equation (1) to identify comparable treated and not-treated units.
Finally, we are also interested in explaining the mechanism that may drive the additional impact of the policy mix with respect to only demand-pull policy on environmental innovation. As stated in Section 2 in the research hypothesis RH2b, we suspect that SCFs and H2020 funds trigger additional R&D activities that may contribute to generating environmental innovation. For this reason, we apply the following panel regression model:
(4)
(4) where
is our dependent variable,
is our regressor of interest,
is the same vector of control variables introduced in Equation (1),
are firm and year fixed effects, and
is the idiosyncratic term.
Section SM1 provides a detailed description of our sample that integrates heterogeneous data sources concerning firms variables about environmental, financial and innovation dimensions. Table SM1.1 provides a summary of the definition and sources of the different variables employed in our empirical analysis. Table SM1.2 reports descriptive statistics. Finally, Tables SM1.3, SM1.4 and SM1.5 show additional details related to the set of 2-digits NACE rev.2 sectors covered by our study and disclose descriptive statistics on patents and emissions at the sectoral level.
4. Results
In this Section, we show the results of our empirical analysis. More specifically, Section 4.1 investigates the impact of demand-pull policies on environmental innovation during Phase III of the EU ETS (RH1). Section 4.2 analyses how the policy mix contributes to CO2 reduction and green innovation (RH2a). Furthermore, it investigates the mechanism through which a combination of technology-push and demand-pull instruments could generate better environmental innovation performances in recipient firms (RH2b).
4.1. Demand-pull policies: the impact of EU ETS during Phase III
The EU ETS has a limited positive impact on green innovation when we consider firms in all sectors during the time frame 2013–2020 (see ). Indeed, the ATT aggregate coefficient is positive and statistically significant only at a 90% confidence level in our sample for the unconditional case (it is not significant for the conditional estimation, see Table SM2.1), thus providing evidence of a limited contribution of such policy to the diffusion of clean technologies, in line with Rogge et al. (Citation2011), Schmidt et al. (Citation2012) and Cainelli et al. (Citation2020).
Figure 3. We show the dynamic ATT estimated as described through Equation (2). It shows the impact of EU ETS on patent applications of firms entering for the first time in EU ETS during Phase III (2013–2020) when considering All, Light Manufacturing and Energy sectors, respectively.
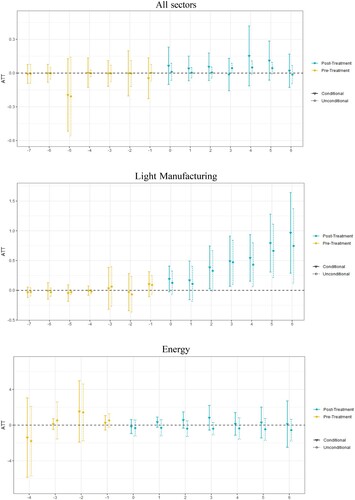
However, this finding is the result of heterogeneous effects across sectors. Indeed, we find a significant impact of EU ETS on innovation performances of firms established in light manufacturing sectors, experiencing a higher patent applications rate between 0.4% and 0.5% with respect to comparable firms that are not subject to the same regulation. Interestingly, such effect is not immediate, as the ATT dynamic coefficient tends to become significant after 2 years from firms’ entrance into the EU ETS mechanism, with progressive growth in the policy impact until year 6. This result is coherent with a vast portion of the literature claiming that innovation policies may require time before producing tangible effects and effective solutions (Courvisanos, Citation2009; Prettner & Werner, Citation2016; Weber & Rohracher, Citation2012).
This result can be in part explained by the fact that firms established in light manufacturing sectors cannot rely on the cost transfer mechanism to avoid a full internalization of carbon costs. Indeed, energy intensive firms in the manufacturing sector cannot easily transfer the extra carbon cost on the final output price, due to the high level of international competition, high product substitutability and price elastic demand (Clò, Citation2010; Cludius et al., Citation2020; Guo & Gissey, Citation2021; Ma et al., Citation2021). As a consequence, due to the absence of valuable alternatives, these firms are likely to include the opportunity costs associated with carbon allowances in their investment decisions. Hence, the EU ETS can stimulate these participants to improve efficiency through the introduction of new clean technologies fostering carbon abatement.
On the other hand, we do not find a relevant contribution of the EU ETS on environmental innovation performances of firms in the energy sector both in the short- and long-term perspectives, as suggested by never statistically significant coefficients for the aggregate ATT and ATT dynamic coefficients. Such evidence is consistent with our research hypothesis RH1 and can be related to the higher possibility of firms in the energy sector implementing the cost pass-through mechanism to avoid a negative impact of the carbon price growth on their financial results. Sections SM2.1 and SM2.2 report further analyses confirming that the cost pass-through significantly affects the impact of demand-pull policies on environmental innovation, focusing on those sub-sectors and countries where the empirical evidence provides signals of a lower transfer of carbon extra costs to final users.
Finally, as shown in Table SM2.1, there are no statistically significant coefficients for the ATT dynamic for e ≤ 0, thus suggesting the absence of pre-treatment trends. This means that our results are not driven by different patent application trajectories in the years before the start of the treatment.
4.2. The impact of the policy mix
presents the main results of the joined impact of EU ETS, SCFs and H2020 funds on patent applications with respect to firms participating in the EU ETS only. When we consider firms across all sectors, we find that the policy mix has a weakly positive impact on environmental innovation, with an aggregate ATT coefficient significant only at a 90% level of confidence. Consistently, estimates of conditional ATT dynamic coefficients are not significant with the only exceptions of years 1 and 2, suggesting that not necessarily a combination of policy instruments generates a better environmental innovation outcome.
Figure 4. We show the dynamic ATT estimated as described through Equation (2). It shows the impact of policy mix on patent applications of firms entering for the first time in EU ETS during Phase III (2013–2020) when considering All, Light Manufacturing and Energy sectors, respectively.
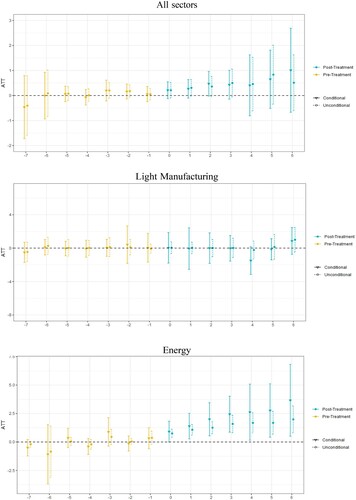
Estimates conditional on control variables unveil an absence of effects of the policy mix for firms established in the light manufacturing sectors, as both the aggregate ATT and ATT dynamic coefficients do not tend to be statistically significant. This result is not surprising, when one considers that firms in these sectors experience a relevant improvement in their patent applications when they are treated by the EU ETS, as shown in Section 4.1.
Conversely, we find a strong and significant impact for the energy sector, with EU programmes of financial support increasing patent applications between 1.4% and 2.2%. Consistently, all coefficients between year 0 and year 6 are positive and statistically significant, confirming the capability of the policy mix to stimulate environmental innovation in the energy sector.
Interestingly, the magnitude of the coefficients tends to progressively increase in the years after firms start receiving these funds, suggesting that they create long-term positive effects that require some years before generating a more intensive and effective innovation. Our results do not suffer from pre-treatment trends, as the ATT dynamic coefficients for e ≤ 0 are not statistically significant. Furthermore, as most of the estimates of and
shown in Table SM3.2 are homogeneous, we can conclude that our results are not significantly dependent on innovation performances of firms entering the treatment in a specific year, neither they are driven by patent applications growth observed in a specific year.
In a second step, we verify the robustness of our results using as an alternative dependent variable the logarithmic ratio between CO2 and total assets. Figure SM3.1 highlights effects that are largely consistent with our estimates on patent applications.
Indeed, we find that the policy mix fosters the sustainability transition in the energy sector with a reduction of carbon intensity between 0.1% and 1.4%. ATT dynamic coefficients are statistically significant at all years between 0 and 6, and the progressive increase in the magnitude of the coefficients potentially suggests long-term effects. Such results are coherent with RH2a and can be motivated by the low impact that the EU ETS mechanism alone has on firms established in the energy sector due to, e.g. possible cost pass-through practices. Conversely, we find evidence that when these firms receive financial support for financing R&D activities with environmental purposes, they significantly increase both patent applications and reduce CO2 emissions. This result is consistent with previous evidence obtained by Lehmann and Gawel (Citation2013) highlighting the effectiveness of a policy mix where support schemes for electricity generation from renewable energy sources (RES-E) complement the EU ETS to mitigate climate change. Indeed, in the absence of adequate financial support, the EU ETS may provide limited signals in favour of clean technological development, with green innovation that may be mainly driven by technological spillovers (Grubb & Ulph, Citation2002).
Notice that these effects do not explicitly take into account the impact of potential new clean technologies developed in sectors and countries not covered by the EU ETS that may contribute to reducing the carbon intensity of our analysed set of firms. This is in line with current literature, where the link between environmental performance and technological innovation is well established, but still, few empirical works are able to account for such spillovers in their causal framework analysis (Carrion-Flores & Innes, Citation2010; Corradini et al., Citation2014). Although we do not include an indicator mapping potential innovation spillovers, our causal framework analysis is designed to reasonably capture the impact of the specific analysed combination of demand-pull and technology-push instruments. Indeed, our study is based on a robust DiD, netting out alternative common confounding factors such as innovation dynamics in different sectors and countries affecting in a similar way treated and control units in the pre-treatment time window and during the treatment period. Furthermore, the presence of parallel trends and the low variability of group and calendar years coefficients (see and
in Table SM3.3) confirm that our results are stable and not driven by specific technological breakthroughs occurring outside the EU ETS perimeter.
Section SM4 performs a specific analysis for firms subject to the policy mix (EU ETS and SCFs or H2020 funds) in carbon leakage sectors. This allows us to analyse not only the Light but also the Heavy manufacturing sectors. Our results are in line with the evidence provided in and SM3.1 when we considered the light manufacturing sectors not included in the carbon leakage sectors. Conversely, we find that SCFs and H2020 have a strong effect both in terms of growth in patent applications and CO2 emissions reductions for heavy manufacturing sectors (see lower panels in Figures SM4.1 and SM4.2). This result suggests that in particularly carbon-intensive sectors, where environmental innovation may require relevant investments, free allowances may not adequately support firms’ sustainability transition, while financial support, such as SCFs and H2020 funds, may be helpful to stimulate better environmental performances (Bataille, Citation2020; Nilsson et al., Citation2021; Tanaka, Citation2011).
We further discuss the extent to which the analysed set of policy interventions may contribute to achieving the environmental targets established by the European Commission. The upper panel in Figure SM5.1 shows a different dynamic in terms of carbon intensity between energy firms under the EU ETS and those subject to the policy mix. We observe that firms experiencing a combination of technology-push and demand-pull policies display a stronger reduction of the logarithm of the ratio between CO2 emissions and total assets (−0.35% vs. −1.12%). Notice how the magnitude of the difference between the carbon intensity dynamic of the two groups (around −0.77%) is very close to the obtained from the model shown in Figure SM3.1 and equal to −0.75.
EU ETS firms are required by regulators and stakeholders to design appropriate actions to contain carbon emissions (Hoffman, Citation2005; Kolk & Pinkse, Citation2005; Laing et al., Citation2014), with those investing in low-carbon projects that tend to benefit from financial incentives, the containment of long-term operational costs and the commitment with the existing regulation, while high-polluting firms appearing more exposed to future environmental liabilities (Busch & Hoffmann, Citation2011; Reinhardt & Stavins, Citation2010). As discussed in Flori et al. (Citation2024), firms with lower emissions intensity are associated with higher financial performances, while those showing limited financial resources may find cap-and-trade schemes difficult to manage. Forms of financial subsidies could be of support, e.g. for the latter firms to improve their environmental performance within the EU ETS.
Based on such consideration, we simulate the total savings in terms of CO2 emissions due to the policy. Saved emissions are computed assuming that the set of firms under the policy mix would experience a carbon intensity following the same pattern observed for energy firms receiving neither SCFs nor H2020 funds over the period 2014–2020. Overall, we obtain savings equal to about 175 million tonnes of CO2 emissions. Such a figure corresponds to a reduction equal to 2.2% with respect to total emissions produced by energy firms under the EU ETS during Phase III.
This is particularly relevant considering that based on Eurostat estimates, the energy sector contributed 19.1% of total GHGs emissions in 2020, second only to the manufacturing sector (21.9%).Footnote4 Extant literature has discussed the extent to which countries should reduce their total emissions to comply with alternative environmental scenarios (Den Elzen et al., Citation2019; Roelfsema et al., Citation2020; Rogelj et al., Citation2016). For instance, as discussed by the European Commission (Citation2020) and Pisani-Ferry and Mahfouz (Citation2023), EU countries need to accelerate their carbon abatement rate from the current −1.3% experienced over the period 2005–2019 to −2.7% to achieve the target of reducing GHG emissions by 55% by 2030 relative to 1990 levels. Similarly, E3Mlab and IIASA (Citation2016) and Fragkos et al. (Citation2017) developed policy scenarios to satisfy 2030 climate objectives and carbon neutrality by 2050 with alternative targets in terms of energy efficiency, highlighting how nationally determined contributions (NDC) should be translated into yearly reduction rates of GHG emissions between −3.5% and −2.2% for EU28 countries. Liu and Raftery (Citation2021) highlight that at the global level the country-based emission rate should decrease from the current −1.0% to −1.8% to keep global warming below 2 degrees by 2100. Although estimates of the annual emissions reduction rate at the country level based on the severity of the considered scenarios tend to be typically in the range between −7.6% and −1.0% and our results cannot be immediately translated in a measure comparable with these figures (since we are considering only a subset of produced CO2), our estimates indicate that the policy mix seems to significantly contribute to fostering carbon abatement, especially for high emitting firms.
4.2.1. The mechanism of the policy mix
As a final step, we investigate a simple mechanism that may induce recipient firms of programmes of financial support to have better environmental performances. Since we find a positive effect of SCFs and H2020 funds on firms in the energy sector, we restrict this analysis to them. We assume that such funds may be allocated to activities related to R&D that may foster patent applications and CO2 emissions reduction. We then estimate the panel fixed effects model described in Equation (4). Our results provide evidence of a positive relationship between intangible assets and environmental innovation, with a 1% growth in intangible assets associated to 0.4% raise in patent applications. Consistently, we find that an increase in intangible assets contributes to a significant reduction of CO2 emissions with an elasticity equal to −0.2 ().
Table 1. The impact of intangible assets on patent applications and CO2 emissions.
These results support our research hypothesis RH2b and are coherent with other studies identifying public subsidies as relevant instruments to alleviate financial constraints and trigger R&D activities and potentially environmental innovation (Bocken, Citation2015). In a society that is emphasizing the need for a sustainability transition, it is reasonable to find that SCFs and H2020 mainly contribute to R&D activities connected with climate change, environmental innovation and carbon abatement.
We further analyse this mechanism by observing the pattern of intangible assets for treated and not-treated units over the analysed time frame. To do so, we divide treated units with respect to the year in which they start to receive funds and we compare the distribution of intangible assets of beneficiaries of SCFs and H2020 funds with that of control units before and after the start of the treatment. As shown in Table SM6.1 and Figure SM6.1 through a set of t-tests, we find that in the majority of cases, treated and not-treated firms experience comparable amounts of intangible assets in the years before the treatment, while firms recipient of SCFs and H2020 are characterized by higher levels of intangible assets after the allocation of such programmes of financial support. These results provide evidence that SCFs and H2020 do not crowd out other investors as they are employed to invest in additional R&D projects and not just as alternative ways of financing existing initiatives (Garcıa-Quevedo, Citation2004; González et al., Citation2005; Mairate, Citation2006).
5. Conclusions
This paper disentangles the impact of alternative combinations of policy instruments on environmental performance. We find that EU ETS participation has heterogeneous effects across firms in different sectors. For instance, we find that the EU ETS stimulates higher patent applications between 0.4% and 0.5% in the light manufacturing sector, while it does not significantly impact on the energy sector.
Furthermore, we find evidence that direct measures of financial support devoted to green innovation initiatives do not automatically imply better environmental performances, suggesting that the one-size-fits-all approach is not effective. Indeed, SCFs and H2020 funds do not generate additional benefits with respect to the EU ETS policy for the light manufacturing sector. Conversely, the policy mix contributes to raising patent applications between 1.4% and 2.2% and reducing CO2 emissions over total assets between 0.7% and 0.8% in the energy sector, as it may effortlessly implement the cost transfer mechanism. Moreover, firms in the energy sector under the policy mix achieve a carbon intensity reduction that is 0.75% larger than firms under the EU ETS mechanism only. This means that the policy mix contributed to a significant reduction of total emissions produced by EU ETS energy firms during Phase III.
We also show that the policy mix could be particularly effective for Heavy Manufacturing firms that may require relevant financial resources to promote environmental innovation. For these firms the EU ETS participation, even if combined with free allocated allowances, might therefore not adequately foster environmental innovation.
These findings can help evaluate possible channels that may support the achievement of EU climate targets. For instance, according to the European Environmental Agency (Citation2023), projections for 2030 based on ‘with existing measures’ (WEM) or ‘with additional measures’ (WAM) scenarios point to emissions that are 55% or 59% below the level of 2005, with the energy sector contributing for almost half of the emissions (Zaklan, Citation2023) and expected to account for most of the projected reductions through the switch from coal to gas and renewables in the fuels combustion.
Finally, we provide some intuitions on the mechanism explaining why the combination of programmes of financial support and demand-pull policies may be beneficial for better environmental performance. Consistent with the literature on the impact of public finance on innovation, we show that SCFs and H2020 funds crowd in additional investments and catalyse R&D activities, contributing to an increase in patent applications and a reduction in CO2 emissions. Our results contribute to the literature about market factors that affect the impact of complex combinations of policy instruments (Acemoglu, Citation2002; Acemoglu et al., Citation2012; Acemoglu et al., Citation2014; Acemoglu et al., Citation2016; Aghion et al., Citation2016), showing how the policy mix might be relevant for the sustainability transition through an efficient use of public financial resources.
Overall, our paper fuels the discussion about factors stimulating environmental technological change (Acemoglu et al., Citation2012; Acemoglu et al., Citation2014; Aghion et al., Citation2016). We show that the possibility to implement mechanisms reducing a full internalization of carbon costs can affect the optimal combination of policy instruments. Indeed, while demand-pull policy instruments significantly affect the environmental innovation of firms with limited cost pass-through options, financial support appears necessary to significantly improve the environmental innovation and foster carbon abatement of firms that can transfer the cost of allowances to final users.
Our research has some limitations. For instance, our work merges heterogeneous data sources to empirically test for the impact of specific policy combinations that were not previously investigated by the available literature. However, this data integration process may have led to exclude some relevant firms that we were not able to match across the different datasets. Furthermore, our analysis focuses on the policy mix impact in the period 2014–2020, thus covering a medium-short time frame that is not able to capture long-term innovation dynamics induced by the EU ETS, SFCs and H2020 funds. Finally, future research connected with this work may try to further investigate the design and development of environmental innovation trying to explicitly take into account potential innovation spillovers from sectors and countries not covered by the EU ETS.
Author contributions
Francesco Scotti: Conceptualization, Methodology, Software, Data curation, Writing-Original draft preparation. Andrea Flori: Conceptualization, Methodology, Writing – Review & Editing. Riccardo Crescenzi: Conceptualization, Methodology, Supervision, Writing – Review & Editing. Fabio Pammolli: Conceptualization, Supervision.
Acknowledgements
We are grateful to the Italian Association of Environmental and Resource Economists (IAERE) 2023 conference for awarding this manuscript as the best IAERE Young Environmental Economist paper. Furthermore, we thank the Third Joint EU Cohesion Policy Conference (Zagreb, 2022) and the Transatlantic Policy Symposium (Washington, 2023) for the useful feedback and comments obtained through fruitful discussions with academicians, policymakers, and practitioners.
We are grateful to the Editor of Climate Policy, Pieter Pauw, and three anonymous Reviewers for the wise suggestions, feedback, and comments that significantly improved our manuscript.
Disclosure statement
No potential conflict of interest was reported by the author(s).
Additional information
Funding
Notes
1 with C being a binary variable equal to 1 for never treated units.
2 For the set of carbon leakage sectors we rely on the list disclosed by the EC and available at the following link: https://climate.ec.europa.eu/eu-action/eu-emissions-trading-system-eu-ets/free-allocation/carbon-leakage_en.
3 In the base analysis for the policy mix we exclude from both the treated and control groups those firms under the EU ETS that are established in carbon leakage sectors. In Section SM4 we perform a robustness analysis where firms under EU ETS in carbon leakage sectors are considered as a case of policy mix.
4 Data on GHG emissions by sector can be downloaded at the following link: https://ec.europa.eu/eurostat/databrowser/view/env_ac_aigg_qcustom_10255905/default/table?lang=en.
References
- Acemoglu, D. (2002). Directed technical change. The Review of Economic Studies, 69(4), 781–809. https://doi.org/10.1111/1467-937X.00226
- Acemoglu, D., Aghion, P., Bursztyn, L., & Hemous, D. (2012). The environment and directed technical change. American Economic Review, 102(1), 131–166. https://doi.org/10.1257/aer.102.1.131
- Acemoglu, D., Aghion, P., & Hémous, D. (2014). The environment and directed technical change in a North–South model. Oxford Review of Economic Policy, 30(3), 513–530. https://doi.org/10.1093/oxrep/gru031
- Acemoglu, D., Akcigit, U., Hanley, D., & Kerr, W. (2016). Transition to clean technology. Journal of Political Economy, 124(1), 52–104. https://doi.org/10.1086/684511
- Aghion, P., Dechezlepr^etre, A., Hemous, D., Martin, R., & Van Reenen, J. (2016). Carbon taxes, path dependency, and directed technical change: Evidence from the auto industry. Journal of Political Economy, 124(1), 1–51. https://doi.org/10.1086/684581
- Åhman, M., Nilsson, L. J., & Johansson, B. (2017). Global climate policy and deep decarbonization of energy-intensive industries. Climate Policy, 17(5), 634–649. https://doi.org/10.1080/14693062.2016.1167009
- Alexeeva-Talebi, V. (2011). Cost pass-through of the EU emissions allowances: Examining the European petroleum markets. Energy Economics, 33, S75–S83. https://doi.org/10.1016/j.eneco.2011.07.029
- Bachtler, J., Berkowitz, P., Hardy, S., & Muravska, T. (2017). EU Cohesion Policy. Taylor & Francis.
- Bataille, C. (2020). Low and zero emissions in the steel and cement industries: Barriers, technologies and policies.
- Bergek, A., Jacobsson, S., Carlsson, B., Lindmark, S., & Rickne, A. (2008). Analyzing the functional dynamics of technological innovation systems: A scheme of analysis. Research Policy, 37(3), 407–429. https://doi.org/10.1016/j.respol.2007.12.003
- Bocken, N. M. (2015). Sustainable venture capital–catalyst for sustainable start-up success? Journal of Cleaner Production, 108, 647–658. https://doi.org/10.1016/j.jclepro.2015.05.079
- Busch, T., & Hoffmann, V. H. (2011). How hot is your bottom line? Linking carbon and financial performance. Business & Society, 50(2), 233–265. https://doi.org/10.1177/0007650311398780
- Cainelli, G., D’Amato, A., & Mazzanti, M. (2020). Resource efficient eco-innovations for a circular economy: Evidence from EU firms. Research Policy, 49(1), 103827. https://doi.org/10.1016/j.respol.2019.103827
- Callaway, B., & Sant’Anna, P. H. (2021). Difference-in-differences with multiple time periods. Journal of Econometrics, 225(2), 200–230. https://doi.org/10.1016/j.jeconom.2020.12.001
- Cantner, U., Graf, H., Herrmann, J., & Kalthaus, M. (2016). Inventor networks in renewable energies: The influence of the policy mix in Germany. Research Policy, 45(6), 1165–1184. https://doi.org/10.1016/j.respol.2016.03.005
- Carrión-Flores, C. E., & Innes, R. (2010). Environmental innovation and environmental performance. Journal of Environmental Economics and Management, 59(1), 27–42.
- Clò, S. (2010). Grandfathering, auctioning and carbon leakage: Assessing the inconsistencies of the new ETS directive. Energy Policy, 38(5), 2420–2430. https://doi.org/10.1016/j.enpol.2009.12.035
- Cludius, J., de Bruyn, S., Schumacher, K., & Vergeer, R. (2020). Ex-post investigation of cost pass-through in the EU-ETS: an analysis for six industry sectors. Energy Economics, 91, 104883. https://doi.org/10.1016/j.eneco.2020.104883
- Corradini, M., Costantini, V., Mancinelli, S., & Mazzanti, M. (2014). Unveiling the dynamic relation between R&D and emission abatement: national and sectoral innovation perspectives from the EU. Ecological Economics, 102, 48–59. https://doi.org/10.1016/j.ecolecon.2014.03.017
- Costantini, V., Crespi, F., & Palma, A. (2017). Characterizing the policy mix and its impact on eco-innovation: A patent analysis of energy-efficient technologies. Research Policy, 46(4), 799–819. https://doi.org/10.1016/j.respol.2017.02.004
- Courvisanos, J. (2009). Political aspects of innovation. Research Policy, 38(7), 1117–1124. https://doi.org/10.1016/j.respol.2009.04.001
- Cox, E., & Edwards, N. R. (2019). Beyond carbon pricing: policy levers for negative emissions technologies. Climate Policy, 19(9), 1144–1156. https://doi.org/10.1080/14693062.2019.1634509
- Crescenzi, R., de Blasio, G., & Giua, M. (2020). Cohesion policy incentives for collaborative industrial research: evaluation of a smart specialisation forerunner programme. Regional Studies, 54(10), 1341–1353. https://doi.org/10.1080/00343404.2018.1502422
- Dai, Y., & Xue, L. (2015). China’s policy initiatives for the development of wind energy technology. Climate Policy, 15(1), 30–57. https://doi.org/10.1080/14693062.2014.863549
- De Chaisemartin, C., & d’Haultfoeuille, X. (2020). Two-way fixed effects estimators with heterogeneous treatment effects. American Economic Review, 110(9), 2964–2996. https://doi.org/10.1257/aer.20181169
- Den Elzen, M., Kuramochi, T., Höhne, N., Cantzler, J., Esmeijer, K., Fekete, H., Fransen, T., Keramidas, K., Roelfsema, M., Sha, F., van Soest, H. & Vandyck, T. (2019). Are the G20 economies making enough progress to meet their NDC targets? Energy Policy, 126, 238–250. https://doi.org/10.1016/j.enpol.2018.11.027[Q8]
- Dimos, C., Pugh, G., Hisarciklilar, M., Talam, E., & Jackson, I. (2022). The relative effectiveness of R&D tax credits and R&D subsidies: A comparative meta-regression analysis. Technovation, 115, 102450. https://doi.org/10.1016/j.technovation.2021.102450
- E3Mlab and IIASA. (2016). Technical report on member state results of the EUCO policy scenarios.
- Edler, J., Georghiou, L., Blind, K., & Uyarra, E. (2012). Evaluating the demand side: New challenges for evaluation. Research Evaluation, 21(1), 33–47. https://doi.org/10.1093/reseval/rvr002
- Ellerman, A. D., Marcantonini, C., & Zaklan, A. (2020). The European union emissions trading system: ten years and counting. Review of Environmental Economics and Policy, 10(1), 89–107.
- European Commission, E. (2014). Commission decision of 27 October 2014 determining, pursuant to directive 2003/87/ec of the European parliament and of the council, a list of sectors and subsectors which are deemed to be exposed to a significant risk of carbon leakage, for the period 2015 to 2019. Official Journal of the European Union, 57, 114–124.
- European Commission, E. (2018). A clean planet for all. A European long-term strategic vision for a prosperous, modern, competitive and climate neutral economy.
- European Commission, E. (2020). Stepping up Europe’s 2030 climate ambition investing in a climate-neutral future for the benefit of our people. Journal of Chemical Information and Modeling, 53, 1689–1699.
- European Environmental Agency. (2023). Greenhouse gas emissions under the EU emissions trading system.
- Fais, B., Blesl, M., Fahl, U., & Voß, A. (2015). Analysing the interaction between emission trading and renewable electricity support in times. Climate Policy, 15(3), 355–373. https://doi.org/10.1080/14693062.2014.927749
- Flanagan, K., Uyarra, E., & Laranja, M. (2011). Reconceptualising the ‘policy mix’ for innovation. Research Policy, 40(5), 702–713. https://doi.org/10.1016/j.respol.2011.02.005
- Flori, A., Borghesi, S., & Marin, G. (2024). The environmental-financial performance nexus of EU ETS firms: A quantile regression approach. Energy Economics, 131, 107328. https://doi.org/10.1016/j.eneco.2024.107328
- Florio, M., Morretta, V., & Willak, W. (2018). Cost-benefit analysis and European union cohesion policy: Economic versus financial returns in investment project appraisal. Journal of Benefit-Cost Analysis, 9(1), 147–180. https://doi.org/10.1017/bca.2018.4
- Fragkos, P., Tasios, N., Paroussos, L., Capros, P., & Tsani, S. (2017). Energy system impacts and policy implications of the European intended nationally determined contribution and low-carbon pathway to 2050. Energy Policy, 100, 216–226. https://doi.org/10.1016/j.enpol.2016.10.023
- Garcıa-Quevedo, J. (2004). Do public subsidies complement business R&D? A meta-analysis of the econometric evidence. Kyklos, 57(1), 87–102. https://doi.org/10.1111/j.0023-5962.2004.00244.x
- Geddes, A., & Schmidt, T. S. (2020). Integrating finance into the multi-level perspective: Technology niche-finance regime interactions and financial policy interventions. Research Policy, 49(6), 103985. https://doi.org/10.1016/j.respol.2020.103985
- González, X., Jaumandreu, J., & Pazó, C. (2005). Barriers to innovation and subsidy effectiveness. Journal of Economics, 930–950.
- Goodman-Bacon, A. (2021). Difference-in-differences with variation in treatment timing. Journal of Econometrics, 225(2), 254–277. https://doi.org/10.1016/j.jeconom.2021.03.014
- Grubb, M., & Ulph, D. (2002). Energy, the environment, and innovation. Oxford Review of Economic Policy, 18(1), 92–106. https://doi.org/10.1093/oxrep/18.1.92
- Guerzoni, M., & Raiteri, E. (2015). Demand-side vs. supply-side technology policies: Hidden treatment and new empirical evidence on the policy mix. Research Policy, 44(3), 726–747. https://doi.org/10.1016/j.respol.2014.10.009
- Guo, B., & Gissey, G. C. (2021). Cost pass-through in the British wholesale electricity market. Energy Economics, 102, 105497. https://doi.org/10.1016/j.eneco.2021.105497
- Harhoff, D., Scherer, F. M., & Vopel, K. (2003). Citations, family size, opposition and the value of patent rights. Research policy, 32(8), 1343–1363. https://doi.org/10.1016/S0048-7333(02)00124-5
- Hoffman, A. J. (2005). Climate change strategy: The business logic behind voluntary greenhouse gas reductions. California Management Review, 47(3), 21–46. https://doi.org/10.2307/41166305
- Huppes, G., Deetman, S., Huele, R., Kleijn, R., De Koning, A., & van der Voet, E. (2017). Strategic design of long-term climate policy instrumentations, with exemplary EU focus. Climate Policy, 17(sup1), S8–S31. https://doi.org/10.1080/14693062.2016.1242059
- IPCC. (2014). Summary for policymakers. in: Climate change 2014: Mitigation of climate change. Cambridge University Press.
- Jaffe, A. B., Newell, R. G., & Stavins, R. N. (2002). Environmental policy and technological change. Environmental and Resource Economics, 22(1), 41–70. https://doi.org/10.1023/A:1015519401088
- Juergens, I., Barreiro-Hurlé, J., & Vasa, A. (2013). Identifying carbon leakage sectors in the EU ETS and implications of results. Climate Policy, 13(1), 89–109. https://doi.org/10.1080/14693062.2011.649590
- Kolk, A., & Pinkse, J. (2005). Business responses to climate change: Identifying emergent strategies. California Management Review, 47(3), 6–20. https://doi.org/10.2307/41166304
- Laing, T., Sato, M., Grubb, M., & Comberti, C. (2014). The effects and side-effects of the EU Emissions Trading Scheme. Wiley Interdisciplinary Reviews: Climate Change, 5(4), 509–519. https://doi.org/10.1002/wcc.283
- Lehmann, P., & Gawel, E. (2013). Why should support schemes for renewable electricity complement the EU emissions trading scheme? Energy Policy, 52, 597–607. https://doi.org/10.1016/j.enpol.2012.10.018
- Lindberg, M. B., Markard, J., & Andersen, A. D. (2019). Policies, actors and sustainability transition pathways: A study of the EU’s energy policy mix. Research Policy, 48(10), 103668. https://doi.org/10.1016/j.respol.2018.09.003
- Liu, P. R., & Raftery, A. E. (2021). Country-based rate of emissions reductions should increase by 80% beyond nationally determined contributions to meet the 2C target. Communications Earth & Environment, 2(1), 29. https://doi.org/10.1038/s43247-021-00097-8
- Ma, N., Li, H., Zhang, J., Han, X., Feng, S., & Arif, A. (2021). The short-term price effects and transmission mechanism of CO2 cost pass-through in China: A partial transmission model. Resources Policy, 70, 101972. https://doi.org/10.1016/j.resourpol.2020.101972
- Mairate, A. (2006). The ‘added value’of European Union cohesion policy. Regional Studies, 40(02), 167–177. https://doi.org/10.1080/00343400600600496
- Markard, J., Raven, R., & Truffer, B. (2012, Jul 1). Sustainability transitions: An emerging field of research and its prospects. Research Policy, 41(6), 955–967. https://doi.org/10.1016/j.respol.2012.02.013
- Mavrot, C., Hadorn, S., & Sager, F. (2019). Mapping the mix: Linking instruments, settings and target groups in the study of policy mixes. Research Policy, 48(10), 103614. https://doi.org/10.1016/j.respol.2018.06.012
- Medeiros, E. (2014). Assessing territorial impacts of the EU Cohesion Policy: The Portuguese case. European Planning Studies, 22(9), 1960–1988. https://doi.org/10.1080/09654313.2013.813910
- Milhorance, C., Sabourin, E., Coq, J.-F. L., & Mendes, P. (2020). Unpacking the policy mix of adaptation to climate change in Brazil’s semiarid region: Enabling instruments and coordination mechanisms. Climate Policy, 20(5), 593–608. https://doi.org/10.1080/14693062.2020.1753640
- Nemet, G. F. (2009). Demand-pull, technology-push, and government-led incentives for non-incremental technical change. Research Policy, 38(5), 700–709. https://doi.org/10.1016/j.respol.2009.01.004
- Neuhoff, K., & Ritz, R. (2019). Carbon cost pass-through in industrial sectors.
- Nill, J., & Kemp, R. (2009). Evolutionary approaches for sustainable innovation policies: From niche to paradigm? Research Policy, 38(4), 668–680. https://doi.org/10.1016/j.respol.2009.01.011
- Nilsson, L. J., Bauer, F., ˚Ahman, M., Andersson, F. N., Bataille, C., de la Rue du Can, S., Ericsson, K., Hansen, T., Johansson, B., Lechtenb¨ohmer, S., van Sluisveld, M., & Vogl, V. (2021). An industrial policy framework for transforming energy and emissions intensive industries towards zero emissions. Climate Policy, 21(8), 1053–1065. https://doi.org/10.1080/14693062.2021.1957665
- Oikonomou, V., Flamos, A., & Grafakos, S. (2014). Combination of energy policy instruments: creation of added value or overlapping? Energy Sources, Part B: Economics, Planning, and Policy, 9(1), 46–56. https://doi.org/10.1080/15567241003716696
- Peters, M., Schneider, M., Griesshaber, T., & Hoffmann, V. H. (2012). The impact of technology-push and demand-pull policies on technical change–Does the locus of policies matter? Research Policy, 41(8), 1296–1308. https://doi.org/10.1016/j.respol.2012.02.004
- Pisani-Ferry, J., & Mahfouz, S. (2023). The economic implications of climate action.
- Polzin, F. (2017). Mobilizing private finance for low-carbon innovation–a systematic review of barriers and solutions. Renewable and Sustainable Energy Reviews, 77, 525–535. https://doi.org/10.1016/j.rser.2017.04.007
- Prettner, K., & Werner, K. (2016). Why it pays off to pay us well: The impact of basic research on economic growth and welfare. Research Policy, 45(5), 1075–1090. https://doi.org/10.1016/j.respol.2016.03.001
- Reinhardt, F. L., & Stavins, R. N. (2010). Corporate social responsibility, business strategy, and the environment. Oxford Review of Economic Policy, 26(2), 164–181. https://doi.org/10.1093/oxrep/grq008
- Roelfsema, M., van Soest, H. L., Harmsen, M., van Vuuren, D. P., Bertram, C., den Elzen, M., Höhne, N., Iacobuta, G., Krey, V., Kriegler, E., Luderer, G., Riahi, K., Ueckerdt, F., Desprès, J., Drouet, L., Emmerling, J., Frank, S., Fricko, O., Gidden, M., ... Vishwanathan, S. S. (2020). Taking stock of national climate policies to evaluate implementation of the Paris agreement. Nature communications, 11(1), 2096. https://doi.org/10.1038/s41467-020-15414-6
- Rogelj, J., Den Elzen, M., Höhne, N., Fransen, T., Fekete, H., Winkler, H., Schaeffer, R., Sha, F., Riahi, K., & Meinshausen, M. (2016). Paris agreement climate proposals need a boost to keep warming well below 2C. Nature, 534(7609), 631–639. https://doi.org/10.1038/nature18307
- Rogge, K. S., & Hoffmann, V. H. (2010). The impact of the EU ETS on the sectoral innovation system for power generation technologies–findings for Germany. Energy Policy, 38(12), 7639–7652. https://doi.org/10.1016/j.enpol.2010.07.047
- Rogge, K. S., & Reichardt, K. (2016). Policy mixes for sustainability transitions: An extended concept and framework for analysis. Research Policy, 45(8), 1620–1635. https://doi.org/10.1016/j.respol.2016.04.004
- Rogge, K. S., & Schleich, J. (2018). Do policy mix characteristics matter for low-carbon innovation? a survey-based exploration of renewable power generation technologies in Germany. Research Policy, 47(9), 1639–1654. https://doi.org/10.1016/j.respol.2018.05.011
- Rogge, K. S., Schneider, M., & Hoffmann, V. H. (2011). The innovation impact of the EU emission trading system—findings of company case studies in the German power sector. Ecological Economics, 70(3), 513–523. https://doi.org/10.1016/j.ecolecon.2010.09.032
- Schmidt, T. S., Schneider, M., & Hoffmann, V. H. (2012). Decarbonising the power sector via technological change–differing contributions from heterogeneous firms. Energy Policy, 43, 466–479. https://doi.org/10.1016/j.enpol.2012.01.041
- Schmidt, T. S., & Sewerin, S. (2019). Measuring the temporal dynamics of policy mixes– an empirical analysis of renewable energy policy mixes’ balance and design features in nine countries. Research Policy, 48(10), 103557. https://doi.org/10.1016/j.respol.2018.03.012
- Sijm, J., Chen, Y., & Hobbs, B. F. (2012). The impact of power market structure on CO2 cost pass-through to electricity prices under quantity competition–a theoretical approach. Energy Economics, 34(4), 1143–1152. https://doi.org/10.1016/j.eneco.2011.10.002
- Sijm, J., Neuhoff, K., & Chen, Y. (2006). CO2 cost pass-through and windfall profits in the power sector. Climate Policy, 6(1), 49–72. https://doi.org/10.1080/14693062.2006.9685588
- Tanaka, K. (2011). Review of policies and measures for energy efficiency in industry sector. Energy policy, 39(10), 6532–6550. https://doi.org/10.1016/j.enpol.2011.07.058
- Teixidó, J., Verde, S. F., & Nicolli, F. (2019). The impact of the EU emissions trading system on low-carbon technological change: The empirical evidence. Ecological Economics, 164, 106347. https://doi.org/10.1016/j.ecolecon.2019.06.002
- Ulibarri, N., Ajibade, I., Galappaththi, E. K., Joe, E. T., Lesnikowski, A., Mach, K. J., Musah-Surugu, J. I., Nagle Alverio, G., Segnon, A. C., Siders, A., Sotnik, G., Campbell, D., Chalastani, V. I., Jagannathan, K., Khavhagali, V., Reckien, D., Shang, Y., Singh, C., Zommers, Z., & The Global Adaptation Mapping Initiative Team. (2022). A global assessment of policy tools to support climate adaptation. Climate Policy, 22(1), 77–96. https://doi.org/10.1080/14693062.2021.2002251
- Van den Bergh, J., Castro, J., Drews, S., Exadaktylos, F., Foramitti, J., Klein, F., Konc, T., & Savin, I. (2021). Designing an effective climate-policy mix: accounting for instrument synergy. Climate Policy, 21(6), 745–764. https://doi.org/10.1080/14693062.2021.1907276
- Veugelers, R. (2012). Which policy instruments to induce clean innovating? Research Policy, 41(10), 1770–1778. https://doi.org/10.1016/j.respol.2012.06.012
- Vogl, V., Åhman, M., & Nilsson, L. J. (2021). The making of green steel in the EU: a policy evaluation for the early commercialization phase. Climate Policy, 21(1), 78–92. https://doi.org/10.1080/14693062.2020.1803040
- Wang, M., & Zhou, P. (2017). Does emission permit allocation affect CO2 cost pass-through? a theoretical analysis. Energy Economics, 66, 140–146. https://doi.org/10.1016/j.eneco.2017.06.011
- Weber, K. M., & Rohracher, H. (2012). Legitimizing research, technology and innovation policies for transformative change: Combining insights from innovation systems and multi-level perspective in a comprehensive ‘failures’ framework. Research Policy, 41(6), 1037–1047. https://doi.org/10.1016/j.respol.2011.10.015
- Zaklan, A. (2023). Coase and cap-and-trade: Evidence on the independence property from the European carbon market. American Economic Journal: Economic Policy, 15(2), 526–558. https://doi.org/10.1257/pol.20210028