
 ?Mathematical formulae have been encoded as MathML and are displayed in this HTML version using MathJax in order to improve their display. Uncheck the box to turn MathJax off. This feature requires Javascript. Click on a formula to zoom.
Abstract
We study statistical aspects of state-dependent Hawkes processes, which are an extension of Hawkes processes where a self- and cross-exciting counting process and a state process are fully coupled, interacting with each other. The excitation kernel of the counting process depends on the state process that, reciprocally, switches state when there is an event in the counting process. We first establish the existence and uniqueness of state-dependent Hawkes processes and explain how they can be simulated. Then we develop maximum likelihood estimation methodology for parametric specifications of the process. We apply state-dependent Hawkes processes to high-frequency limit order book data, allowing us to build a novel model that captures the feedback loop between the order flow and the shape of the limit order book. We estimate two specifications of the model, using the bid–ask spread and the queue imbalance as state variables, and find that excitation effects in the order flow are strongly state-dependent. Additionally, we find that the endogeneity of the order flow, measured by the magnitude of excitation, is also state-dependent, being more pronounced in disequilibrium states of the limit order book.
1. Introduction
Hawkes processes are a class of self- and cross-exciting point processes where events of different types may increase the rate of new events of the same or other type (Hawkes Citation1971, Laub et al. Citation2015), dispensing with the independence-of-increments property of Poisson processes. Given their ability to capture clustering and contagion effects, Hawkes processes have found numerous applications in finance in the last decade, most notably in the modelling of high-frequency financial data (Embrechts et al. Citation2011, Bacry et al. Citation2015). Concurrently, the last two decades have witnessed a major transformation of financial markets through the proliferation of electronic trading in order-driven markets, where traders submit buy and sell orders to an electronic trading platform that attempts to match the arriving orders (Gould et al. Citation2013). A significant proportion of the order flow is driven by high-frequency trading algorithms, whereby successive orders are sometimes separated in time only by a few microseconds. As billions of orders are submitted each day, this has given rise to a profusion of new market data to study, giving an unprecedented opportunity to statistically analyse and model price formation and market microstructure at the shortest possible timescales.
From the point of view of statistical modelling, a key objective here is to find an accurate, yet parsimonious, statistical dynamic description of the limit order book (LOB), that is, the record of orders for a given asset that currently remain unfilled (Gould et al. Citation2013). As one of the main approaches to LOB modelling, Hawkes processes have been used to describe the order flow, which inherently drives the evolution of the LOB (Large Citation2007, Bacry et al. Citation2016, Rambaldi et al. Citation2017, Cartea et al. Citation2018b, Lu and Abergel Citation2018). This approach proceeds by specifying a set of order types (i.e. orders classified in terms of their impact on the LOB) and by fitting a multivariate Hawkes process to their timestamps. Hawkes processes have essentially provided us with a prism through which we can see the market reaction to the different order types and their interaction. More generally, the Hawkes-process approach fits into the longer trend of using point processes to model sequences of irregularly-spaced market events in continuous time (Engle and Russell Citation1998, Hautsch Citation2004, Bauwens and Hautsch Citation2009, Bacry et al. Citation2013, Bacry and Muzy Citation2014).
Whilst LOB models based on Hawkes processes have been rather successful in describing the dynamics of the order flow, they are unable to incorporate any endogenous state variables describing the LOB, such as prices, volumes or the bid–ask spread, nor their influence on the arrival rate of orders. We note that Hawkes processes have been used to build full-fledged LOB models (Muni Toke Citation2011, Abergel and Jedidi Citation2015), but the arrival rate of orders in these models is not influenced by the state of the LOB. In fact, Hawkes processes are complemented by the other main approach to LOB modelling, based on continuous-time Markov chains (Huang et al. Citation2015, Huang and Rosenbaum Citation2017, Cartea et al. Citation2018a). This alternative approach extends some of the earlier zero-intelligence models (Smith et al. Citation2003, Cont et al. Citation2010, Cont and De Larrard Citation2011) and postulates that the arrival rate of orders is driven by the state of the LOB alone, making the state part of the model. This has the merit of introducing a feedback loop between the order flow and the state of the LOB, but it omits the self- and cross-excitation effects evidenced by the empirical work based on Hawkes processes.
In short, each of these two approaches to LOB modelling has desirable qualities that the other lacks, as also noticed by Bacry et al. (Citation2016), Gonzalez and Schervish (Citation2017), Taranto et al. (Citation2018), and Morariu-Patrichi and Pakkanen (Citation2018). In fact, Gonzalez and Schervish (Citation2017) present empirical results, demonstrating that the type of the next order depends on both the type of the previous order and the state of the LOB, which highlights the need for a more general modelling framework that can amalgamate the two approaches.
The purpose of this paper is to introduce a novel, state-dependent extension of a Hawkes process, in the context of statistical modelling. The new model, formulated in Section 2, pairs a multivariate point process , governed by a past-dependent stochastic intensity, with an observable state process X. The intensity of the point process
is Hawkes process-like, characteristically depending on the past of
, but also influenced by the past of X. The process X switches state when there is an event in
, according to a Markov transition matrix that depends on the type of the event. This two-way interaction between
and X makes them fully coupled, just like the order flow and the state of the LOB in an order-driven market. It also distinguishes the model from the existing regime switching Hawkes processes (Wang et al. Citation2012, Cohen and Elliott Citation2013, Vinkovskaya Citation2014, Swishchuk and Huffman Citation2020), where the state process evolves exogenously, receiving no feedback from the point process. Mathematically, we lift the pair
to a higher-dimensional ordinary point process, which allows us to invoke the theory of hybrid marked point processes (Morariu-Patrichi and Pakkanen Citation2018) to establish the existence and uniqueness of non-explosive solutions and derive a simulation algorithm for the process.
Further, in Section 3 we develop a maximum likelihood (ML) estimation method for parametric specifications of a state-dependent Hawkes process, extending the ML methodology for ordinary Hawkes processes pioneered by Ozaki (Citation1979). We find that the likelihood function of a state-dependent Hawkes process has very convenient separable form that makes it possible to estimate the transition probabilities of X independently of the parameters of the point process , which is remarkable given that
and X are fully coupled. The upshot of this useful property is that, as far as ML estimation is concerned, state-dependent Hawkes processes are no harder to estimate than ordinary multivariate Hawkes processes.
In Section 4 we finally apply the new model and methodology to high-frequency financial data, estimating for the first time an LOB model that accommodates an explicit feedback loop between the state of the LOB and the order flow with self- and cross-excitation effects. More concretely, we estimate two specifications of a state-dependent Hawkes process on level-I LOB data on the stock of Intel (INTC) from Nasdaq, from June 2017 until May 2018, using the bid–ask spread and queue imbalance, respectively, as the state variable. The latter variable can be interpreted as an indicator of the shape of the LOB and is a popular price-predictive signal (Cartea et al. Citation2018a). Our estimation results reveal that the magnitude and duration of excitation effects in the order flow depend significantly on both state variables, being effective at timescales ranging from 100 microseconds to 100 milliseconds. Since human reaction times have been measured to be of the order of 200 milliseconds, and longer for tasks involving choice (Kosinski Citation2006), this is a clear sign of the highly algorithmic nature of the order flow in modern electronic markets. Moreover, we find that the high level of endogeneity of the order flow, dubbed critical reflexivity by Filimonov and Sornette (Citation2012) and Hardiman et al. (Citation2013), and quantifiable here by the spectral norm of the Hawkes excitation kernel, is state-dependent and, intriguingly, more pronounced in what can be seen as disequilibrium states of the LOB.
In the Appendix of this paper, we prove the theoretical results of Sections 2 and 3 and gather some auxiliary details on ML estimation. A Python library called mpoints that implements the models and estimation methodology of this paper is available from https://mpoints.readthedocs.io.
2. State-dependent Hawkes processes
2.1. Preliminaries and definition
To set the stage for state-dependent Hawkes processes, we first review some central concepts of point process theory (Brémaud Citation1981, Daley and Vere-Jones Citation2003). A -dimensional multivariate point process consists of an increasing sequence of positive random times
and a matching sequence of random marks
in
. We interpret, for any
, the pair
as an event of type
occurring at time
. A point process can be identified by its counting process representation
, where
counts how many events of type e have occurred by time t. The counting process
is said to be non-explosive if
with probability one. Given a filtration
to which
is adapted, we say that a non-negative
-predictable process
is the
-intensity of
if
Intuitively,
is the infinitesimal rate of new events of type e at time t.
To construct a state-dependent Hawkes process, we couple the point process with a càdlàg state process
that takes values in a finite state space
and denote by
the natural filtration of the pair
.
Definition 2.1
Let be a collection of
transition probability matrices,
and
, where
. The pair
is a state-dependent Hawkes process with transition distribution
, base rate vector
and excitation kernel
, abbreviated as
, if
has
X is piecewise constant and jumps only at the event times
where and
.
In applications to LOB modelling, the counting process and state process X will represent the order flow and the state of the LOB, respectively. An event of type
at time
, for some
, increases the infinitesimal rate of new events of type
at time t>T by
. The novelty here is that the self- and cross-excitation effects now depend on the state process X. Reciprocally, at each event in
, the state process X may switch to a new state according to the probability (Equation2
(2)
(2) ) that depends on the event type. Thereby, mimicking the mechanics of the LOB, the processes
and X are fully coupled. In the case
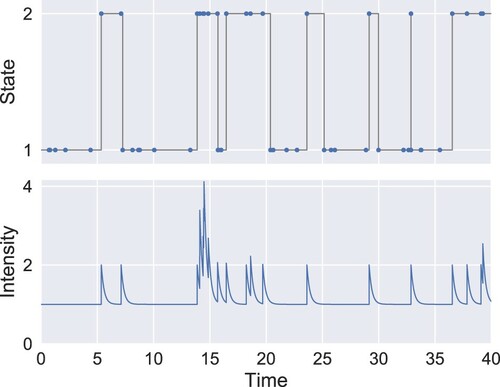
, Definition 2.1 reduces to that of an ordinary linear Hawkes process. A simulated sample path of a state-dependent Hawkes process with
,
and exponential kernel is shown in Figure . In this example, the process exhibits self-excitation only in the second state.
Figure 1. Simulation of a state-dependent Hawkes process with ,
. The upper plot shows the evolution of the state process. The blue dots indicate the event times and the lower plot represents the intensity. The process is specified so that
and
, that is, in state 2 the process exhibits exponential self-excitation whereas no self-excitation occurs in state 1.
Remark 2.2
The state space
The relationship (Equation2
If for any
2.2. Existence and uniqueness of non-explosive solutions
Since Definition 2.1 is implicit in the sense that the counting process is defined by intensity
that depends on the past of
and X, care is needed to establish the existence and uniqueness of a pair
that solves (Equation1
(1)
(1) ) and (Equation2
(2)
(2) ) so that
is non-explosive. To this end, we lift
to a
-dimensional multivariate point process
, where
counts the number of events of type e after which the state is x, formally,
The marks corresponding to
are given by
,
, where
is as above and
is the value of the state process following the nth event and
is the initial state. Thus, given
, the state
can be recovered from the most recent mark at time t, which makes the relationship between
and
bijective. In fact, state-dependent Hawkes processes were first introduced using this representation in Morariu-Patrichi and Pakkanen (Citation2018).
By applying the general characterisation result in Morariu-Patrichi and Pakkanen (Citation2018), the dynamics of can be expressed in terms of the dynamics of
, and vice versa. The natural filtration of
is denoted by
.
Theorem 2.3
The pair is a non-explosive
process if and only if
is non-explosive, admitting
-intensity
that satisfies
(3)
(3)
The above theorem in fact shows that state-dependent Hawkes processes belong to the class of hybrid marked point processes studied in Morariu-Patrichi and Pakkanen (Citation2018). The general existence and uniqueness results therein apply to the present class of processes as follows.
Theorem 2.4
A unique, non-explosive process exists if one of the following two conditions is satisfied:
the components of
Condition (i) above suffices for the purposes of the present paper, where we apply bounded, exponential kernels. However, condition (ii) is included here for completeness as it reduces to the classical stability condition of Massoulié (Citation1998) in the case .
2.3. Simulation
Another implication of Theorem 2.3 is that the simulation of a state-dependent Hawkes process can be reduced to the simulation of a multivariate point process with an intensity given by (Equation3(3)
(3) ) and, thus, many simulation techniques from point process theory can be reused (Lewis and Shedler Citation1976, Daley and Vere-Jones Citation2003).
In fact, the sample path in Figure has been generated using Ogata's thinning algorithm (Ogata Citation1981), which is an exact simulation algorithm and is adaptable for state-dependent Hawkes processes as follows. We write , which is a function of all
such that
.
Remark 2.6
In Algorithm 2.5, we are implicitly assuming that the components of the kernel
Lines 9–10 of Algorithm 2.5 use the product form (Equation3
2.4. Comparison with related models of limit order books
We will now briefly compare state-dependent Hawkes processes, in the sense of Definition 2.1, to some recent, closely related models, which similarly aim to couple a point process to a state process in the context of LOB modelling.
The regime-switching Hawkes process of Vinkovskaya (Citation2014) can be seen as a special case of Definition 2.1, with the exception that the dynamics of the state process X are not modelled. (Effectively, this means that the counting process is then specified conditional on a realisation of X, precluding two-way interaction between
and X.) In her empirical application, Vinkovskaya (Citation2014) estimates a four-dimensional version of the model for arriving orders of four different types in the New York Stock Exchange Trades and Quotes (TAQ) data. She employs the bid–ask spread as a state variable, like we do in one of our models in Section 4.
Swishchuk and Huffman (Citation2020) construct a compound Hawkes process using a one-dimensional ordinary Hawkes process N (possibly non-linear) and a Markov chain in a finite state space
, independent of N. The actual process
, which is used as a model of prices, is given by
where a is a function from
to
. Whilst having similar ingredients, the compound Hawkes process is otherwise unrelated to state-dependent Hawkes processes. In particular, the Markov chain
in the compound Hawkes process does not influence the rate of events, that is, price changes. Swishchuk and Huffman (Citation2020) establish limit theorems for the process, describing its long-term behaviour, and also empirically estimate it using Nasdaq Stock Market LOB data.
Note that in Definition 2.1 the excitation effect of each event is predicated upon the state prevailing at the time the event occurs. Alternatively, we could make the level of excitation track the current state. We could also make the base rates track the current state. Applying these modifications to equation (Equation1(1)
(1) ) in Definition 2.1 yields an analogous intensity satisfying
(4)
(4)
Whether it is ultimately more natural to use
or
in the excitation kernel is open to debate, but in the current context of LOB modelling, where the most significant excitation effects tend to be ephemeral, the difference is unlikely to be large in practice.
Now, several recent LOB models conform to (Equation4(4)
(4) ). Cohen and Elliott (Citation2013) introduce a one-dimensional Markov-modulated Hawkes process following (Equation4
(4)
(4) ), where X is an exogenous Markov process in a finite state space (exogenous in the sense that the counting process does not influence X). The key feature of their work is that they assume X to be unobservable, leading them to derive a filtering procedure for the estimation of the current state of X. Cohen and Elliott (Citation2013) illustrate their methodology by estimating a regime switch in TAQ trade data during the US equity market flash crash on 6 May 2010.
Coinciding with the first preprint version of the present paper, Wu et al. (Citation2019) develop a queue-reactive Hawkes process based on (Equation4(4)
(4) ). In their model, X is endogenous and carries information about queue lengths in the LOB, while the multi-dimensional counting process driven by the intensity (Equation4
(4)
(4) ) models events pertaining to these queues. Wu et al. (Citation2019) estimate their model on German bond (Bund) and index (DAX) futures LOB data. Subsequently, Mounjid et al. (Citation2019) generalise the queue-reactive Hawkes process to a more general point process framework that allows for non-linearity and quadratic Hawkes structure. Mounjid et al. (Citation2019) additionally establish ergodicity for the model and also derive functional limit theorems for its long-term behaviour. They apply the model to evaluate and rank equities market makers on Euronext Paris.
Finally, Fosset et al. (Citation2020) develop a Hawkes process model of endogenous liquidity crises. They model the increase and decrease, respectively, in the bid–ask spread as a two-dimensional point process that conforms to (Equation4(4)
(4) ). The first component of the process follows an ordinary Hawkes process (possibly non-linear), whilst the second component has a state-dependent base rate, depending on the the current bid–ask spread. Fosset et al. (Citation2020) then analyse the long-term stability of the model.
3. Parametric estimation via maximum likelihood
Estimating the base rate vector and kernel
of an ordinary Hawkes process has become a vibrant research topic in statistics and statistical finance literature. Whilst the recent focus has mostly been on non-parametric methodology (Bacry and Muzy Citation2016, Kirchner Citation2017, Eichler et al. Citation2017, Sancetta Citation2018, Achab et al. Citation2018), our aim in this paper is to extend the classical parametric framework (Ozaki Citation1979), comprehensively summarised in Bowsher (Citation2007), to state-dependent Hawkes processes, leaving non-parametric methodology for future work. From now on, we work with a kernel
parametrised by a vector
.
3.1. Likelihood function
We know from Subsections 2.2 and 2.3 that a state-dependent Hawkes process can be lifted to a
-dimensional point process
. Given a realisation
of
over a time horizon
, the likelihood function
can be informally understood as the probability that
and
lies in a small neighbourhood of
, under the assumption that
is generated by a state-dependent Hawkes processes with parameters
. More rigorously, the likelihood function is the density of the Janossy measure with respect to the Lebesgue measure on
(Daley and Vere-Jones Citation2003, p. 125, 213).
For ordinary Hawkes processes, the likelihood function can be expressed directly in terms of
(Daley and Vere-Jones Citation2003) and the maximum likelihood (ML) estimator
is obtained by maximising
, in practice numerically. For state-dependent Hawkes processes, we are able to express
in terms of
and
, and find that maximising the likelihood is conveniently achieved by solving two independent optimisation problems.
Theorem 3.1
The log likelihood function of an process is given by
(5)
(5)
Furthermore,
if and only if
The upshot of Theorem 3.1 is that the ML estimation of state-dependent Hawkes processes is no harder than that of ordinary Hawkes processes. Namely, is estimated in a straightforward manner by the empirical transition probabilities, whilst
is estimated by maximising the log quasi-likelihood of
, that is, the Radon-Nikodym derivative of a change of measure that transforms a standard Poisson process into
(Brémaud Citation1981, Theorem 10, p. 241), which is similar to the log likelihood of a multivariate ordinary Hawkes process. It is remarkable that, in spite of the strong coupling between the events and the state process, the estimation of
and
is decoupled due to the separable form (Equation5
(5)
(5) ) of the log likelihood function.
Remark 3.2
It should be stressed that the separable form (Equation5(5)
(5) ) of the log likelihood function
is not a trivial consequence of Definition 2.1. It is once again the lift
that allow us to transpose the problem to the setting of point process theory, where classical results apply (see the proof of Theorem 3.1 in Appendix A.1).
We note that, in the case of ordinary Hawkes processes (), consistency and asymptotic normality results for the ML estimator
are available in the literature, see for example (Ogata Citation1978, Clinet and Yoshida Citation2016). However, these results rely on the stationarity and ergodicity of the underlying process and, unfortunately, these properties need not extend to state-dependent Hawkes processes in general. If the excitation kernel
is dominated in all states by a non-state-dependent kernel that satisfies a classical stability condition (Massoulié Citation1998), we conjecture that then stationarity and ergodicity hold. This can potentially be shown by adapting the arguments used in Mounjid et al. (Citation2019) to prove ergodicity for closely related point processes, or in the special case of exponential kernels (see Subsection 3.3) using Markov process techniques, as outlined in Section 4.7 in Morariu-Patrichi (Citation2019). The case where
fails to be dominated by a stable kernel in some of the states appears however to be empirically more relevant given our results in Subsection 4.8. In this case, stationarity and ergodicity become more elusive, whilst they may still plausibly hold as long as the sojourns of the process in the ‘unstable states’ do not dominate its time evolution. All in all, the analysis of the asymptotic properties of the ML estimator is unfortunately not straightforward and remains beyond the scope of the present paper.
In Appendix A.2.3, we present Monte Carlo results that exemplify the favourable finite-sample performance of the ML estimator. In particular, the results provide evidence that is consistent as the length of the estimation window increases.
3.2. Goodness-of-fit diagnostics using residuals
The goodness of fit of an estimated process can be assessed as follows. Denote by
the sequence of times at which an event of type e occurred and by
the sequence of times at which an event type e occurred and after which the state was x, and set
for all
and
. Introduce additionally the event residuals
and total residuals
where
and
are computed by plugging the estimated values
into (Equation1
(1)
(1) ) and (Equation3
(3)
(3) ), respectively.
It is a classical result that under the right time change, and
become unit-rate Poisson processes (Meyer Citation1971), with the event residuals and total residuals as their respective time increments, which applies to the present setting as follows.
Theorem 3.3
Suppose that
Suppose that
Consequently, the goodness-of-fit of the process can be assessed by comparing the empirical distribution of each sequence among ,
and
,
,
to the
distribution, which can by achieved by inspecting a Q–Q plot (see Subsection 4.7). Goodness-of-fit diagnostics can also check whether the residuals are mutually independent, which can be assessed by examining their correlogram. One can of course go beyond these visual assessments by applying formal statistical tests (Bowsher Citation2007).
3.3. The special case of exponential kernels
The direct computation of the term in the log likelihood function (Equation5
(5)
(5) ) involves a double sum requiring
operations to evaluate, which may render ML estimation numerically infeasible when the sample is large. However, for ordinary Hawkes processes (
) with exponential kernels, it is known that this computation can be achieved in
operations (Ozaki Citation1979, Ogata Citation1981). Fortunately, this property carries over to state-dependent Hawkes processes with kernel
having exponential form
(6)
(6)
where the impact coefficients
and decay coefficients
are non-negative. The reduction in computational cost becomes apparent from the derivation in Appendix A.2.1. In particular, the term
can be expressed in terms of sums that satisfy a convenient recursive relationship, reducing the computational cost from
to
operations. A similar remark holds for the computation of the gradient and the residuals. Moreover, the
complexity extends also to any kernel whose components are linear combinations of functions of the form (Equation6
(6)
(6) ).
4. Application to high-frequency limit order book data
4.1. Limit order book mechanism
We first briefly review the mechanics of a limit order book and recall the definitions of some key market quantities, following Gould et al. (Citation2013).
In order-driven markets, market participants submit orders to buy or sell an asset (e.g. a stock) at the price of their choice. Formally, an order is defined by its submission time, direction (buy or sell), price p and size q. The quantities p and q must typically be multiples of the tick size and lot size, respectively, which are fixed by the exchange or the market regulator. When a buy order is submitted, if there are unfilled sell orders with prices , the buy order is matched at the smallest price
with the oldest order(s), following the price–time priority rule. Otherwise the order becomes active, that is, it enters the queue of unfilled orders with price p. Such orders are called limit orders. The collection of current limit orders is called the limit order book (LOB) and can thus be understood as a snapshot of the expressed supply and demand or visible liquidity. Orders that result in an instant match with pre-existing limit orders are called market orders. Orders may also be cancelled, that is, an unfilled or partially filled order is withdrawn from the LOB.
The highest (respectively lowest) price among buy (respectively sell) active limit orders is called the bid (respectively ask) price. For instance, the bid price is the best price at which one can instantly sell by sending a market order. The difference between the ask price and bid price is called the bid–ask spread. The orders and cancellations with prices that are equal to or more aggressive than the bid and ask prices at their submission time form the level-I order flow.
4.2. Data
We analyse tick-by-tick level-I LOB data on the stock of Intel Corporation (INTC), traded on the Nasdaq Stock Market, from 1 June 2017 to 31 May 2018. We discard the data on 3 June 2017 (the day before Independence Day) and 24 November 2017 (Black Friday, i.e. the day after Thanksgiving) because of early market close on those days at 13:00, leaving 250 full trading days in the data set. Besides INTC, we have also studied in the same manner the stocks of Advanced Micro Devices Inc. (AMD), Micron Technology Inc. (MU), Snap Inc. (SNAP) and Twitter Inc. (TWTR) from January to April 2018, but due to space constraints we only report our results on INTC as they are largely representative of the findings on the other stocks. (Full results are available from the authors upon request.)
Whilst the primary listing of INTC is the Nasdaq Stock Market, it can be traded on several stock exchanges and alternative trading systems (ATS) across the increasingly fragmented US equity market system (O'Hara and Ye Citation2011). In particular, there is no single LOB that would in real time aggregate the available liquidity on all trading venues—the Nasdaq LOB of INTC represents only a part of the visible liquidity. The LOBs of different exchanges cannot, however, diverge significantly, at least in terms of prices, due to the arbitrage opportunities that would ensue and the National Best Bid and Offer (NBBO) rule that mandates brokers to execute trades at the best available prices in the market system. Moreover, we deem the Nasdaq LOB of INTC to be representative of the state of the market since it had the largest market share of INTC among all exchanges during the observation period—according to Nasdaq trading volume statistics (https://www.nasdaqtrader.com/trader.aspx?ID=marketsharedailyhttps://www.nasdaqtrader.com/trader.aspx?ID=marketsharedaily), around 30% of the total INTC market volume was traded on Nasdaq, which is a typical figure for a stock with Nasdaq as primary listing.
In the US equity markets, the tick size is fixed to $0.01 by Rule 612 of Regulation National Market System (Reg NMS), with the exception of stocks priced below $1.00 per share. This means that for a stock with a low price per share, the uniform tick size is relatively large compared to the price. Such stocks are dubbed large-tick stocks. Whilst the exact criterion is subjective, the price of INTC during the sample period was until January 2018 below the threshold of $50 per share used by Bonart and Gould (Citation2017) to distinguish large-tick stocks and below $60 during the entire period. A characteristic feature of large-tick stocks is that their bid–ask spread is most of the time equal to one tick, which is confirmed for INTC in Figure (a). Another important feature of large-tick stocks is that most of their liquidity and trading activity is concentrated on the bid and ask levels, which is also our rationale for focusing on level-I data on INTC and eschewing deeper levels of the LOB.
In the modelling part of our analysis, we focus exclusively on trading activity between 12:00 and 14:30 for the following reason. It is well-known, and also exemplified in Figure (a), that the intensity of trading activity is not constant throughout the day but follows on average a U-shaped curve. Because of this diurnal pattern, imposing a constant base rate vector over the entire trading day might result in overestimation of the self- and cross-excitation effects (Rambaldi et al. Citation2015, Omi et al. Citation2017). The intensity of trading activity is relatively constant over the chosen intraday period, whilst the choice still leaves an ample amount of observations for model estimation (at least 50,000 level-I orders on each day, see Figure (b)).
Figure 2. Descriptive statistics of level-I order flow of INTC. Except for Figure (a), only the data between 12:00 and 14:30 are used. In Figure (a), the sample mean of the arrival rate of level-I orders is computed over 10-minute bins. The translucent area represents the range of the arrival rate across the 250 trading days, excluding the bottom and top 5% values. (a) Arrival rate of level-I orders. (b) Number of level-I orders. (c) Fraction of level-I orders with non-unique timestamp. (d) Distribution of level-I order types.
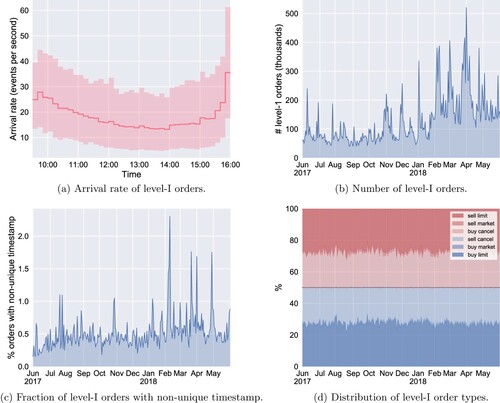
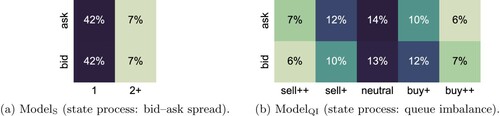
Figure 3. Joint distribution of events and states for INTC, depicting the empirical distribution of the marks for the two considered state processes. (a)
(state process: bid–ask spread). (b)
(state process: queue imbalance).
The data was supplied by LOBSTER (https://lobsterdata.comhttps://lobsterdata.com) in a form where the LOB at the time of each event has already been reconstructed. The timestamp of each event is recorded with nanosecond precision. As a result, more than 99% of level-I orders have a unique timestamp (Figure (c)). This contrasts with some earlier studies (Bowsher Citation2007, Large Citation2007) where lower timestamp resolutions (e.g. one second) were used, leading to a significant amount of tied timestamps, shared by multiple events. As Hawkes processes capture the Granger causality between different event types (Eichler et al. Citation2017, Embrechts and Kirchner Citation2018), being able to accurately establish the order of events, even at the shortest timescales, is essential for accurate estimation of Hawkes processes. It is worth pointing out that in LOBSTER data, a market order that is matched with, say, n multiple limit orders is recorded as n individual market orders sharing the same timestamp. However, in our analysis, including Figure (c), we address this artefact by aggregating market orders with a tied timestamp and counting them as a single level-I event.
4.3. Model specification
We work with models, based on state-dependent Hawkes processes, that distinguish two event types, denoted ask and bid (that is, ,
). In our analysis, bid events consist of buy market orders, level-I buy limit orders and level-I sell cancellations, whilst ask events inversely consist of sell market orders, level-I sell limit orders and level-I buy cancellations. Consequently,
can be interpreted as a proxy of the order flow imbalance, which was shown by Cont et al. (Citation2013) to be the main driver of price changes. More concretely, bid events tend to push the price up and ask events down. From Figure (d), we see that the distribution between these two event types is very balanced, with market orders accounting for less than 5% of the level-I activity. As discussed above, only the level-I events are modelled and events occurring at deeper levels of the LOB discarded. One could of course increase
to have a more granular classification of event types. Still, the focus of this paper is on the modelling of state dependence and the choice
already leads to interesting results whilst keeping the dimensionality low, which makes the results easier to visualise.
As the state variable we consider the bid–ask spread and the queue imbalance, giving rise to two models dubbed and
, respectively. In
, we set
(
), where the states correspond to the bid–ask spread being one tick (
) and two ticks or more (
). Increasing the number of states beyond
in this setting would not be practically relevant since the bid–ask spread is very rarely strictly wider than two ticks. The queue imbalance, used in
, is nowadays recognised as a popular trading signal with predictive power on the direction of the next price move (Cartea et al. Citation2018a). Denoting the total size of limit orders sitting at the ask price by
, and defining
analogously, the queue imbalance can be expressed as
(The denominator
equals zero if and only if the LOB is empty at time t. In this case, it would be natural to define
, but this never occurs in our data set.) For example, the condition
signals buy pressure and tends to be followed by an upwards price move. As in Cartea et al. (Citation2018a), we split the interval
into
bins of equal width which we label as follows:
(7)
(7)
whereby in
the state variable
indicates bin where
is located.
Finally, given the large number of observations we are dealing with (see Figure (b)), we use the exponential specification (Equation6(6)
(6) ) of the kernel
in both models, as it leads to a significant reduction of computational cost in estimation, as discussed in Subsection 3.3. The full specifications of the models are summarised in Table .
Table 1. Summary of and
.
4.4. Visualising estimated excitation effects
We use the following approach to present our estimation results on self- and cross-excitation effects. For each triple , ML estimation produces an estimated excitation profile
, parameterised by the estimated impact coefficient
and decay coefficient
. However, instead of reporting
and
, we visualise the excitation profile by plotting the truncated
-norm
from which the magnitude and the effective timescale of the excitation effect is easier to gauge than from the numerical values of
and
. In fact, taking guidance from the cluster representation of ordinary Hawkes processes (Hawkes and Oakes Citation1974), we can conveniently interpret
as the average number of events of type e that have been directly triggered by an event of type
in state x within t seconds of its occurrence. Further, we note that the full
-norm is given by
4.5. Estimation results for
We estimate the model parameters for each trading day i in the sample by ML estimation, as explained in Section 3. Practical details on the numerical solution of the underlying optimisation problem can be found in the Appendix A.2.2.
The estimated transition distribution of
, obtained by averaging over the daily estimates
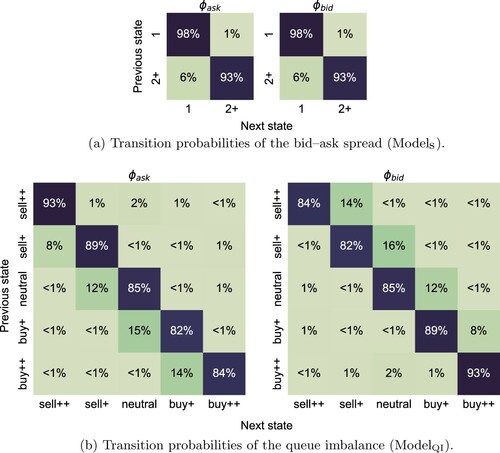
, is presented in Figure (a). The state process describing the bid–ask spread exhibits persistent behaviour, in the sense that the probability of remaining in the current state is very high. We also observe higher likelihood of moving from state 2+ to 1 than vice versa, which is consistent with one-tick bid–ask spread being the equilibrium state for a large-tick stock like INTC. We also find that the transition probabilities are not sensitive to the event type, which is natural since the bid–ask spread not is expected to be influenced by the direction of orders, ceteris paribus.
Figure 4. Estimated transition distributions of
and
. We report the average of
across the 250 trading days. (Daily estimates vary little from these averaged values.). (a) Transition probabilities of the bid–ask spread (
). (b) Transition probabilities of the queue imbalance (
).
The estimation results on the excitation kernel, given in Figure (a), indicate that self-excitation effects surpass cross-excitation effects in both states. Their magnitude and timescales, however, vary between the two states. The effective timescales of these effects range from 0.1 to 100 milliseconds, which is in agreement with the predominantly algorithmic origin and multiscale nature of trading in modern electronic markets.
Figure 5. The estimated kernel under
and
. Each panel describes self- or cross-excitation as indicated by its title, whilst each colour corresponds to a different state. For example, in Figure (a), the red curves in the second panel represent the estimates
where
,
and
. All daily estimates are superposed with one translucent curve for each day. An ‘aggregate’ kernel is represented by a solid line, computed using the median of
and
across the 250 trading days. (a)
(state variable: bid–ask spread). (b)
(state variable: queue imbalance).
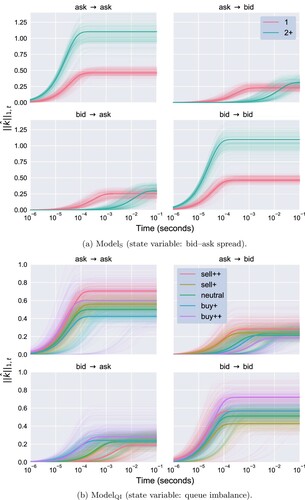
When the bid–ask spread increases to 2+, the magnitude of the self-excitation effects doubles whilst their timescale remains roughly the same. The timescale of cross-excitation, however, lengthens drastically, whilst their magnitude increases slightly. A plausible microstructural explanation for this pattern goes as follows. When the bid–ask spread is in state 2+, a trader can submit an aggressive limit order inside the spread, gaining queue priority at the cost of a less favourable price. A bid event can then be seen as a signal for an upwards price move, which may prompt limit orders from buyers seeking a favourable position in the new queue and cancellations of limit orders from sellers trying to avoid adverse selection. Traders who submit sell orders are, per contra, incentivised to wait and see if the expected price increase actually materialises.
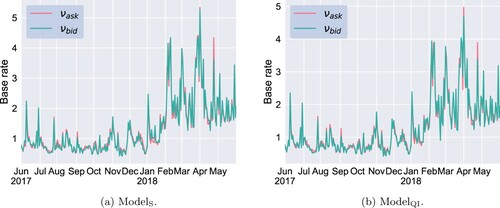
The evolution of the base rate vector throughout the 250 days of data is displayed in Figure . We find a remarkable balance between buyers and sellers (i.e.
). We also notice that the evolution of
mimics that of the total number of orders (Figure (b)), which suggests that the day-to-day variation in market activity is mainly due to exogenous factors (cf. the analysis of endogeneity in Subsection 4.8).
Figure 6. Estimated base rate vector for
and
over time (in number of events per second). (a)
. (b)
.
4.6. Estimation results for
The estimated transition probabilities of , presented in Figure (b), convey a tendency to stick to the current state, similar to what is seen in
. Here, however, this behaviour is more of an artefact—each ask and bid event, by definition, changes the queue imbalance but not necessarily the state variable that is confined to the bins (Equation6
(6)
(6) ).
In contrast to , the estimated transition probabilities now depend on the event type and we observe remarkable mirror symmetry, whereby
equals, up to 1 percentage point,
with the order of states reversed. This symmetry is natural, given the definition
—a sell order always decreases the queue imbalance unless it is submitted inside the bid–ask spread or it depletes the current bid queue, whilst an analogous statement is true for buy orders. As in
, we find again that the probability of a state transition is higher when it is towards the equilibrium state, here neutral, consistent with ideas about the resilience of the LOB (Large Citation2007).
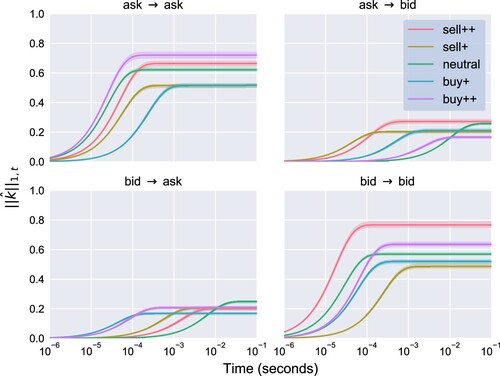
Looking at the estimation results for the excitation kernel in Figure (b), we observe that, like in , self-excitation surpass cross-excitation, with the magnitude of the former and the timescale of the latter being manifestly sensitive to the current state. The mirror symmetry seen above in the context of the transition probabilities holds here as well, whereby it suffices to only speak about the results for ask events, whilst analogous conclusions can be drawn on bid events.
Even though the day-to-day variation of the estimates is more pronounced in this model compared to , some clear patterns emerge again. The self-excitation of ask events consistently increases under heavy sell pressure (state sell++). This can plausibly be explained by a combination of a flight to liquidity, through the submission of sell orders, and fear of adverse selection, leading to cancellations of buy orders, by traders expecting a downwards price move. Under mild buy pressure (state buy+), self-excitation decreases so that the corresponding kernel norm nearly halves.
In the state buy++ (heavy buy pressure), a closer look at the daily estimates of the self-excitation of ask events plotted in purple in Figure (b) reveals two distinct groups of curves above and below of the median curve. The daily estimates of the (full) kernel norms plotted in time in Figure suggest that the self-excitation effect has undergone a structural break in early February 2018—the moment that suddenly marked the end of a year-long period of unusually low volatility in the US equity markets, dubbed ‘the return of volatility’ by some financial journalists. It is also worth mentioning that at the same time the price of INTC went above $50, at which point the large-tick character of the stock starts to weaken. The behaviour characterised by the lower group of curves (pre-February 2018) can be interpreted as traders expecting a price increase and thus deferring the submission of sell orders, whereas the upper group of curves (post-February 2018) hints at a tendency of sellers to seek an advantageous position in the ask queue. Indeed, a queue imbalance close to one implies that that only a very small amount of liquidity is available at the ask price. Thus, placing a sell limit order following a succession of sell limit orders from other traders allows one to acquire a good position in the queue, should it be replenished (which brings the queue imbalance back to equilibrium). If, however, the ask queue progresses towards depletion, one has still time to cancel the order whilst the sell limit orders at the front of the queue are matched with incoming buy market orders.
Figure 7. Estimated kernel norms for
over time. The dashed line marks 5 February 2018 (‘the return of volatility’), a day when the CBOE Volatility Index (VIX) jumped by 116% to 38 points, a level not seen since August 2015. This day seems to have introduced a systematic change in the magnitude of cross- and self-excitation. The spike in cross-excitation that occurs on 21 February 2018 is linked to a sudden change in market behaviour around 14:00 on that day, when Intel Corporation rolled out patches for its most recent generation of processors.
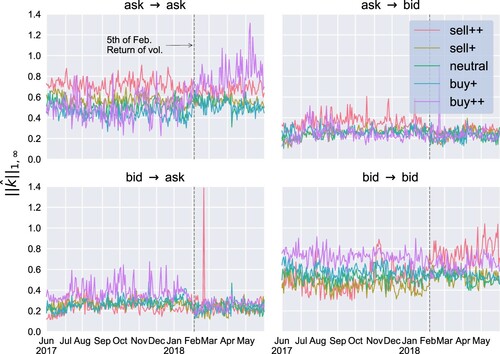
Under buy pressure (states buy++ and buy+), the timescale of the cross-excitation from bid to ask events becomes almost as short as that of the self-excitation of bid events. This reflects the resilience of the LOB—in response to a bid event, ask events compete neck and neck with bid events precisely when they push the queue imbalance back towards the equilibrium state. Recall that the resilience of the LOB is also reinforced by the estimated state transition probabilities, as discussed above.
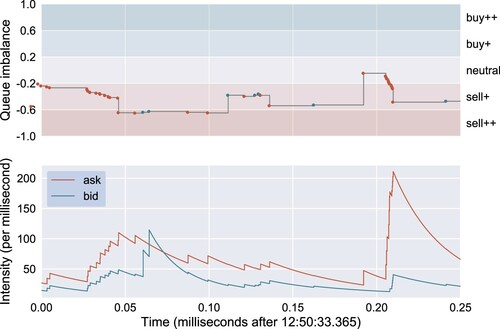
To exemplify the estimated intensity processes and their state dependence, a very brief extract from the estimated dynamics of is presented in Figure . In particular, we observe how pronounced the self-excitation of bid events becomes when the queue imbalance drops below
, that is, to state sell++.
Figure 8. The upper panel depicts the evolution of the queue imbalance and level-I order flow of INTC on 13 February 2018 and the ask (red dots) and bid (blue dots) events. The lower panel displays the estimated intensities of . (The self- and cross-excitation kernel norms of
on 13 February 2018 are visualised in Figure .)
4.7. Goodness-of-fit diagnostics
To assess the goodness of fit of the estimated models, we examine the event residuals in sample (daily, 12:00–14:30) and out of sample (daily, 14:30–15:00) for both
and
. For comparison, we also estimated an ordinary Hawkes process (
) with exponential kernel for the same event types
and computed its event residuals. Since the state-dependent Hawkes process nests the ordinary Hawkes process, the former will by construction provide a better fit in sample than the latter. The Q–Q plots in Figure show that this improvement in the goodness of fit extends out of sample, albeit the improvement is smaller than in sample. This is a confirmation that that
and
, and their state-dependent features in particular, are not overfitted.
Figure 9. In-sample (12:00–14:30) and out-of-sample (14:30–15:00) Q–Q plots of event residuals under ,
(state-dependent) and an ordinary Hawkes process (simple). The residuals of the ith day are computed using the ML estimates
obtained from the 12:00–14:30 period. The empirical quantiles are obtained by pooling the residuals of all 250 trading days. The two panels in each sub-figure correspond to the sequences of residuals
for
. (a)
: in sample. (b)
: out of sample. (c)
: in sample. (d)
: out of sample.
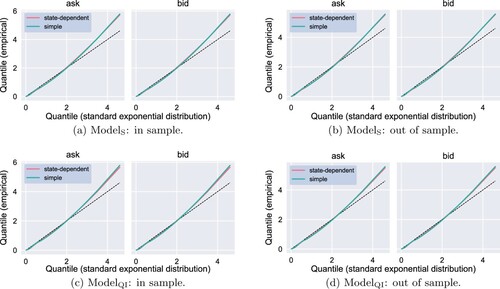
It should not come as a surprise that the improvement in goodness of fit provided by the state-dependent model looks meagre when one examines the Q–Q plots. Indeed, the behaviour of ,
and their ordinary Hawkes process alternative is quite similar when the bid–ask spread and queue imbalance are in their most likely states. It is only in the less likely states, 2+ in
and sell++ and buy++ in
, where the difference between the state-dependent and ordinary Hawkes process models becomes more pronounced. Thereby, the unconditional distribution of residuals does not vary much between these three models.
4.8. Endogeneity is state-dependent
The recent popularity of Hawkes processes in the modelling of high-frequency financial data partly stems from their ability to quantify the endogeneity of market activity. Indeed, based on the cluster representation of Hawkes processes (Hawkes and Oakes Citation1974) and the theory of branching processes (Harris Citation1963), the expected number of new events triggered by each event through self-excitation in a univariate ordinary Hawkes process equals the -norm of its self-excitation kernel, provided it is less than one. The threshold one is the critical boundary for the stability of the process and validity of the cluster representation. Hawkes processes fitted to high-frequency financial data often exhibit kernel norms slightly below one, whilst the base rates tend to be relatively low in comparison. This phenomenon has been interpreted by Filimonov and Sornette (Citation2012) and Hardiman et al. (Citation2013) as evidence that most market events are endogenous, mere responses to earlier events, dwarfing the flow of less frequent exogenous events that are driven by new information. They dub the phenomenon critical reflexivity, which is a nod to George Soros and his reflexivity theory on the endogeneity of financial markets (Soros Citation1989).
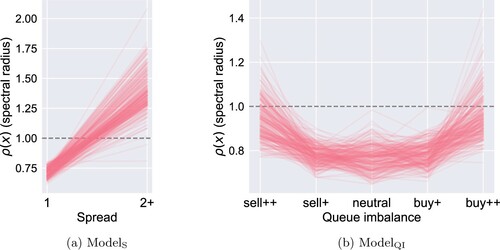
In the context of state-dependent Hawkes processes, the kernel , for any state
, defines a multivariate ordinary Hawkes process. Whilst in the multivariate case there is no direct analogue of the kernel norm—at least none with an equally clear-cut interpretation—the spectral radius
of the
matrix
, where
, can be understood as a measure of endogeneity in this ordinary Hawkes process for each
. It also characterises the stability of the process, whereby
is a sufficient condition for the existence of and convergence to a stationary version (Brémaud and Massoulié Citation1996). Figure displays the daily estimates of
for both
and
as a function of
. We observe a remarkably clear pattern of
being almost uniformly higher in the disequilibrium states (2+, sell++, buy++) than in the equilibrium states (1, sell+, neutral, buy+). In particular, in
, the spectral radius
is systematically above the critical value 1, whilst in
, the values of
and
are above 0.9 half of the time, exceeding 1 occasionally. These results thus open a new perspective on critical reflexivity, showing that it is in fact a largely state-dependent phenomenon, observed only in particular circumstances. They also lend credence to Soros's remark that ‘[e]ven in the financial markets demonstrably reflexive processes occur only intermittently’ (Soros Citation2008, p. 29).
Figure 10. The estimated spectral radius as a function of
under
and
. The daily profiles
,
, are represented by the red translucent curves. (a)
. (b)
.
The increase in endogeneity in the disequilibrium states seems attributable to strategies employed by high-frequency traders (HFTs), who become active in these states, in anticipation of a price move. In a recent study, Lehalle and Neuman (Citation2019) analyse a unique data set from Nasdaq Stockholm, where the identities of the buyer and seller in each transaction were disclosed by the exchange until 2014. In particular, they show that when the queue imbalance increases, the trading activity of market participants they classify as proprietary HFTs is amplified, in the direction of the imbalance. The pronounced sub-millisecond self-excitation effects seen in Figure (b), which are the key driver behind the high spectral radii , concur with the trading patterns observed by Lehalle and Neuman (Citation2019). Besides its use as a trading signal, Lehalle and Neuman (Citation2019) find the queue imbalance to be mean-reverting, which is similarly compatible with our results. A higher spectral radius in disequilibrium states corresponds here to an increase in market activity, which, reinforced by the structure of the estimated transition probabilities (Figure ), is more likely to push the queue imbalance towards equilibrium than vice versa.
4.9. Event–state structure of limit order books
We could alternatively build a state-dependent variant of a Hawkes process in the following, conceptually simpler way. Using the representation of the counting and state processes
, one could specify an intensity of the form
(8)
(8)
instead of (Equation3
(3)
(3) ). This approach would in fact be tantamount to simply using a
-dimensional ordinary Hawkes process.
The intensity (Equation8(8)
(8) ) makes self- and cross-excitation state-dependent, but the simple structure of the state process X in Definition 2.1 is lost. Namely, under (Equation8
(8)
(8) ), the transition probabilities of the state process depend not only on the current state but on the entire history. However, LOBs enjoy a certain event–state structure—knowing the current state of the LOB and the characteristics of the next order suffices to (approximately) determine the next state. State-dependent Hawkes processes are by construction able to reproduce such an event-state structure and, therefore, compared to the alternative (Equation8
(8)
(8) ), we expect them to provide in general a better statistical description of the LOB. Moreover, the model given by (Equation8
(8)
(8) ) requires a kernel with
components whereas a state-dependent Hawkes process can be specified more parsimoniously, using only
components.
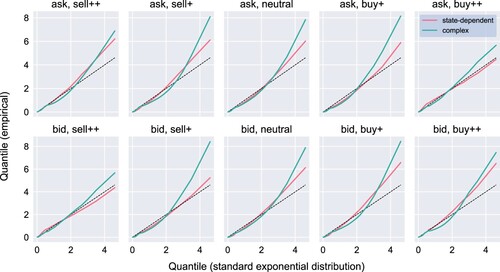
To compare this alternative model to state-dependent Hawkes processes, we estimate an ordinary Hawkes process with intensity (Equation8(8)
(8) ), choosing an exponential form of the kernel
and specifying the event types in
and the state space
as in
. Because of the higher dimensionality of this alternative model, estimation becomes computationally more expensive, which is why we use INTC data for May 2018 only. In Figure , this alternative model is compared to
via Q–Q plots of the total residuals. We choose to display the results for a day when the alternative model provides one of its best fits, although the goodness of fit does not vary markedly across the 22 trading days in May 2018. Even though it has fewer parameters (92 as opposed to 210), we observe that
provides a better in-sample fit. These empirical results thus underline the significance of the event–state structure of LOBs.
Figure 11. In-sample (12:00–14:30) Q–Q plots of total residuals of (state-dependent) and the alternative model given by (Equation8
(8)
(8) ) (complex) on 11 May 2018. Each panel corresponds to a sequence of residuals
for all
and
.
5. Discussion
State-dependent Hawkes processes enable us to model two-way interaction between a self- and cross-exciting point process, governing the temporal flow of events, and a state process, describing a system. In the context of LOB modelling, they provide a probabilistic foundation for a novel class of continuous-time models that encapsulate the feedback loop between the order flow and the shape of the LOB. Our estimation results, using these models and one year's worth of high-frequency LOB data on the stock of Intel Corporation, reveal that state dependence is indeed significant, as we uncover several robust patterns that persist throughout the daily estimation results. In particular, we find that market endogeneity, measured through the magnitude of self- and cross-excitation is state-dependent, being most pronounced in disequilibrium states of the LOB.
Our results also validate the event–state structure of LOBs that is embedded in the definition of a state-dependent Hawkes process. However, we do not claim that and
would be the best possible representations of the aforementioned feedback loop—we recognise that they could be refined as follows:
The exponential excitation kernels could be replaced by power laws, motivated by the non-parametric estimation results on ordinary Hawkes processes (Hardiman et al. Citation2013, Bacry et al. Citation2016). A numerically more convenient alternative would be to use a linear combination of exponentials within the parametric framework to mimic slow power-law decay (Rambaldi et al. Citation2015, Lu and Abergel Citation2018).
The base rates could be made state-dependent by replacing
One might argue for excitation kernels that allow for negative values, to capture inhibition effects that are known to exist in LOB data (Lu and Abergel Citation2018). To ensure the non-negativity of the intensity, this would require transforming the right-hand side of (Equation1
More granular event types and states would provide more nuanced understanding of the LOB dynamics. Besides, notice that the present framework accommodates multiple state variables. For example, X could in fact jointly represent both the bid–ask spread and the queue imbalance using the state space
However, no matter how one modifies the intensity (Equation1(1)
(1) ) by implementing any of (i)–(iv) to incorporate one's views on the feedback loop, the event–state structure of the model remains intact. The process still falls within the class of hybrid marked point processes (Morariu-Patrichi and Pakkanen Citation2018), implying that the theoretical results of this paper (existence, uniqueness, separability of the likelihood function) still apply.
Acknowledgments
Maxime Morariu-Patrichi gratefully acknowledges the Mini-DTC scholarship awarded by the Mathematics Department of Imperial College London. Mikko S. Pakkanen acknowledges partial support from CREATES (DNRF78), funded by the Danish National Research Foundation, from EPSRC through the Platform Grant EP/I019111/1 and from the CFM–Imperial Institute of Quantitative Finance.
Disclosure statement
No potential conflict of interest was reported by the author(s).
References
- Abergel, F. and Jedidi, A., Long-time behavior of a Hawkes process–based limit order book. SIAM J. Financ. Math., 2015, 6(1), 1026–1043.
- Achab, M., Bacry, E., Muzy, J.F. and Rambaldi, M., Analysis of order book flows using a non-parametric estimation of the branching ratio matrix. Quant. Finance, 2018, 18(2), 199–212.
- Bacry, E., Delattre, S., Hoffmann, M. and Muzy, J.-F., Modelling microstructure noise with mutually exciting point processes. Quant. Finance, 2013, 13(1), 65–77.
- Bacry, E., Jaisson, T. and Muzy, J.-F., Estimation of slowly decreasing Hawkes kernels: Application to high-frequency order book dynamics. Quant. Finance, 2016, 16(8), 1179–1201.
- Bacry, E., Mastromatteo, I. and Muzy, J.-F., Hawkes processes in finance. Market Microstruct. Liquidity, 2015, 1(1), 1550005.
- Bacry, E. and Muzy, J.-F., Hawkes model for price and trades high-frequency dynamics. Quant. Finance, 2014, 14(7), 1147–1166.
- Bacry, E. and Muzy, J.F., First- and second-order statistics characterization of Hawkes processes and non-parametric estimation. IEEE Trans. Inf. Theory, 2016, 62(4), 2184–2202.
- Bauwens, L. and Hautsch, N., Modelling financial high frequency data using point processes. In Handbook of Financial Time Series, edited by T. Mikosch, J.-P. Kreiß, R. A. Davis, and T. G. Andersen, pp. 953–979, 2009 (Springer: Berlin).
- Bonart, J. and Gould, M.D., Latency and liquidity provision in a limit order book. Quant. Finance, 2017, 17(10), 1601–1616.
- Bowsher, C.G., Modelling security market events in continuous time: Intensity based, multivariate point process models. J. Econom., 2007, 141(2), 876–912.
- Brémaud, P., Point Processes and Queues: Martingale Dynamics, 1981 (Springer: New York).
- Brémaud, P. and Massoulié, L., Stability of nonlinear Hawkes processes. Ann. Probab., 1996, 24(3), 1563–1588.
- Brown, T.C. and Nair, M.G., A simple proof of the multivariate random time change theorem for point processes. J. Appl. Probab., 1988, 25(1), 210–214.
- Cartea, Á, Donnelly, R. and Jaimungal, S., Enhancing trading strategies with order book signals. Appl. Math. Finance, 2018a, 25(1), 1–35.
- Cartea, Á, Jaimungal, S. and Ricci, J., Algorithmic trading, stochastic control, and mutually exciting processes. SIAM Rev., 2018b, 60(3), 673–703.
- Clinet, S. and Yoshida, N., Statistical inference for ergodic point processes and application to limit order book. Stoch. Proc. Appl., 2016, 127(6), 1800–1839.
- Cohen, S.N. and Elliott, R.J., Filters and smoothers for self-exciting Markov modulated counting processes. Preprint, 2013. Available at http://arxiv.org/abs/1311.6257.
- Cont, R. and De Larrard, A., Price dynamics in a Markovian limit order market. SIAM J. Financ. Math., 2011, 4(1), 1–25.
- Cont, R., Kukanov, A. and Stoikov, S., The price impact of order book events. J. Financ. Econ., 2013, 12(1), 47–88.
- Cont, R., Stoikov, S. and Talreja, R., A stochastic model for order book dynamics. Oper. Res., 2010, 58(3), 549–563.
- Daley, D.J. and Vere-Jones, D., An Introduction to the Theory of Point Processes. Vol. I, 2nd ed., 2003 (Springer: New York).
- Eichler, M., Dahlhaus, R. and Dueck, J., Graphical modeling for multivariate Hawkes processes with nonparametric link functions. J. Time Series Anal., 2017, 38(2), 225–242.
- Embrechts, P. and Kirchner, M., Hawkes graphs. Theory Probab. Appl., 2018, 62(1), 132–156.
- Embrechts, P., Liniger, T. and Lin, L.U., Multivariate Hawkes processes: An application to financial data. J. Appl. Probab., 2011, 48A, 367–378.
- Engle, R.F. and Russell, J.R., Autoregressive conditional duration: A new model for irregularly spaced transaction data. Econometrica, 1998, 66(5), 1127–1162.
- Filimonov, V. and Sornette, D., Quantifying reflexivity in financial markets: Toward a prediction of flash crashes. Phys. Rev. E., 2012, 85(5), 056108.
- Fosset, A., Bouchaud, J.-P. and Benzaquen, M., Endogenous liquidity crises. J. Statist. Mech.: Theory Experiment, 2020, 2020(6), 063401.
- Gonzalez, F. and Schervish, M., Instantaneous order impact and high-frequency strategy optimization in limit order books. Market Microstruct. Liquidity, 2017, 3(2), 1850001.
- Gould, M.D., Porter, M.A., Williams, S., McDonald, M., Fenn, D.J. and Howison, S.D., Limit order books. Quant. Finance, 2013, 13(11), 1709–1742.
- Hardiman, S.J., Bercot, N. and Bouchaud, J. -P., Critical reflexivity in financial markets: A Hawkes process analysis. Eur. Phys. J. B, 2013, 86(10), 442.
- Harris, T.E., The Theory of Branching Processes, 1963 (Springer: Berlin).
- Hautsch, N., Modelling Irregularly Spaced Financial Data: Theory and Practice of Dynamic Duration Models, 2004 (Springer: Berlin).
- Hawkes, A.G., Spectra of some mutually exciting point processes. J. R. Statist. Soc. Ser. B (Methodological), 1971, 33(3), 438–443.
- Hawkes, A.G. and Oakes, D., A cluster process representation of a self-exciting process. J. Appl. Probab., 1974, 11(3), 493–503.
- Huang, W., Lehalle, C.A. and Rosenbaum, M., Simulating and analyzing order book data: The queue-reactive model. J. Am. Stat. Assoc., 2015, 110(509), 107–122.
- Huang, W. and Rosenbaum, M., Ergodicity and diffusivity of Markovian order book models: A general framework. SIAM J. Financ. Math., 2017, 8(1), 874–900.
- Jacod, J., Multivariate point processes: Predictable projection, Radon-Nikodym derivatives, representation of martingales. Z. Wahrscheinlichkeitstheorie, 1975, 31(3), 235–253.
- Kallenberg, O., Random Measures, Theory and Applications, 2017 (Springer: Cham).
- Kirchner, M., An estimation procedure for the Hawkes process. Quant. Finance, 2017, 17(4), 571–595.
- Kosinski, R.J., A literature review on reaction time. Working paper, Clemson University, 2006.
- Large, J., Measuring the resiliency of an electronic limit order book. J. Financ. Markets, 2007, 10(1), 1–25.
- Laub, P.J., Taimre, T. and Pollett, P.K., Hawkes processes. Preprint, 2015. Available at: http://arxiv.org/abs/1507.02822.
- Lehalle, C.-A. and Neuman, E., Incorporating signals into optimal trading. Finance Stochast., 2019, 23(2), 275–311.
- Lewis, P.A.W. and Shedler, G.S., Simulation of nonhomogeneous Poisson processes with log linear rate function. Biometrika, 1976, 63(3), 501–505.
- Lu, X. and Abergel, F., High-dimensional Hawkes processes for limit order books: Modelling, empirical analysis and numerical calibration. Quant. Finance, 2018, 18(2), 249–264.
- Massoulié, L., Stability results for a general class of interacting point processes dynamics, and applications. Stoch. Proc. Appl., 1998, 75(1), 1–30.
- Meyer, P.A., Démonstration simplifiée d'un théorème de Knight. In Séminaire de Probabilités V (Université de Strasbourg), pp. 191–195, 1971 (Springer: Berlin).
- Morariu-Patrichi, M., High-frequency financial data modelling with hybrid marked point processes. PhD Thesis, Imperial College London, 2019.
- Morariu-Patrichi, M. and Pakkanen, M.S., Hybrid marked point processes: Characterization, existence and uniqueness. Market Microstruct. Liquidity, 2018, 4(3-4), 1950007.
- Mounjid, O., Rosenbaum, M. and Saliba, P., From asymptotic properties of general point processes to the ranking of financial agents. Preprint, 2019. Available at http://arxiv.org/abs/1906.05420.
- Muni Toke, I., Market making in an order book model and its impact on the spread. In Econophysics of Order-driven Markets, edited by F. Abergel, B. Chakrabarti, A. Chakraborti, and M. Mitra, pp. 49–64, 2011 (Springer: Milan).
- Ogata, Y., The asymptotic behaviour of maximum likelihood estimators for stationary point processes. Ann. Inst. Stat. Math., 1978, 30(1), 243–261.
- Ogata, Y., On Lewis' simulation method for point processes. IEEE Trans. Inf. Theory, 1981, 27(1), 23–31.
- O'Hara, M. and Ye, M., Is market fragmentation harming market quality? J. Financ. Econ., 2011, 100(3), 459–474.
- Omi, T., Hirata, Y. and Aihara, K., Hawkes process model with a time-dependent background rate and its application to high-frequency financial data. Phys. Rev. E., 2017, 96(1), 012303.
- Ozaki, T., Maximum likelihood estimation of Hawkes' self-exciting point processes. Ann. Inst. Stat. Math., 1979, 31(1), 145–155.
- Rambaldi, M., Bacry, E. and Lillo, F., The role of volume in order book dynamics: A multivariate Hawkes process analysis. Quant. Finance, 2017, 17(7), 999–1020.
- Rambaldi, M., Pennesi, P. and Lillo, F., Modeling foreign exchange market activity around macroeconomic news: Hawkes-process approach. Phys. Rev. E., 2015, 91(1), 012819.
- Sancetta, A., Estimation for the prediction of point processes with many covariates. Econ. Theory., 2018, 34(3), 598–627.
- Smith, E., Farmer, J.D., Gillemot, L. and Krishnamurthy, S., Statistical theory of the continuous double auction. Quant. Finance, 2003, 3(6), 481–514.
- Soros, G., The Alchemy of Finance, 1989 (Wiley: New York).
- Soros, G., The Crash of 2008 and What It Means: The New Paradigm for Financial Markets, 2008 (PublicAffairs: New York).
- Swishchuk, A. and Huffman, A., General compound Hawkes processes in limit order books. Risks, 2020, 8(1), 28.
- Taranto, D.E., Bormetti, G., Bouchaud, J. -P., Lillo, F. and Tóth, B., Linear models for the impact of order flow on prices. II. The mixture transition distribution model. Quant. Finance, 2018, 18(6), 917–931.
- Vinkovskaya, E., A point process model for the dynamics of limit order books. PhD thesis, Columbia University, 2014.
- Wang, T., Bebbington, M. and Harte, D., Markov-modulated Hawkes process with stepwise decay. Ann. Inst. Stat. Math., 2012, 64(3), 521–544.
- Wu, P., Rambaldi, M., Muzy, J.-F. and Bacry, E., Queue-reactive Hawkes models for the order flow. Preprint, 2019. Available at: http://arxiv.org/abs/1901.08938.
Appendix
A.1. Proofs
Proof of Theorem 2.3.
The statement follows by applying Theorem 2.13 in Morariu-Patrichi and Pakkanen (Citation2018). We only need to check that if is a state-dependent Hawkes process, then
admits an
-intensity. By Proposition 3.1 in Jacod (Citation1975),
admits an
-compensator Λ given by
and thus this holds if the conditional distributions
of
with respect to
are absolutely continuous with respect to
on
, where
and
are the counting measures on
and
, respectively. Moreover, by the definition of
,
is an
-compensator of
. But since
admits an
-intensity, by uniqueness of the compensator (Kallenberg Citation2017, Theorem 1.25, p. 39), we necessarily have with probability one that
for some
-measurable function f, which concludes the proof.
Proof of Theorem 2.4.
By Theorem 2.3, it is sufficient to show that each of the two conditions ensures the existence and uniqueness of a non-explosive point process with an
-intensity given by (Equation3
(3)
(3) ), which is achieved by applying Theorems 2.17 and 2.21 in Morariu-Patrichi and Pakkanen (Citation2018).
Proof of Theorem 3.1.
By Theorem 2.3, we know that has intensity
, which is given by (Equation3
(3)
(3) ). Hence, by applying Proposition 7.3.III in Daley and Vere-Jones (Citation2003, p. 251), we can express the log likelihood function as
(A1)
(A1)
Plugging (Equation3
(3)
(3) ) in (EquationA1
(A2)
(A2) ) and using that
,
,
, yields (Equation5
(5)
(5) ), from which it is immediate that
if and only if
where the first optimisation problem is performed under the constraint that
is a transition probability matrix,
. By solving this optimisation problem with the method of Lagrange multipliers, we obtain the claimed expression for
.
Proof of Theorem 3.3.
The statement follows directly from Theorem 1 in Brown and Nair (Citation1988). Note that this theorem requires that, with probability one, and
as
,
,
. The first condition is satisfied because, in Definition 2.1, we assume that all the base rates are strictly positive (
). By Lemma 17 in Brémaud (Citation1981, p. 41), the second condition is equivalent to
,
, with probability one,
,
, which is assumed here.
A.2. Details on maximum likelihood estimation
A.2.1. Formulae for state-dependent Hawkes processes with exponential kernels
In the case of exponential kernel given by (Equation6
(6)
(6) ), the following formulae can be derived for the second and third terms of the log likelihood function in (Equation5
(5)
(5) ), denoted by
and
, respectively. Here, we consider a general time horizon
, meaning that the origin of time is not necessarily
and that the times
are treated like an initial condition, and we have
The gradients can then also be computed via
Besides, the efficient computation of the residuals is based on the identity
The accompanying Python library mpoints implements the above formulae in C via the Cython extension of Python, allowing us to drastically reduce the computation time (up to 300 times faster computations compared to a plain Python implementation using NumPy). This played a crucial role in making the present study computationally feasible.
Table A1. Parameter values for Specification 1.
Table A2. Parameter values for Specification 2.
A.2.2. Numerical optimisation
Similarly to ordinary Hawkes processes (Lu and Abergel Citation2018), the maximum likelihood (ML) search (Equation6(6)
(6) ) is broken down into
separate optimisation problems. For every
, we have an independent optimisation problem that involves only the parameters
,
,
, and which we solve using a conjugate gradient method.
More precisely, we call the minimize function in the scipy.optimize Python package and use the method TNC. Three random sets of parameters are generated and used as alternative initial guesses. An ordinary Hawkes process () is estimated before the state-dependent one and its parameters are also used as an initial guess. Moreover, the estimate of the previous day is used as another initial guess and, thus, a total of five different initial guesses are employed. For
, around 50 iterations and 400 function evaluations are required for each day, event type
and initial guess.
As this optimisation problem is non-convex, the above procedure might converge to a mere local maximum instead of the global one (Lu and Abergel Citation2018). Nevertheless, in a Monte Carlo experiment, reported in the following subsection, this conjugate gradient method returns estimates that are consistently concentrated near the true parameter values (see also Figure ).
A.2.3. Finite-sample performance
We assess the finite-sample performance of the ML estimator in a small Monte Carlo experiment using a state-dependent Hawkes process with exponential kernel of the form (Equation6(6)
(6) ) when
and
. The parameters are naturally split into four groups: the transition probabilities in
, the base rates in
, the impact coefficients in
and the decay coefficients in
. For each group of parameters
and their estimator
, we define the worst relative error as
(A2)
(A2)
For two different sets of parameter values and four different sample sizes, we estimate the distribution of for each of the four groups of parameters using Monte Carlo via Algorithm 2.5. However, for the transition probabilities, we measure instead the worst absolute error, defined by replacing the denominator in (EquationA2
(A2)
(A2) ) by one. The first set of parameter values (Specification 1, Table ) is constructed simply by averaging the daily estimates of
using INTC data over the 19 trading days of February 2018. The second set of parameter values (Specification 2, Table ) is artificial, chosen to produce more drastic changes in behaviour from one state to another. The results are displayed in Figure and indeed support the conjectured consistency of the ML estimators of the state-dependent Hawkes process. Note that the observed bimodality is due to the fact that the worst relative error inherently alternates between positive and negative values.
Figure A1. Violin plots of the worst estimation errors (EquationA2(A2)
(A2) ) under two different sets of parameter values (specifications 1 and 2). For every specification and sample size N, we simulate 100 paths with sample size N and perform ML estimation for each of them. The true parameters are used as the initial guess in the optimisation procedure to speed up estimation and reduce the computational cost. (a) Specification 1. (b) Specification 2.
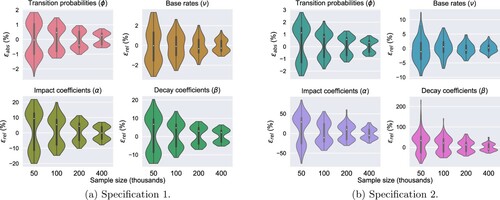
Figure A2. Uncertainty quantification of the estimated excitation profiles for INTC on 13 February 2018 under . The parametric bootstrap procedure involves simulating 100 paths covering 2.5 hours of trading using the ML estimates of the parameters on the considered day and applying ML estimation again to each of the simulated paths. Three random sets of parameters are used as the initial guess in the optimisation procedure. We use the 100 estimates to compute a 99%-confidence interval for the truncated kernel norm (translucent area). The solid line corresponds to the ML estimates using the original INTC data.
A.2.4. Uncertainty quantification via parametric bootstrap
The uncertainty of ML estimates of the parameters of a state-dependent Hawkes process can be quantified using a parametric bootstrap procedure. The procedure entails simulating realisations of the state-dependent Hawkes process under the estimated parameter values using Algorithm 2.5 and then applying ML estimation again to each simulated realisation, producing a sample of estimates that approximates the distribution of the ML estimator. To exemplify the method, we apply it here to estimates for INTC on 13 February 2018. The results are presented in Figure , and we observe that the uncertainty of the estimates is negligible compared to the estimated excitation patterns.