
ABSTRACT
This paper presents a recently transcribed copy of Ron Johnston’s inaugural lecture that he gave in 1975 following his appointment as Professor of Geography at the University of Sheffield. Entitled ‘The Spatial Variable’, it is published for the first time, with a foreword by one of Ron’s subsequent colleagues at the University of Bristol, highlighting the lecture’s continuing relevance to contemporary geographical praxis – especially quantitative geography – as well as Ron’s own interest in studying the histories of geographical thought. The lecture is offered as an intellectual tour de force that reverberates with Ron’s deep knowledge of and passion for the discipline of geography, and is infused with a belief in its social and academic validity; a validity that the lecture showcases with a wide range of examples, many in topics that Ron would continue to study throughout his career. Underpinning the lecture is recognition of the challenges but importance of geographical explanation to understand the (re-)production of socio-spatial inequalities. The lecture richly demonstrates Ron’s fascination with ‘the spatial variable’, the study of which would be a life-long pursuit and, in his pioneering approaches to its understanding, cement Ron’s recognition as one of Geography’s most prolific and respected practitioners.
Foreword
When Professor Ron Johnston OBE, FAcSS, FBA died on 29 May 2020, he left behind an enormous body of work that was both scholarly – a product of his deep fascination for geography and of his prolific publication record within it –, and physical: an office, in Bristol, stacked from floor to ceiling with books, research papers, PhD theses, photographic slides, train tickets, correspondence and other items accumulated from an immensely fruitful career that spanned political, urban, social and quantitative geography, together with modern histories of the discipline, campanology and other varied interests (Castree, Citation2021; Murphy et al., Citation2022; Pattie et al., Citation2021).
Fittingly for a scholar who did so much to catalogue, promote and influence the discipline, some of those items were sent to the archives of the Royal Geographical Society (with IBG). They include Ron’s 1962 undergraduate dissertation (about Swindon, his home town and whose football team he supported), as well as a notebook of hand-written measurements and calculations that could be the data referred to in Johnston (Citation1984), an autobiographical account of his encounters with the ‘quantitative revolution’ in geography, that were used in his 1964 MA dissertation and described, by him, as follows: ‘I collected lots of data on central places and bus services in my study area [Leeds] and manipulated those almost ad infinitum: much of the number-crunching came to nothing and very little of it entered the thesis’ (p. 41). Whilst that may be so, it and subsequent exposures to both the possibilities and limitations of spatial science were not without value: just a decade after completing that MA, seven years after finishing his PhD and travelling via jobs in Australia and New Zealand, Ron was appointed Professor of Geography at the University Sheffield, in 1974, at the age of only 33.
In fact, measurement and modelling would retain their place throughout Ron’s long and distinguished career. His interest in applying what were often advanced and novel quantitative methods to geographical studies – ‘very early on, I became convinced of the need to express conclusions quantitatively’ (Johnston, Citation1984, p. 41) – beget a textbook at Sheffield (Johnston, Citation1978) and would blossom into fruitful research collaborations with many authors over the years. Mere number crunching, however, it was not. The work was characteristically applied, thoughtful and purposeful, as is evident if we take ourselves back to the year after his professorial appointment and allow the pleasure of reading another of the items recovered from his Bristol office: his inaugural lecture, originally presented to his Sheffield audience in February 1975.
Two copies of that lecture were found, typed but with hand-written corrections annotated upon it. The original is now with the RGS-IBG. The second, a photocopy, is from which the transcript has been made and publishes Ron’s lecture for the first time (the lecture reveals that the University of Sheffield had stopped publishing inaugurals by the time of Ron’s own). It is based on the typed text but revised with Ron’s hand-written corrections wherever the original text was struck-through. The initial text and other annotations are recorded in an extended series of endnotes that seek also to reference the various citations that Ron made during the lecture and to identify the work of his colleagues within it. Omitted without comment are the few annotations not legible to me. In many more, they are revealing of the historical and geographical context in which Ron was writing, his care for accuracy and precision, and of how one idea sparked another in his mind. The lecture is presented as it may have been spoken although what we read is better understood as a scripted rehearsal because the lecture was delivered without notes on the day. Sadly, the slides that accompanied the lecture have not been found. It is often possible to imagine their content from what is described in the text.
Any inaugural is an opportunity to showcase not just oneself but one’s discipline to an audience. The tradition – not as common or as expected in British universities as it once was and therefore something of an endangered craft – is for a recently appointed professor to present what is essentially a ‘public lecture’ to colleagues, friends and families: to celebrate together the appointment/promotion and to provide some engaging ideas and research examples salient to the discipline to which the appointment has been made. Ron’s lecture achieves this with aplomb. It is an academic tour de force in which so many of Ron’s personal attributes come shining through – widely read, a passion for geography, a dry but generous humour, a respect for colleagues, an interest in their research and a healthy disregard for pomposity.
The title is written with the singular, definitive article: the spatial variable, which is defined early-on and somewhat prosaically as the distance between two places. However, much of the lecture serves to problematise that definition and expand upon its real-word complexity. Examples are drawn from political systems and elections, the study of socio-spatial inequalities, urban economic models, time–space geographies, mental mappings, and urban forms and functions, amongst other plentiful illustrations. Together these incorporate many of the research themes that Ron would develop in the many publications to follow. Ron’s goal in all this is clearly stated: ‘my examples of the spatial variable are organised to demonstrate the social validity, as well as the academic merit, of our [academic geography’s] work.’
Any lecture will reflect when it was written. Unsurprisingly, the language of Ron’s inaugural is gendered with the use of male pronouns because that was the grammatical style of its time. It has a geographical context: there are references to 1970s industrial policy, strife and into the operation of the welfare state. From this, and as someone himself interested in the histories of geographical thought, I hope that Ron would have welcomed what the lecture provides, an insight into contemporaneous debates within and beyond geography. It is a richly illustrated tapestry of how geographical ideas, study and thinking were being applied and developed in the early to mid-1970s in Anglo-American geography, embroidered by Ron’s own work and interests that, in turn, draw their threads from his colleagues and contemporaries.
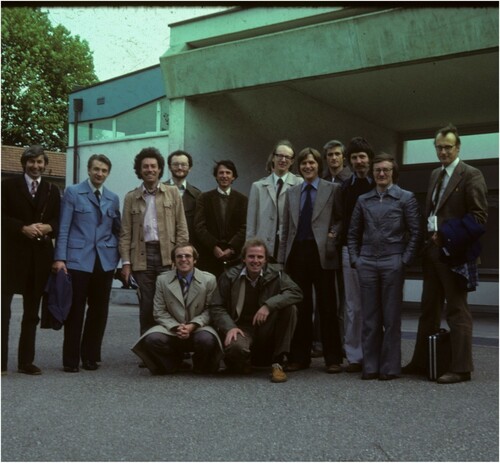
Historical hindsight can observe that it was written at the cusp of a contested period in human geography’s history, one that Ron would later document in the various editions of Geography and Geographers (including the most recent, Johnston & Sidaway, Citation2016). Much of the backlash against ‘the quantitative revolution’, spatial science and the adoption of abstract scientific / law-seeking methodologies was yet to be fully developed (Sheppard, Citation2001; cites Sayer, Citation1976, Citation1984 and Gregory, Citation1978, as particularly influential and post-structuralist critiques would follow). pictures Ron as part of the British delegation to the first European Colloquium on Theoretical and Quantitative Geography, held in Strasbourg in 1978 (the 23rd is scheduled for Portugal in 2023). Others present include future University of Bristol colleagues Les Hepple (see Harris et al., Citation2007) and Nigel Thrift amongst an extraordinarily talented group. Nevertheless, it is possible to detect Ron’s awareness of emerging humanistic and radical challenges in the lecture where, for example, he writes that ‘critics have claimed that much geography describes the recent past, with generalisations of no lasting interest and relevance for the rewriting of spatial patterns and processes’, where ‘what was generally termed efficiency’ in least cost models of distance minimisation ‘in retrospect seems to have been a synonym for profits’ and where ‘many people are critical, if not sceptical, of the value of spatial engineering’.
Figure 1. Showing Ron Johnston (second from left) with the British delegation to the first European Colloquium on Theoretical and Quantitative Geography in Strasbourg, 1978. Standing left to right: Lyndhurst Collins, Ron, Mike Bradford, Nigel Thrift, Bob Bennett, John Dawson (obscured), Les Hepple, Neil Wrigley, David Clarke, Stan Openshaw, Mike Batty, John Thornes. Crouching: Dave Unwin, Ray Harris. With thanks to Dave Unwin for helping to trace and contextualise the photograph.
By the 1980s, the criticisms were more strident:
one immediate criticism that can be levelled at quantification as it came to be developed in human geography … is that the data techniques used tended (and indeed still tend) to provide tacit support for certain entrenched social inequalities and views about the world. (Mercer, Citation1984, p. 182)
That position finds some early expression in the lecture where it states,
there are those who see that the problem is in the mode of production not in the mode of distribution. My sympathies are generally with them, but even in the best-ordered socialist state – if such a body politic is feasible – spatial allocation problems will be paramount, and spatial engineering will be necessary.
There is, for example, reference to the modifiable (areal) units problem, revealing that the term MAUP, or a near identical variant of that initialism, was in circulation well before it was popularised by Openshaw and Taylor (Citation1979). This is not simply a technical issue. The ways that (continuous) geographical spaces are divided into (discrete) geographical parcels have real-world consequences, including their role in deciding electoral outcomes – a role that Ron helped make visible (Johnston, Citation2015).
There is discussion, also, of the differences between absolute and relative space, the former of which can be warped, at a regional scale for instance, by technological advances (for example, jet aircraft or motorways) to reconfigure spaces of accessibility or of economic competitiveness. Arguably this is just a substitution of one distance metric with another; a revision to how inter-regional distances are encoded in a model’s spatial weights matrix. However, the lecture goes on to reference emerging work in mental mapping, providing awareness that, at the individual scale, conceptions of space and of spatial relationships are cognitively shaped by personal interactions with social and physical environments that both reflect and mediate the (space–time) geographies of our day-to-day lives. Indeed, whilst the lecture includes examples of the law-seeking areas of ‘scientific’ human geography, as it moves towards concluding so it leans away from the nomothetic towards the ideographic instead: ‘no study of a spatial variable can be understood outside of the context of the socio-cultural matrix in which it is operating […] Thus we need to steep ourselves in the socio-cultural and political milieux.’ It is hard not to find scepticism towards teaching the abstract and generalising ‘laws’ of socio-economic organisation that had gained prominence during Ron’s time as a student through to his appointment as Professor when reading,
I often wonder, for example, and as a parent rather than as a disciplinary empire builder, whether children should be searching Romania for central place hierarchies, Rossendale for rank-size regularities, and Rotherham for spatial patterns in the diffusion of measles, or whether they might not be better prepared for life, and for human geography, by learning about the society they live in.
Underpinning all of this is a question of geographical explanation, answers to which remain prescient to geographical enquiry today. This is not simply because, at the time of writing, the UK has returned to an era of sharply rising inflation, geopolitical tension, declining standards of living, rising fuel prices, second place in The Eurovision Song Contest and perhaps the reoccurrence of a Labour minority government, all reminiscent of the early-to-mid 1970s. Rather, it is because in the data-based age in which we live, data science and ‘big data’ are often heralded as offering solutions to a range of social and economic problems, many of which have spatial causes and expressions. This belief in data is present in the UK Government’s ‘levelling-up’ agenda, which includes the ‘mission’ that,
the UK government will transform its approach to data and evaluation to improve local decision-making. In the past, it has been difficult to see what is being spent, where and how it is being spent, and its impact. The Office for National Statistics’ Subnational Data Strategy aims to improve the UK’s subnational data, mapping local economic geographies and helping improve transparency and accountability to the public. The UK government is making available interactive tools and maps to facilitate this process. It will also encourage innovative uses of real-time data at the local level, giving leaders across the UK the information they need to deliver, experiment and evaluate swiftly and effectively. (Department for Levelling Up, Housing & Communities, Citation2022, p. 8)
The spatial variables [no longer singular] are complex and pervade many aspects of our lives; their measurement is difficult, teasing out their significance is trying, and using them as policy instruments is fraught with danger. Nevertheless, I hope to explore them while I am here.
Not all of Ron’s work is quantitative but, where it is, he effectively combined a thoughtful and reasoned approach to quantitative modelling with an enduring interest in new methods of analysis to advance geographical understanding across the discipline. He was fascinated by geography. Fascinated by the spatial variable. It is that fascination – that excitement – that spans across the lecture and was to be a geographical constant throughout his life.
The Spatial Variable
(Inaugural lecture by Ron Johnston OBE, FAcSS, FBA on his appointment to Professor at the University of Shef f ield)Footnote1
Vice chancellor, deans, ladies, professors, doctors, gentlemen: presentation of this lecture is by far the most nerve-wracking experience of my career, though fortunately not quite so impossible as it first seemed, when by some mischance, I was of fered the chair of Chemical Pathology. I gather that I am not obliged to give a lecture, for I was only invited; but the letter with the invitation also indicated time, date and place. Furthermore, I had only a few days previously been asked to send a photograph of myself, so I rapidly concluded that a refusal could not be countenanced. Perhaps I could have consoled myself with the other piece of information of fered in that fateful letter: the University no longer published its inaugurals – which I could have taken as an odd backhander to some of you here tonight. But then, on musing along a bookshelf, I found a Penguin book, which, the blurb told me, was Sidney Pollard's inaugural.Footnote2 And so, I of fered a title which would allow me to convey to this university – which had honoured me by its of fer of a post in its renowned hexagonal building;Footnote3 in which I suppose I am a hierarchical marginal good – to convey what it is within geography I am interested in; what I hope to teach and to research.
To many outside the university departments, geography as practised there does not correspond to their image of its subject matter and methods. And even within those departments, there is much debate, confusion, and ignorance about what is done under the title of geography (assisted, no doubt, by our recent advert in The Guardian, which suggests we are knocking the nails into our own cof f in). And so I should immediately identify my interests as being within human geography. Here there has been much change in recent decades. The continued expansion in numbers of academic geographers, outlasting the Robbins boomFootnote4 now falling behind student expansion; the struggle for charisma and status within the discipline; the increasing prestige given to publication records;Footnote5 and the increasing rate of change within the societies studied, as expressed in Alvin Tof f ler's Future ShockFootnote6: all of these have led to broadening vistas of geographic research. Many of the horizons are beyond the coastlines of other social sciences, so the topics investigated, including most of those discussed here, involve inter-disciplinary searching for explanation of the spatial processes and patterns which are my focus.
A final introductory point concerns the orientation of much of this research. Critics have claimed that much geography describes the recent past, with generalisations of no lasting interest and relevance for the rewriting of spatial patterns and processes. The demand is for work which will recognise the social inequalities of spatial systems, diagnose their causes, and prescribe policies for their removal. As a subscriber to this view, particularly with regard to long-term policy oriented ef forts, my examples of the spatial variable are organised to demonstrate the social validity, as well as the academic merit, of our work.Footnote7
___________________________
The spatial variable operates because every place on the globe has a unique location, both in an absolute and, if direction is considered, a relative sense. So the spatial variable might immediately be defined as the distance between two places. A further definitional problem arises, however; distance is measured between two points, but most places are areas, not points. And so is introduced the modifiable units problem.
This problem is in part one of our own making, since we choose to analyse areas as points, and in part it arises through the policies of the data-collecting agencies on whom we rely so often. But in many cases, the manipulable areas are real. The New Zealand Labour Party was well aware of this during their successful election campaign of 1972. (SLIDE)Footnote8 They set out to convince South Islanders of the need for a regional development programme, with this poster which indicates the perceived problem of all growth going to the North. (SLIDE) They made a similar pitch to non-metropolitan North Islanders with this poster, suggesting that all of the goodies were going to the Auckland and Wellington-Hutt urban areas. (SLIDE) Both posters had important elements of truth in them, suggesting that the area aimed at was likely to become a rural backwater; the implicit belief that this was a bad thing was, of course, a value judgement which they had to sell also.
Labour politicians are not the only people to modify the map for their own ends. Local Government Commissions do it too, and thereby influence the nature of the data with which we can operate. The general trend is towards a coarser mesh of areal units, and spatial analysis is increasingly being based on alternative formulations, such as the grid squares for which census data are now available and which give us greater flexibility in our approach to the scale problem.
Although many of the modifiable spatial units with which we deal are arbitrary creations, however, there are many which are ‘real’, and thus worthy of study of themselves. Many aspects of our lives and livelihoods are determined by the country and county, metropolitan district and ward, in which we live. Countries dif fer in, for example, their tax rates and defence arrangements. Within England and Wales, the Powys parent finds that there are on average 17.8 pupils to every teacher in his county's schools, whereas for the Sunderland parent the average is 26.7. (And we suspect that this means something, in terms of the quality of education as well as the quantity of the rates demand.) Here in Shef f ield Bryan CoatesFootnote9 has mapped many such inequalities, (SLIDE) as exemplified by the clear regional dif ferences in the pupil:dentist ratio within the School Dental Service, and Gwyn RowleyFootnote10 is involved in some intriguing research into educational inequalities within this city.Footnote11
Work such as this focuses on the spatial morphology of social inequalities and life styles and this field has expanded rapidly in recent years. As descriptive material, it is of great value, both for general education and elucidation, and for policy-maker guidance. And as such, this valuable work is all that philosophers of geography were requiring of their disciples until perhaps the last ten or fifteen years. Increasingly, however, there is a demand for explanations of the inequalities, explanations which numerous geographers claim should be based on the spatial variable. Such explanation is not always relevant. Space may be a passive stage only; (SLIDE) it of fers no explanation for the inter-state variations in assault rates displayed here, (SLIDE) nor for the similarly interesting variations in average prison sentence served by first-time felons. We might note, however, that states containing the largest cities apparently had the highest assault rates, which suggests that the spatial unit employed may be invalid; we may similarly expect to find variations in pupil:teacher ratios within both Powys and Sunderland.Footnote12
Many spatial variations such as those displayed here may be a product of population attitudes. As a consequence, it could be claimed that residents have the choices of accepting, trying to change, or leaving, (exit, loyalty and voice in current social science jargon) though it could well be that for the most disadvantaged the loyalty possibility is the only one available. In many cases, however, the spatial units are manipulated by some group, ostensibly or accidentally aimed at certain ends.
One of the most intriguing of these manipulative processes concerns constituency electoral systems, as was highlighted twice last year by the fortunes, or misfortunes, depending on your point of view, of the Liberal Party. The superimposition of constituencies on the continuous distributions of various population groups – supporters of the various parties plus the abstainers – produces a series of biases which lead to a mismatch, often a serious one, between a party's proportion of the national poll and the percentage of the constituencies which it wins. Important among these biases are the rotten borough ef fect, which is a product of constituency size variations; the turnout rate; the vote for the minor parties in each constituency; and the gerrymander ef fect, which is a consequence of the spatial clustering of votes for one party into certain constituencies, still occasionally an intentional procedure, as in Australia.
In New Zealand, it is the gerrymander ef fect which is most prominent. The tight margins of error for constituency size; the five-yearly redistricting; the very high turnout (c. 90%); and the general irrelevance of minor parties all preclude the other biases attaining major significance. There are two major parties – National (they're conservative) and Labour (they're conservative too) – and one minor party – Social Credit (they're incredible). Not surprisingly, the gerrymander ef fect is anti-Labour, the party with the most concentrated support, and the largest majorities. Our analyses suggest it can lead to it getting as many as sevenFootnote13 seats fewer – out of a total of 83 non-Maori seats – than the National Party would with the same proportion of the total poll.
Spatial decomposition of the New Zealand election results suggests further spatial inequalities in the assumed ‘one man, one vote’ system. The rural areas predominantly, if not exclusively, return National members. National also has safe seats in the ‘better’ suburbs of the larger cities – Auckland, Wellington, and Christchurch – whereas Labour has strongholds elsewhere in those cities, and also in Dunedin. There are some marginals in the big three, where constituencies overlap National and Labour strongholds. But the marginals – where the elections are won and lost and where the size of the anti-Labour gerrymander bias is determined – are mostly in the provincial cities; in Rotorua and Gisborne, Napier and Wanganui, Hastings and Invercargill. These are single-constituency towns, containing a mix of National and Labour votes; it is their populations, and especially their floating voters, who determine New Zealand’s political future every three years. Elsewhere, the probability that a change of mind will in any way af fect the result is extremely small.
The process of drawing the constituency boundaries is clearly crucial to the operation of this spatial variable, and one which deserves more study by geographers. Most countries have the boundaries drawn by an independent panel of commissioners, (SLIDE) but Peter Taylor's recent research has shown that in such cases the apparently neutral decision will undoubtedly favour the majority party because it has many more degrees of freedom in the amalgamation of areas to give it majorities.Footnote14 The present slide illustrates the probable form of the frequency distribution of all possible results at one election given dif ferent boundary decisions. One geographer – Dick Morrill of the University of Washington – was recently engaged by a court to redistrict his state, and encountered the many dif f iculties involved. One of these was that the variance in number of votes allowed between districts was 695, which was less than the average population size of the areas he had to manipulate to produce the districts.
We might categorise these various political units – countries and counties and constituencies – as absolute spaces, since they remove the unique location features of places by amalgamating them into bundles. Among other things, these areas may produce, reduce, or enhance inequalities among peoples. But I want to turn now to another spatial variable, accessibility, which is perhaps even more influential on various components of the quality of life. Two types of accessibility can be identified. Relative accessibility concerns the distance between one point and another, on some metric; relational accessibility, the more general case, concerns the distance between one point and all others in a given population.
Accessibility has long been investigated, though critics claim that we have a poor understanding of the concept and have developed only crude estimates of its parameters. A major area of study has been the changing patterns of relational accessibility consequent on the rapid urbanisation processes which have characterised most countries during the last century or so. Urbanisation brings with it a whole host of costs and benefits. Drawing mainly on economics for their theoretical base, geographers have spent much of the last twenty years looking at the benefits. Normative models were erected which included distance as a cost variable, and whose aims were the minimisation of total movement miles so as to maximise what was generally termed ef f iciency – which in retrospect seems to have been a synonym for profits. For example, people have a certain amount of money to spend: the more that goes on getting to the shops, the less that goes over the counter. And so was born central place theory, based on the axiom that people shop at the nearest centre and suggesting an ideal economic landscape of hierarchies of service centres arranged in neatly nesting hexagons (just like our building). The search for such hierarchies was a major task for a decade or more, with thousands of unsuspecting respondents being asked where they bought, or sought, their weekly sugar.Footnote15 Other models suggested that entrepreneurs locate so as to maximise profits; not only do they break the social contact and fail to read Galbraith,Footnote16 but they site their plants to minimise the costs of amalgamating inputs, processing them,Footnote17 and delivering them to market.
Increasingly, the costs of agglomeration – the concentration of accessibility – are being realised. Climates are changed. (SLIDE) Cities have noticeable heat islands, as shown in this London example with a clear break at the edge of the built-up area.Footnote18 Their rainfall tends to be greater than that of surrounding areas and their humidity lower.Footnote19 Wind speeds, too, are supposedly lower, though I have never noticed this when walking past the Arts Tower. The real costs of these modifications are not yet known, and nor are those of the related air pollution, whose extent has been so diligently assessed for Shef f ield by my distinguished predecessor, Professor Alice Garnett. (SLIDE) And there are social costs too, as indicated in this slide of crime rates for cities of varying size and density in the United States.Footnote20
The cost and time involved in covering distance means that accessibility is related to the spread and availability of information. This has been identified in a vast range of studies. In the world trade system, for example, it is the countries which are best located on information networks regarding markets that are most able to diversify their economic base. And during New Zealand's flirtation with prohibition – which still flickers every three years – the localised spread of information about the apparent benefits of the prohibition voted for in a South Island district early in this century led to a marked increase in the no-licence vote in adjacent districts at the next triennial poll.Footnote21 Even in today's mass-media saturation, such local information flows influence voting patterns; as shown by the experience (SLIDE) of this candidate in Christchurch's 1968 at-large city council election. Like many of the other forty candidates, he did much better at booths near to his homeFootnote22 than did the eighteen other members of his party. The same happens for Social Credit candidates in Christchurch's constituencies at national elections. One did exceptionally well – for Social Credit that is – in a series of booths along the main roads in one part of his electorate; these booths traced in quite precise detail the route of his milk round. Another did well in the neighbourhood of his butcher's shop, among voters with a stake in his future.Footnote23
Empirical tests of models of least-cost location, of interaction patterns, and of spatial spread and dif fusion have dominated human geography for a decade or more. They worked in part. Complete success was, of course, only expected by the sublimest of optimists. A major question raised by the results asked for greater sophistication in the measurement of accessibility; in brief, how do we measure distance? The easiest way might seem to be to get a map, run one of those little wheel things over the route, and try to work out kilometres from miles. But the models being tested use distance as a surrogate for transport cost, and the two are usually linearly related only in the logarithms, if then. ln some transport modes, substitution of distance for cost is clearly invalid (SLIDE) as this diagram recently produced by the Observer illustrates for flights from London to several major world cities. The models might be correct, therefore, but the data input invalid. For example, the total cost of an August 1974 package tour to Famagusta might have been cheaper than an inclusive holiday in Polperro. Changing fare structures have since altered the map of ‘cost distance to holiday’, but it undoubtedly has not become conformal with our conventional map of Europe, be it cylindrical or conical, Mercator or Mollweide.Footnote24
To many people, distance is not only cost but also time, and ef forts are now being made to map relative and relational temporal spaces. There are many dif f iculties involved, such as the method for including waiting time. For people able to use their own mode of transport – walking, bike, or car – waiting time might be irrelevant, but there will be obvious dif ferences in travel time depending on whether one drives an Aston Martin, Sunbeam Rapier, or Ford Escort. My former colleague Peter Perry showed how time–space maps altered markedly for the Dorset working-class after about 1885.Footnote25 Before then, his maps of distances between brides’ and grooms’ homes prior to marriage showed a very limited search space – to employ the relevant jargon – but widespread adoption of the bicycle during that decade enabled much wider searches, though in the terminology of relevant economic models, I imagine that the decision-making was still satisficing rather than optimising.
Time spaces do not alter in a uniform way. The motorways and the intercity express train services have clearly rearranged the map of Britain.Footnote26 In New Zealand, air transport is much more important for inter-urban travel and Pip ForerFootnote27 has shown (SLIDE) both that the country as a whole has shrunken in time–space and that the main centres – particularly Auckland, Wellington and Christchurch – have converged even more rapidly. This results from the introduction of Boeing 737 jets to serve those three and, less frequently, Dunedin, while the provincial towns, on the feeder and round the-island routes, are still serviced by Viscounts, Friendships, and the Dakota.
The time and cost aspects of distance can be related to another variable of relevance to many decisions, the spatial distribution of information. Again, we might suggest a linear relationship between time distance and information flow, but there are many deviations from this. Much international migration, for example, has been not from country to country but from locality to locality, the result of the chain migration process in which a few pioneer movers send back information and money to encourage their compatriots to join them. Thus the distribution of Dalmatians in New Zealand is very spotty, (SLIDE) and in the Wellington urban area, one-fifth of the Italian migrants come from but three villages in the Bay of Naples area; of the households from Massalubrense-Sorrento, two-thirds live next door to another household from their home village.Footnote28
The warped spatial pattern of information on which decisions such as those associated with international migration were made, led geographers to the study of mental maps, the spatial images on which people act. This was generated by some seminal work of Peter Gould's.Footnote29 Various groups of British school-leavers were asked to rank-order the ninety-odd counties of Great Britain according to how much they would like to live in them. (As a former Australian elector, I wonder how many donkey votes were given). Composite maps were then produced (SLIDE), such as this view from Redcar followed by a composite-composite (SLIDE) which shows the general perceived desirability of the south coast and the Lakes, and perceptual troughs over London, Birmingham, and the West Riding. Several other methods have been tried. (SLIDE) Boys like Dave and Ernest gave their maps of their neighbourhood – but this technique proved dif f icult for a graduate student interviewing a taxi-driver and a fire engine driver (SLIDE). And composite maps, such as these of Los Angeles, which depict the places named by residents of dif ferent areas, show the spatial pattern of information. (SLIDE) Doncaster Industrial Development Council developed this interesting representation of how they perceived Londoners’ perception of the barbarian north.Footnote30 The general concept of mental maps of fers much for the behavioural study of spatial decisions as Malcolm Lewis’ work here shows.Footnote31 This is an area of study which has developed in opposition to normative models such as central place theory; the development of procedures to tap the learning processes by which such maps are drawn and altered is still in its infancy, leaving us with plenty of experimentation ahead.Footnote32
___________________________
The examples I have used so far to illustrate the complexity of relative and relational accessibility as spatial variables have been concerned with large areas and distances. But similar relationships hold at micro-scales also, within cities, streets and cul-de-sacs, shopping centres and halls of residence, and it is in this area that much of my research has been conducted.
One of the most frequently studied relational spaces in human geography is the intra-urban residential mosaic, the patterns of socio-demographic separation into districts of varying character. (SLIDE) Generalisations about the spatial form of this mosaic developed out of the work of a group of Chicago sociologists in the 192OsFootnote33 and, with modification consequent upon changing social structures and public investment in housing, these notions of sectors of economic status, zones of family status, or life style, and clusters of immigrants (ethnic status), have been proved valid in a wide range of case studies. In the last decade, the advent of large data matrices from DOEFootnote34 and OPCS,Footnote35 large computers from IBM and ICL, and software from BMD and SPSS, all controlled by GEORGE,Footnote36 have enabled widespread close-grained analysis, (SLIDE) producing both single variable maps such as that reproduced here from the recent atlas of South Yorkshire, and composite maps representing the major variable inter-relationships, which we are now working on for this area.Footnote37
Such mapwork not only provides visual descriptive material of the social patterns in an area, but also important inputs for the investigation of a wide range of behaviour patterns which are, at least in part, a product of interaction between an individual and his social environment. Two types of research are involved here. The first comprises what I term areal studies, which search for correlations between, for example (SLIDE), the home addresses of juvenile delinquents in a town and the socio-economic status of the various census areas.Footnote38 Such work advances the descriptive tradition, but not the prescriptive. Among its problems are the assumption that ecological correlations are individual correlations, that, for example, because low income people and delinquents live in the same area, then delinquents earn low incomes. And although one can identify delinquency areas by this method, there is no test of environmental ef fects, that certain areas spawn delinquency.
It is in the second type of studies, what I call ecological studies, that environmental impacts are tested. These are based on the sociological theory of structural ef fects, which suggests that individuals are predisposed to act in certain ways because of their personal characteristics but that pressures emanating from their environment might lead them to behave dif ferently. (And some very interesting work on this topic is presently being published by criminologists here at Shef f ieldFootnote39). Thus the environmental impact is the structural, or neighbourhood ef fect.Footnote40 Much of this type of geographical study has been concerned with voting patterns, most of it outside Britain, because detailed polling results by booth are not counted, let alone published here. There is a long history of areal studies of this type of behaviour; one of them was once described to me as needing thirty-six variables and several hours of computer time to prove that Welsh miners vote labour.Footnote41 But geographers are now following the lead of Kevin CoxFootnote42 in postulating neighbourhood contagion ef fects which lead people to vote in dif ferent ways than would be predicted on the basis of their personal characteristics only.(SLIDE) The results show that voting patterns are more polarised than would be expected, as in this example of communist votes by precinct in Paris, where the solid line shows the relationship which would occur from the operation of individual ef fects alone.Footnote43 In some studies, the personal ef fects are assumed to be stable over time, and the contaminating neighbourhood ef fects associated with particular local issues. (SLIDE) Thus from our predictions of one mayoral candidate's votes at a 1971 election, based on his 1968 performance,Footnote44 we found that he got more votes than expected in the booths close to his proposed stadium for the Tenth British Commonwealth Games but less in the booths near to his opponent's proposed stadium and along the line of a proposed motorway; he also did better than expected – given that his vote was down overall – in the area around his home.
This method of ecological study can be applied to a number of behaviours in which environmental ef fects are likely, and I amFootnote45 presently working on delinquency, voting patterns, attitudes to environments, and shopping habits. The areal studies method is valuable in this, since it of fers surrogate variables where predictions of the individual ef fect are not possible. In this way, we hope to understand, at a macro-scale, some of the spatial inequalities within urban areas, to evaluate arguments of the sort so strongly advanced by Sir Keith Joseph,Footnote46 and to assess the validity of a spatial engineering approach to social engineering.Footnote47
Spatial inequalities also arise through variations in the accessibility of districts to various facilities and services, and there is a range of topics demanding attention concerning the nature of such inequalities. Many of these facilities are provided by private enterprise, or by public bodies directed by members of certain social groups with particular value judgements. Are all groups and areas in the city equally advantaged in their access to cheap supermarkets, doctors’ surgeries (at various times of the day), family planning clinics, hospitals, play groups, and childrens’ playgrounds, for example? And if not, are there important consequent variations in the quality of life? (SLIDE) There is considerable evidence, for example, which indicates a negative relationship between accessibility to a doctor, frequency of consulting him, and morbidity and mortality rates, depending on the complaint.
A further aspect of the quality of life in urban areas is the price which has to be paid for property there. The value of land and property is often taken as an index of the utility of a place, which seems to overlook the fact that many people have no option but to pay the asking price – or close to it – and carry the mortgage burden. The spatial variables are important influences on the pattern of intra-urban values. (SLIDE) The general morphology of the land value surface – depicted here by a series of cross-sections from city centre to periphery – is a function of relational space; the most accessible locations can attract the highest prices, and those involved in the land market ensure that they do. (Since the purchases are mostly in service rather than manufacturing industries, they can pass the land price on to customers without problem, since there is no objective measure of their productivity.) Drawing a tight urban fence around the city encourages land speculation and land value inflation, thus raising the general level of the surface, while the hopes of extensions of the fence encourage speculation in the immediate hinterland. Within the city, too, zoning, whether by planners attempting to separate land uses, education of f ices defining school catchment areas, or Earl Fitzwilliams imposing covenants,Footnote48 encourages speculation in each of the restricted markets so defined.Footnote49 I have shown only one such zone here – again suggesting positive externalities – but since all of the city is zoned, so the whole surface is raised, perhaps dif ferentially. Thus zoning policies have important negative ef fects, as well as the positive ones for which they are introduced. Nationalisation of development land may restrict the speculation in one area, but probably encourage it elsewhere.
___________________________
Investigation of the spatial variable involves a broad spectrum of human life, therefore, and I have ranged widely in my choice of examples to illustrate this, rather than confining myself to the one adjectival geography with which I am usually associated.Footnote50 There are many technical and conceptual problems involved in the measurement of the spatial variables, as in the association of those with behaviours and patterns. Rather than deal with these particulars in any detail, however, I want to finish with two general points that concern the application of such work.
The first of these generalisations is that no study of a spatial variable can be undertaken outside the context of the socio-cultural matrix in which it is operating. This point became very obvious to me in studying the egalitarian ethos of New Zealand's housing markets. Human geography is often seen as the application in a spatial context of the general laws of the other social sciences – economics and politics, sociology and psychology – which are relevant there, and, as geographers-cum-philosophers such as Bob Sack, have recently been stressing, the spatial variables have no relevance outside the substantive context.Footnote51 Thus we need to steep ourselves in the socio-cultural and political milieux. Locally this suggests that perhapsFootnote52 we need a Centre for Shef f ield Studies to parallel the excellent Centre for Japanese StudiesFootnote53; or perhaps the political milieu demands a Centre for South Yorkshire Studies in Centre for South Yorkshire Studies. More generally, it raises questions about the structuring of educational curricula. I often wonder, for example, and as a parent rather than as a disciplinary empire builder, whether children should be searching Romania for central place hierarchies, Rossendale for rank-size regularities, and Rotherham for spatial patterns in the dif fusion of measles, or whether they might not be better prepared for life, and for human geography, by learning about the society they live in.
My other generalisation concerns application and action. There is an increasing body of evidence which relates the spatial variables to various elements of the quality of life. And there are many claims – both academic and polemic – that manipulation of the spatial system can alter the quality of life. Richard Sennet,Footnote54 for example, has claimed that much conflict in cities is a function of class spatial segregation, of immature personalities retreating into known, secure social worlds of circumscribed districts, and that removal of such segregation would lead to improved knowledge of others, a mature accommodation to fellow-men, and thus a reduction of conflict through territorial defence. And some spatial engineering is undertaken, by local government housing departments, for example, which scatter their problem families around the estates, hoping that contact with normal households will convert them to accepted ways. Many people are critical, if not sceptical, of the value of spatial engineering, however. A large Chicago Regional Hospital Study by geographersFootnote55 a few years ago was received by medical administrators with amazement, that people could naively believe accessibility was a major problem, and we have a clear educational problem here.Footnote56 And then there are those who see that the problem is in the mode of production not in the mode of distribution. My sympathies are generally with them, but even in the best-ordered socialist state – if such a body politic is feasible – spatial allocation problems will be paramount, and spatial engineering will be necessary.
Spatial engineering schemes involve the search for welfare, for equality of life through access to society's resources. Futurists such as Daniel Bell, who wrote The Coming of Post-Industrial Society,Footnote57 suggest that it will be public welfare choices, rather than the market place, that will dominate future trends, though the events of the past year make many wonder whether it is in fact pre-industrial society which is coming, not post-industrial.Footnote58 In our present context,Footnote59 a problem of spatial analysis is the definition of welfare; two examples illustrate this.
A few years ago (SLIDE) Alonso reworked the classic Hotelling analysis of spatial competition, assuming an inelastic demand and no transport costs.Footnote60 The first ice-cream vendor locates centrally on the beach, which is the welfare location that minimises total transport. A competitor arrives, and eventually they find an equilibrium location pattern with both in the centre, but the welfare distribution has them sharing the market and being closer to the customers. When elastic demand and transport costs are introduced, the welfare pattern should emerge, but Mike Webber has demonstrated in his intriguing book on uncertainty in location that sequential location decision-making occurs with far from perfect knowledge and is usually conservative.Footnote61 Entrepreneurs usually follow other entrepreneurs, accentuating the existing concentration; (SLIDE) this is certainly so with shopowners in suburban Melbourne, almost all of whom have located in one of the centres alongside the major settlement nodes, the railway stations.Footnote62
The definition of spatial welfare used in this adaptation of the Hotelling model is minimisation of travel cost variance, making every customer as close as possible to a seller. This may be valid for ice cream sellers but is it for all commodities, ranging from jeans to jobs? Maybe in many cases welfare involves choice. (SLIDE) Stone's analysis of the linear market illustrates the benefits of concentration in such circumstances.Footnote63 If everybody in this linear urban area works at the nearest centre, then welfare is maximised – and travel costs are minimised – with a decentralised workplace distribution. But if choice were to be allowed, and workers were randomly allocated to workplaces, the decentralised pattern would be the most expensive. So if choice is an element of welfare, it may be better to concentrate jobs than to scatter them, which might only increase the rate of intra-urban migration.Footnote64
Of course, when we look at welfare in the real world we have a much more complex task. Our overall measure of societal welfare is frequently the per capita GNP. But many elements of GNP are not welfare at all; they are the recuperative costs of illfare. Construction of new schools is clearly an asset for society, an investment in the future, as would be the employment of nine more staf f members in the geography department. But a higher crime rate means more policemen, more prisons, more warders, more lawyers, and higher insurance premiums; a greater density of cars means more pollution, less ef f icient workforces, more hospital beds, more medical staf f and more medical schools: both of these processes are functions of urban size, and their costs are hardly indicative of welfare. So perhaps we should restructure the national accounts and derive a GNP measure that reflects welfare, and then we can simulate the costs and benefits of dif ferent population distributions. (SLIDE) Economists such as RichardsonFootnote65 argue that as long as benefits exceed costs, we should allow cities to grow, as suggested by his hypothetical curves. But this assumes that we are prepared to accept certain costs in order to achieve other benefits. Are we? Will we accept a higher rapeFootnote66 rate cost just to allow greater industrial profit benefits? One of our problems in this area concerns spatial scale. I have shown, for example, that crime rates apparently increase with city size, so the policy would seem to be for small towns. But I have also suggested the ecological ef fect of neighbourhood composition. Which should we tackle; the intra-urban or the inter-urban? There have been innumerable arguments for balanced neighbourhoods: would these be more ef fective than regional policies in reducing costs and increasing welfare?Footnote67
The problem of defining goals in welfare terms, and the positive and negative multipliers of the selected action, are also relevant when we discuss social engineering through the manipulation of absolute spaces. The evidence of studies on unintentional gerrymanders favours abolition of constituencies and introduction of proportional representation. But might this not also produce voter alienation and a tendency towards minority, and therefore weak, government? Within the city, should we have a highly centralized administration, with wide redistributive powers, or should we devolve power to community groups, thereby allowing BANG and its like – the strong neighbourhood government of the articulate intelligentsia – to dominate the urban scene?Footnote68 And tell you where to put students.Footnote69 Communities often only emerge under threat, so perhaps a rumour of motorways through every neighbourhood would have the desired ef fect, but who would win? The extent of the problem is superbly illustrated by Shepherd and Jenkins, (SLIDE) who studied the reorganisation of Detroit’s 21 school districts into between 7 and 11 new ones.Footnote70 The new districts had to comprise contiguous former districts and contain 25 to 50,000 students. 7311 dif ferent solutions were possible. Some would produce white domination of all districts, some maximised integration; others would maximise community control by the two racial groups, while others compromised on integration and community control. Which maximised welfare?
One of my many teaching tasks this year has been to share a course with Malcolm Lewis on philosophy and approaches in human geography. The theme of his second lecture was the importance of inaugural lectures as statements of current philosophy; he followed this with a discussion of the many ways in which confusion can be caused by the garbled transmission of messages, verbal and otherwise. I fear that my rambling discourse tonight has undoubtedly provided an excellent case study of the latter point. As to the former, I can only hope that I have given some ideas of my personal views. The spatial variables are complex and pervade many aspects of our lives; their measurement is dif f icult, teasing out their significance is trying,Footnote71 and using them as policy instruments is fraught with danger. Nevertheless, I hope to explore them while I am here. Of course, I had a pre-spatial training. I shall undoubtedly occasionally revert to discussing the uniqueness of places (SLIDE) whether it be to illustrate the dirtiest non-industrial city of its type in the Southern Hemisphere (Christchurch, New Zealand in winter) or to ask the question ‘what's in a name?’ by showing a slide of Shef f ield Midland station (SLIDE).Footnote72 I thank you for your patience in waiting for the sherry, which has yet to be reallocated along with other resources.
Acknowledgments
The inaugural lecture is published with the permission of the University of Sheffield and the family of Ron Johnston. I am grateful to Kelvyn Jones for providing additional context, to two referees for their helpful comments and feedback, and to Chris Philo for his supportive enthusiasm in bringing this all to print. Also to the Quantitative Spatial Science Research Group in the School of Geographical Sciences, University of Bristol for an insightful discussion of the lecture. The views expressed in the foreword are my own, as are any errors of interpretation of the lecture.
Disclosure statement
No potential conflict of interest was reported by the author(s).
Notes
1 Ron was appointed Professor of Geography at the University of Sheffield in 1974 at the age of 33. The inaugural lecture was given in February 1975.
2 Pollard (Citation1965)
3 A note in the margin suggests this is where all the teaching is undertaken.
4 The expansion of student numbers following the recommendations of the Robbins Report (Committee on Higher Education, Citation1963).
5 This is long before the first Research Assessment Exercise (RAE) of 1986 and its successor, the Research Excellence Framework (REF) which sharpened the focus on publication records more greatly.
6 Toffler (Citation1970)
7 This sentence was followed by another that is struck-out: ‘This is not, of course, to preach the need for all geographic research to follow such a line.’ It is not clear what, if anything, was substituted in its place but there is a note in the margin to not preaching a political line.
8 The word slide appears as written in the typed text. It was self-evidently a prompt for a slide to be projected. Unfortunately, I have bene unable to find a copy of the slides.
9 Co-author of Coates & Rawstrom (Citation1971) and, later, with Ron and Paul Knox, Coates, Johnston & Knox (Citation1977).
10 Accessed Feb 14, 2022. https://www.sheffield.ac.uk/geography/people/academic-staff/gwyn-rowley
11 There is note in the margin that it ‘could be that Scots have worse teeth’. This may be an example of Ron’s dry and sometimes mischievous humour.
12 A hand-written insertion in the text expands upon the previous sentence: ‘Or patient:dentist / patient:doctor in diff[erent] parts of Sheffield. Wage rates too.’
13 The original text says five but it is struck through and corrected to seven. It suggests that Ron had checked carefully the data/analytical results.
14 There is a note in the margin where Ron appears to query himself on this, writing, amongst less legible text, ‘certain?’ He may be questioning his use of the word undoubtedly, likely recognising that there could, in principle, be circumstances in which a minority party would benefit over the existing arrangements.
15 The hand-written text then appears to add, ‘carpets in Victoria’.
16 This seems to be a reference to Galbraith (Citation1973).
17 An annotation adds, ‘Focus on unreal worlds of rational man; does reality fit.’
18 A note in the margin prompts to discuss what the slide shows.
19 The name ‘Stan?’ is written above the text, with the question mark. It is likely a reference to Stanley Gregory: see Johnston (Citation2018).
20 There is a note in the margin to explain the crime rate in terms of P2/A, i.e. Population-squared divided by Area.
21 In the margin it is observed that this went ‘backwards later – wetness spread again.’
22 ‘where?’ is written above the word home.
23 Ron then adds the word ‘chop’, apparently adding to the butcher-based puns.
24 There is a note in the margin which suggests it would be interesting to get information from what appears to say holy tours (?) and their map cost-distances.
25 See Perry (Citation1969).
26 In the margin it reads, ‘forced to get to Hull 2 weeks ago – visit bridge to nowhere’ [Humber Bridge].
27 See Forer (Citation1973).
28 There is reference in the margin to an ‘Aliens Register’.
29 See Gould & White (Citation1974) and subsequent editions.
30 ‘THE NORTH’ is written, in capitals, above the full stop, which is also below the word representation. It may be a reference to motorway signs, which give directions to THE NORTH from London.
31 I have not yet identified which publication (if any) this is referring to but the person is G. Malcolm Lewis, who became Reader in Geography at the University of Sheffield. It may be related to ideas developed later, linking human cognition, and its development, to (mental) mapping: Lewis (Citation1987). I am grateful to Chris Philo for raising the connection.
32 The words ‘leaving us with’ are underlined. A note in the margin notes ‘present pessimism’ but also ‘may bring [understanding of?] behaviour.’
33 See, in particular, Park & Burgess (Citation1925).
34 Department of Employment
35 The Office of Population Censuses and Surveys
36 The name of an Operating System, named after the British computer scientist, George Felton.
37 The margin has the following notes: ‘clear sector in Sheff[ield]. yellow area. Mental maps of E Sheff. Hoyt Chicago model’. The last of those observations is a reference to Homer Hoyt’s, Citation1939 sector model of Chicago (Hoyt, Citation1939).
38 The margin notes that it is not an even distribution.
39 An example of that work, published a couple of years later, is Baldwin et al. (Citation1976). I am grateful to Kelvyn Jones for this observation.
40 The specific wording of a note in the margin is unclear but its meaning in relation to what is meant by a neighbourhood effect is not – ‘more [of some attribute or behaviour] […] in areas prod[uces] even more.’
41 The joke here is that you need neither the computer nor the variables to determine the obvious.
42 See, for example, Cox (Citation1971).
43 An annotation prompts to expand upon this in the lecture.
44 Written in the margin is ‘predn [presumably, prediction] equation.’
45 The text originally says ‘we are’ but this is struck through and changed.
46 Given the year of Ron’s appointment – 1974 – which is the same year that Sir Joseph co-founded the Centre for Policy Studies, these arguments were presumably against Keynesianism and in favour of monetarism/ free-market Conservatism, and perhaps also in defence of spatial inequalities (Joseph & Sumption, Citation1979). They also likely relate to Joseph's transmitted deprivation ideas. In June 1972, Sir Joseph, then Secretary of State for Social Services, referred in a speech to a 'cycle of deprivation' (Welshman, Citation2005). The Social Science Research Council (SSCR) funded a large body of work that did not find support for Joseph’s thesis. Subsequently he wanted to disband the SSRC and it was changed to the ESRC (Posner, Citation2002). I am grateful to Kelvyn Jones for expanding upon the history and context here.
47 The text strikes out the following: ‘I am fortunate to have moved to a department of geography with a strongly developed expertise in this field.’ It is impossible to say why it was omitted – or even if it was on the day – but given how much Ron recognises and appreciates the work of his colleagues and of the wider discipline in other parts of the lecture, it is unlikely that he would now have veered from the sentiment. Perhaps it was no longer factually correct: had some staff left for other universities or retired?
48 This appears to be a reference to various land covenants attached to land and parcels of property, formerly part of the Fitzwilliam (Wentworth) Estate.
49 The annotated text mentions ‘other places – school boundary’ and a ‘clear property value gradient [in] adverts.’
50 There is a note in the margin that appears to invite the audience to guess to which adjectives Ron might be associated!
51 See Sack (Citation1972).
52 The ‘perhaps’ isn’t in the typed text but is a hand-written addition to it.
53 Founded in 1963 at the University of Sheffield (source: Accessed Feb 15, 2022. https://www.japansociety.org.uk/review?review=364).
54 See Sennett (Citation1970a, Citation1970b).
55 See Morrill & Earickson (Citation1969).
56 Where the amended text refers to the educational problem, it replaced a previous sentence; ‘Of course, there are many other problems, but access undoubtedly often is one.’ It appears that, on reflection, Ron was less confident about this claim. In addition to being struck through, there is a question mark added before ‘but’ and after ‘is one.’
57 Bell (Citation1973)
58 This is likely a reference to the 1973 oil crisis and its effects.
59 ‘context’ may have been replaced with ‘climate’
60 Alonso (Citation1964)
61 Webber (Citation1972)
62 There is then a hand-written reference to what appears to be a documentary (?) called Making Sheep, with the point that the process begins with ‘few pioneers only.’ If so, then one can only hope that Ron took the opportunity to say to his audience that the pioneer ‘could be ewe.’
63 See Stone (Citation1954).
64 There is a note in the margin, not fully legible, referring to choice/services for a local GP.
65 This appears to be a reference to Harry W Richardson. See, for example, Richardson (Citation1973).
66 This is a stark and not immediately obvious cost of greater industrial profit other than in the (not unimportant) sense that allowing cities to grow in an unregulated manner may make them less safe. The original text says ‘higher rape rate’, which is corrected to say ‘higher rape rate cost’ suggesting it is not an error. Perhaps there was a particular context for highlighting this particular crime which has been lost?
67 An annotation adds, ‘Answer that q[uestion], have to find something else to do’!
68 This is a reference to Broomhill Action Neighbourhood Group, in Sheffield (see https://www.broomhillonline.org.uk/). In July 1974, the Government issues a consultation paper about neighbourhood councils in England (Lowe, Citation1978).
69 This amendment to the typed text seems to explain the mild disdain that is evident in the preceding sentence.
70 See Jenkins & Shepherd (Citation1972).
71 An insertion makes reference to the mathematical/statistical knowledge needed.
72 One can only imagine what it was about this name that Ron was showing but, given that it is clearly intended for amusement, it was probably unfortunate or teasing. A note adds, ‘if can’t see name, maybe see why I was taking to the hills.’
References
- Alonso, W. (1964). Location and land Use: Toward a general theory of land rent. Harvard University Press.
- Baldwin, J., Bottoms, A. E., & Walker, M. A. (1976). Urban criminal: A study in sheffield. Tavistock Publications.
- Beer, D. (2018). The data gaze: Capitalism, power and perception. Sage.
- Bell, D. (1973). The coming of post-industrial society: A venture in social forecasting. Basic Books.
- Castree, N. (2021). A tribute to Ron Johnston (30 March 1941–29 May 2020). Progress in Human Geography, 45(4), 617–622. https://doi.org/10.1177/0309132520938254
- Coates, B. E., Johnston, R. J., & Knox, P. L. (1977). Geography and inequality. Oxford University Press.
- Coates, B. E., & Rawstron, E. M. (1971). Regional variations in Britain: Studies in economic and social geography. Batsford.
- Committee on Higher Education. (1963). Higher education: Report of the committee appointed by the Prime Minister under the Chairmanship of Lord Robbins 1961–63. HMSO.
- Cox, K. (1971). The spatial components of urban voting response surfaces. Economic Geography, 47(1), 27–35. https://doi.org/10.2307/143223
- Department for Levelling Up, Housing & Communities. (2022). Levelling up the United Kingdom: Executive summary. Retrieved May 16, 2022. https://www.gov.uk/government/publications/levelling-up-the-united-kingdom.
- Forer, P. C. (1973). Space through time: A case study of New Zealand airlines. In E. I. Cripps (Ed.), Space–time concepts in urban and regional models (pp. 22–46). Pion.
- Galbraith, J. K. (1973). Economics and the public purpose. Houghton Mifflin Co.
- Gould, P., & White, R. R. (1974). Mental maps. Penguin Books.
- Gregory, D. (1978). Ideology, science and human geography. Hutchinson.
- Hall, P. (1982). Peter Hall. In C. E. Browning (Ed.), Conversations with geographers. Career pathways and research styles (pp. 57–74). Department of Geography, University of North Carolina at Chapel Hill. (Studies of Geography No. 16).
- Harris, R., Hoare, T., Johnston, R., Jones, K., Plummer, P., & Thomas, E. (2007). Les Hepple: An appreciation. Environment and Planning A, 39(7), 1275–1281. https://doi.org/10.1068/a4097
- Hartshorne, R. (1939). The nature of geography. Association of American Geographers.
- Hoyt, H. (1939). The structure and growth of residential neighborhoods in American cities. Federal Housing Administration.
- Jenkins, M. A., & Shepherd, J. W. (1972). Decentralizing high school administration in Detroit: An evaluation of alternative strategies of political control. Economic Geography, 48(January), 95–106. https://doi.org/10.2307/143018
- Johnston, R. (2015). Which Map? Which government? Malapportionment and Gerrymandering, UK-style (The government and opposition/Leonard Schapiro memorial lecture, 2014). Government and Opposition, 50(1), 1–23. https://doi.org/10.1017/gov.2014.25
- Johnston, R. (2018). Stanley Gregory (1926-2016). In E. Baigent & A. Reyes Novaes (Eds.), Geographers (biobibliographical studies); Vol. 37) (pp. 69–104). Bloomsbury Academic.
- Johnston, R., Jones, K., & Manley, D. (2019). Multilevel modeling of space–time variations: Exploring landslide voting patterns at United States presidential elections, 1992–2016. Geographical Analysis, 51(3), 280–313. https://doi.org/10.1111/gean.12176
- Johnston, R., Jones, K., Manley, D., & Owen, D. (2016). Macro-scale stability with micro-scale diversity: Modelling changing ethnic minority residential segregation – London 2001-2011. Transactions of the Institute of British Geographers, 41(4), 389–402. https://www.jstor.org/stable/45147048. https://doi.org/10.1111/tran.12142
- Johnston, R., & Sidaway, J. D. (2016). Geography & geographers: Anglo-American human geography since 1945 (7th edn.). Routledge.
- Johnston, R. J. (1974). Local effects in voting at a local election. Annals of the Association of American Geographers, 64(3), 418–429. https://www.jstor.org/stable/2562362 https://doi.org/10.1111/j.1467-8306.1974.tb00990.x
- Johnston, R. J. (1978). Multivariate statistical analysis in geography. Longman.
- Johnston, R. J. (1981). Ideology and quantitative human geography in the English-speaking world. In R. J. Bennett (Ed.), European progress in spatial analysis (pp. 35–50). Pion.
- Johnston, R. J. (1983). Philosophy and human geography: An introduction to contemporary approaches. Hodder Arnold.
- Johnston, R. J. (1984). A foundling floundering in world three. In M. Billinge, D. Gregory, & R. Martin (Eds.), Recollections of a revolution: Geography as spatial science (pp. 39–56). Macmillan.
- Joseph, K., & Sumption, J. (1979). Equality. John Murray.
- Kitchin, R. (2021). The data revolution: A critical analysis of big data, open data and data infrastructures (2nd edn.). Sage.
- Kwan, M.-P., & Schwanen, T. (2009). Critical quantitative geographies. Environment and Planning A, 41(2), 261–264. https://doi.org/10.1068/a41350
- Lewis, G. M. (1987). The origins of cartography. In J. B. Harley & D. Woodward (Eds.), The history of cartography, volume 1: Cartography in prehistoric, ancient, and medieval Europe and the Mediterranean (pp. 50–53). University of Chicago Press. Retrieved May 16, 2022. https://press.uchicago.edu/books/HOC/HOC_V1/HOC_VOLUME1_chapter3.pdf .
- Lowe, S. G. (1978). Local politics and community groups in Sheffield. University of Sheffield. PhD thesis. Retrieved Feb 16, 2022. https://etheses.whiterose.ac.uk/6010/1/276432.pdf.
- Mayer-Schönberger, V., & Ramge, T. (2018). Reinventing capitalism in the age of big data. Basic Books.
- Mercer, D. (1984). Unmasking technocratic geography. In M. Billinge, D. Gregory, & R. Martin (Eds.), Recollections of a revolution: Geography as spatial science (pp. 153–199). Macmillan.
- Morrill, R. L., & Earickson, R. (1969). Locational efficiency of Chicago hospitals: An experimental model. Health Services Research, 4(2), 128–141. Retrieved May 16, 2022. https://www.ncbi.nlm.nih.gov/pmc/articles/PMC1067214/.
- Murphy, A. B., Sidaway, J. D., & van Meeteren, M. (2022). In Memoriam: Ronald John Johnston, 1941–2020. Annals of the Association of American Geographers. https://doi.org/10.1080/24694452.2021.2009721.
- Openshaw, S., & Taylor, P. J. (1979). A million or so correlation coefficients: Three experiments on the modifiable areal unit problem. In N. Wrigley (Ed.), Statistical applications in the spatial sciences (pp. 127–144). Pion.
- Park, R. E., & Burgess, E. W. (1925). The city. The University of Chicago Press.
- Pattie, C., Taylor, P., & Jones, K. (2021). Johnston, Ron, 1941-2020. Biographical Memoirs of Fellows of the British Academy, 20, 89–109. Retrieved 29 March, 2022. https://www.thebritishacademy.ac.uk/publishing/memoirs/20/johnston-ron-1941-2020/
- Perry, P. J. (1969). Working-class isolation and mobility in rural dorset, 1837-1936: A study of marriage distances. Transactions of the Institute of British Geographers, 46(March), 121–141. https://doi.org/10.2307/621412
- Pollard, S. (1965). Economic history – A science of society? Inaugural lecture delivered 28 October 1964. University of Sheffield.
- Posner, M. (2002). Social sciences under attack in the UK (1981-1983). La revue pour l’histoire du CNRS [online], 7. https://doi.org/10.4000/histoire-cnrs.547.
- Richardson, H. W. (1973). Optimality in city size, systems of cities and urban policy: A sceptic's view. Urban Studies, 9(1), 29–48. https://doi.org/10.1080/00420987220080021
- Sack, R. D. (1972). Geography. Geometry and explanation. Annals of the Association of American Geographers, 62(1), 61–78. https://doi.org/10.1111/j.1467-8306.1972.tb00844.x
- Sayer, A. (1976). A critique of urban modelling: From regional science to urban and regional political economy. Progress in Planning, 6(3), 187–254. https://doi.org/10.1016/0305-9006(76)90006-4
- Sayer, A. (1984). Method in social science: A realist approach. Hutchinson.
- Sennett, R. (1970a). Families against the city. Harvard University Press.
- Sennett, R. (1970b). The uses of disorder. Vintage Books.
- Sheppard, E. (2001). Quantitative geography: Representations, practices, and possibilities. Environment and Planning D, 19(5), 535–554. https://doi.org/10.1068/d307
- Singleton, A., & Arribas-Bel, D. (2021). Geographic data science. Geographical Analysis, 53(1), 61–75. https://doi.org/10.1111/gean.12194
- Stone, R. (1954). Linear expenditure systems and demand analysis: An application to the pattern of British demand. The Economic Journal, 64(255), 511–552. https://doi.org/10.2307/2227743
- Toffler, A. (1970). Future shock. Random House.
- van Meeteren, M., & Poorthuis, A. (2018). Christaller and “big data”: Recalibrating central place theory via the geoweb. Urban Geography, 39(1), 122–148. https://doi.org/10.1080/02723638.2017.1298017
- Webber, M. (1972). Impact of uncertainty on location. Australian National University Press.
- Welshman, J. (2005). Ideology, social science, and public policy: The debate over transmitted deprivation. Twentieth Century British History, 16(3), 306–341. https://doi.org/10.1093/tweceb/hwi027
- Whitworth, A. (2019). Towards a spatial social policy: Bridging the gap between geography and social policy. Sage.