
 ?Mathematical formulae have been encoded as MathML and are displayed in this HTML version using MathJax in order to improve their display. Uncheck the box to turn MathJax off. This feature requires Javascript. Click on a formula to zoom.
ABSTRACT
Few publications have considered the urban heat island (UHI) effect in small settlements. This paper, therefore, presents the findings of a UHI study conducted in the small, mid-latitude city of Inverness, Scotland (population: 63,220). The study aimed to provide an initial appraisal of the scale of UHI phenomena in Inverness and to understand the factors associated with its presence. Mobile vehicular traverses of a study transect were conducted on 30 dates during June, July & August 2019. Measurements of near-surface air temperature were recorded at 19 local climate zone observation points between 20:00 and 23:00 BST. Daily mean UHI intensity (UHII) during the study ranged from 0.7 to 3.5°C, with an overall mean UHII of 1.6°C. Land use characteristics impacted the UHII, with areas with higher fractions of impervious surface cover returning significantly higher air temperatures. UHII increased with the onset of sunset, and the highest UHII occurred on dates with up to 1–2 oktas of cloud cover, low relative humidity, and high cloud base height. The results align with previous studies and comparisons are drawn between Inverness and other settlements globally. Further research in Inverness is recommended to better understand UHI effects and influence national planning policy.
Introduction
Rapid urbanisation is occurring globally to the extent that most of the world’s population now resides in urban areas (United Nations, Citation2019). The urban heat island (UHI) effect has recognised the extent of climate change resulting from urbanisation since first studied by Howard in Citation1883.
The UHI effect is observed where air temperatures in urban areas exceed those of surrounding rural environments. Several classifications of UHI exist, determined by their reference location within the urban area (Oke, Citation1995). The near-surface UHI (hereafter referred to simply as UHI) is the effect directly experienced by human populations and is determined at approximately 1.5 m above ground level. This effect is known to exacerbate the physical impact of heatwaves (Ward et al., Citation2016) which have increased in prevalence and scale over the past 60 years, particularly in response to anthropogenic activities (Perkins-Kirkpatrick & Lewis, Citation2020). In addition, significant impacts on phenology are noted in areas experiencing the UHI effect (Zipper et al., Citation2016).
Human activity and land use decisions in urban areas, such as work, travel, industry, and residence, are sources of anthropogenic heat. These are measured together by the anthropogenic heat flux (QF) within the surface energy balance (Equation 1). QF increases the net all wave radiation (Q*) of the urban area, and thus the intensity of the UHI effect (UHII) experienced,
(1)
(1) where QH is the sensible heat flux, QE is the latent heat flux, and QG is the ground heat storage (all fluxes also measured in rural environments). UHII provides a local measure of one type of anthropogenic climate change (Oke et al., Citation2017). It is determined by calculating the difference between the urban air temperature (TU) and the temperature of the surrounding rural environment (TR),
(2)
(2)
To date, much of the literature has focussed on the extent of the UHI effect in larger settlements (population >100,000). The effect poses more noticeable threats to human populations in these areas, particularly in terms of heatwaves and air quality (Tan et al., Citation2010). For example, Taylor et al. (Citation2015) found there to be increased relative risk of mortality due to heat for individuals living within a UHI in London, England. Particularly where development space is limited, UHII may increase as vertical building growth encourages a ‘street canyoning’ effect resulting in altered airflow (Longley et al., Citation2004) and increased pollutant residence time (Farrell et al., Citation2015). In addition, a lack of pervious surfaces (e.g. parkland, trees, marshlands) leads to increased surface water runoff into artificial drainage systems. This situation results in an increase in QH and a decrease in QE within the urban surface energy balance (Equation 1) as less water is available for evaporation.
It is acknowledged that the UHI effect may manifest in all urban areas and can often be modelled by population size (Oke, Citation1973). However, interactions between land use, urban form, climate and prevailing weather also impact the UHII (Oke, Citation1982). The UHII of New York City (population: 8.3 million) can exceed 8°C (Gedzelman et al., Citation2003); in the city of Hong Kong (population: 7.5 million) it can reach 3.8°C (Siu & Hart, Citation2013); and in Glasgow, Scotland (population: 1.7 million) a maximum UHII of 8.3°C was recorded by Hartley (Citation1977). It is therefore clear that such complex interactions lead to a unique set of UHI characteristics in each settlement (Grimmond, Citation2007).
Increasing the safety, resilience and sustainability of urban areas is a current goal of the United Nations (Citation2015). Reducing the UHI effect is therefore a key to achieving sustainable development within urban areas. Reconfiguring land-use, building design and activities within the urban area, in a way which improves the surface energy balance (Equation 1), can reduce the impacts of the UHI effect (Akbari et al., Citation2015). The necessary actions to do so are eminently more achievable in smaller or new plan settlements where there may be greater opportunity to prevent rather than mitigate the UHI effect. Ahead of any such interventions, it is beneficial to gain a better understanding of why and how the phenomena manifests itself (Eastin et al., Citation2018).
This paper therefore presents the results of an experimental campaign conducted in the small city of Inverness, Scotland which has experienced one of the fastest urban expansions in Europe in recent years (Highlands and Islands Enterprise, Citation2015). The study sought to undertake an initial appraisal of the scale of UHI phenomena in Inverness over a period of three months during summer 2019.
Study area
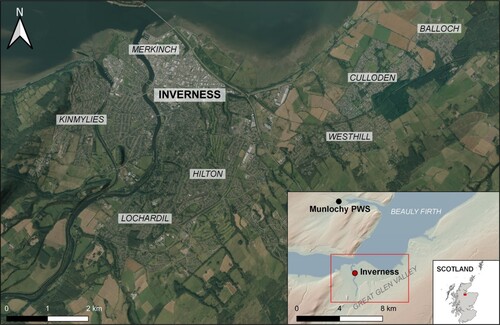
The city of Inverness is located in the north-east of Scotland (57.48° N, 4.23° W, ). Inverness is situated at the north-eastern end of the ‘Great Glen’ valley, on the banks of the River Ness close to its confluence with the Beauly Firth. The city’s population expanded by approximately 54 per cent between 2001 and 2016 and was most recently estimated at 63,220 (National Records of Scotland, Citation2018). This expansion gave rise to considerable urban sprawl, with several former villages and townships now contained within the city’s footprint. The city presently has a built-up area of approximately 23 km2 (Morton et al., Citation2020), the topography of which is determined by the U-shaped morphology of the Great Glen. Terrain altitude varies from sea-level up to approximately 8 m a.s.l. in the city centre, and approximately 150 m a.s.l. at the valley sides.
Figure 1. Location of the city of Inverness, Scotland and its main former townships and villages. Created using LiDAR DTM data – crown copyright Scottish Government, SEPA and Scottish Water, and aerial imagery – copyright Getmapping plc.
Buildings in the city centre do not generally exceed 5 storeys, and land use is predominately retail, office, and accommodation space. Greenspace within the city confines is expansive, extending to approximately 11 km2, including two golf courses and several parks and recreation pitches. Housing developments radiate from the city centre to the south, west, and east, and range from post-war terraced housing in the inner suburbs to detached and semi-detached dwellings in the outer suburbs. North of the city centre, land use is predominantly industrial and includes a mainline railway station with freight railhead and a small port. Industrial estates provide warehousing and workshops, major retail units and manufacturing plants.
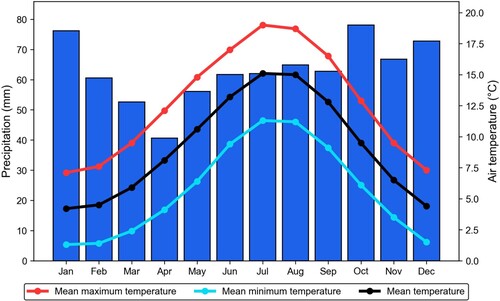
Inverness experiences a temperate oceanic (Köppen Cfb) climate, with a mean annual temperature of 9.3°C. The mean temperature of the warmest month, July, is 12.0°C and the mean temperature of the coldest month, January, is 4.2°C. The surrounding mountainous topography is responsible for a ‘rain shadowing’ effect (McClatchey, Citation2014). Thus, mean annual rainfall is low at 755 mm, and is generally well-distributed throughout the year (). The mean windspeed in Inverness is gentle, varying from 3.9 to 5.4 ms−1 throughout the year.
Figure 2. Climate of Inverness, Scotland. Created using 1991–2020 climate data courtesy of the Met Office.
Materials and methods
For such an initial appraisal of the UHI effect in Inverness, it was decided that an experimental campaign focused on data collection along a well-considered study transect would be of most value scientifically. Such a method affords a high-resolution understanding of the near-surface temperature conditions, otherwise unavailable through the alternatives of remote sensing or existing meteorological station data. This method involves observation of near-surface air temperature using a vehicle-mounted sensor and global positioning system (GPS) and has demonstrable success in similar previous UHI studies (e.g. Chandler, Citation1962; Graham, Citation1993; Hartley, Citation1977; Yokobori & Ohta, Citation2009).
Transect
Observation points along a 9.25 km transect were chosen to include a selection of urban, suburban, and rural surface fabrics, and greenspace (). It was necessary to account for the potential distance taken for air temperature at 1.5 m to adjust to that of the respective surface being studied (Oke, Citation2004). Therefore, in line with Stewart and Oke (Citation2012), 250 m radii circle buffers were applied to the observation points within a QGIS geographical information system (GIS) and used to define the observation area for each observation point. This resulted in 19 observation points spaced equally along the study transect. Consideration was given to the transect accessibility for a motor vehicle during the selection phase, enabling travel in both directions and an ability to turn easily at each end.
Figure 3. Location of the transect route within the study area, detailing air temperature observation sites with local climate zones (LCZs). Dominant surface type determined using data from Morton et al. (Citation2020).
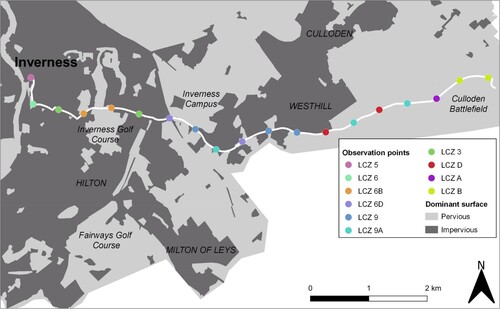
To facilitate comparison between the observation points used in this study and those of other published works, the local climate zone (LCZ) of each observation point was determined by using Stewart and Oke’s (Citation2012) method of using building and surroundings metadata. Shapefile data from the UK Centre for Ecology & Hydrology (UKCEH) 2019 land cover map (Morton et al., Citation2020) was used within the GIS to calculate fractions of pervious and impervious surfaces within the LCZ observation areas. Dominant land cover types were thereby determined using Stewart and Oke’s (Citation2012) definitions in conjunction with recorded site observations.
Observations
The UHI effect is generally observed at its strongest intensity following sunset (Oke et al., Citation2017), hence focussing on a nocturnal study offered the best opportunity to observe UHI signals within a limited time budget.
Near-surface air temperature was observed using a calibrated fast-response thermistor (accurate to ±0.1°C) mounted within shielding to the roof of a hatchback car at a height of approximately 1.5 m from ground level. Shielding for the thermistor comprised a capped PVC tube of length, diameter, and thickness 250/30/2 mm. Louvres were included along the tube’s length to enable airflow whilst shielding the thermistor from precipitation and direct short- and long-wave radiation. Owing to the late onset of sunset during the study period (reducing from 22:05 BST in early June to 20:15 BST in late August), the outside of the shielding was coated white to increase its albedo and reduce temperature error from direct insolation. A hole was drilled centrally in one end of the tube through which the thermistor was inserted and held in position. The apparatus was mounted lengthways on the centre of the roof, parallel to the direction of travel to enable the free flow of air around the thermistor. A series of test traverses, using a field assistant to conduct static measurements at a variety of observation points simultaneously, confirmed that varying the speed of vehicle motion between 0 and 40 km/h did not impact the result of the mobile temperature observations.
5 round-trip observational traverses of the transect route were conducted between 20:00 and 23:00 BST on 30 dates between 01/06/2019 and 31/08/2019, totalling 150 round-trip traverses. Traversing the transect in both directions enabled a closed loop of data. To eliminate observational bias associated with potentially favourable meteorological conditions, 10 observation dates per month were pre-selected with dates chosen in pairs of two consecutive days spaced equally over each month. Observations were collected at 250 m way pointed intervals pre-loaded on a GPS device (accurate to ± 3.65 m). A vehicle speed of approximately 35 km/h was maintained throughout the observation period, except during infrequent traffic light stops.
Data processing
Owing to the study area’s situation within a valley, observation points 2–19 were situated at higher elevations than Inverness city centre (determined as observation point 1). Elevation temperature control was, therefore, necessary to avoid misrepresentation of air temperature due to a potential decrease in temperature with height between 8 and 150 m a.s.l. (per Hathaway & Sharples, Citation2012). The dry adiabatic lapse rate (9.8°C air temperature decrease per 1,000 m elevation gained) was therefore applied to the data using the formula
(3)
(3) where Tcorrected is the air temperature measurement corrected for change in altitude, Traw is the uncorrected air temperature measurement, z is the observation point altitude in metres, and zcity is the altitude of the city centre in metres.
The mean air temperature was determined at each observation point for each date of study. The daily nocturnal UHII was then calculated by Equation (2) where TU is the maximum city centre air temperature, and TR is the mean of the rural air temperatures (determined as observation points 16–19).
Results and discussion
Characteristics of urban heat island intensity in relation to land use
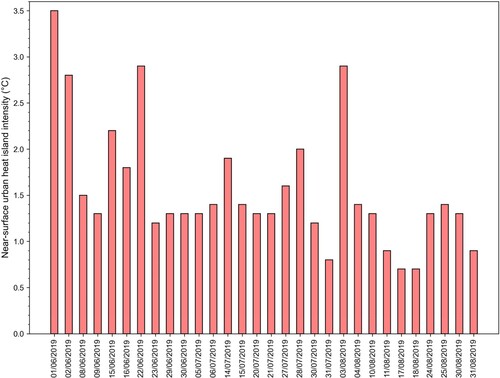
Measured near-surface air temperature decreased significantly between urban and rural areas in Inverness from 20:00 to 23:00 BST (). A mean nocturnal near-surface UHII of 1.6°C was determined following statistical analysis of 5,700 observations made between June and August 2019 (). UHII varied between 0.7°C and 3.5°C during the observation period ().
Figure 4. Mean near-surface air temperature profiles for each of the 5 traverses measured along the study transect route from Inverness, Scotland to the surrounding rural countryside over 30 dates between 01/06/2019 and 31/08/2019.
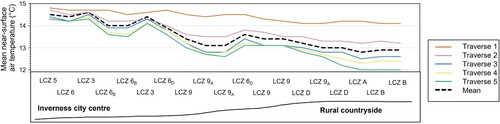
Table 1. Statistical analysis of nocturnal near-surface UHI intensity (UHII) study transect results collected in Inverness between June and August 2019.
Figure 5. Observed nocturnal near-surface urban heat island intensity in Inverness, Scotland on each observation date between 01/06/2019 and 31/08/2019.
UHI phenomena was increasingly well pronounced with the onset of sunset across the study area (). Very limited difference in mean near surface air temperature was observed along the transect during Traverse 1 which commenced at 20:00 BST, before sunset on each date. In general, differences in temperature continued to increase until becoming steadier by Traverse 4. A notable exception to this occurred in rural observation points 16–19 (LCZs D, A, B and B respectively), where near-surface air temperature continued to decrease by a mean of 0.4°C from the previous traverse. By Traverse 5, the final traverse of the evening and occurring well after sunset, the greatest differences were recorded between urban and rural observation points. This demonstrates a level of delayed heat release from the urban environment, in line with Oke et al. (Citation2017).
provides a breakdown of the ‘local’ UHII by calculating the mean near-surface air temperature of each LCZ type within the study and highlighting the difference between LCZs. It shows that the highest UHI intensities were observed near to Inverness city centre (LCZs 3, 5 and 6) where anthropogenic activity is most concentrated and building infrastructure is larger and denser than elsewhere on the transect. LCZ 3 returned the highest mean air temperature of 14.6°C across the study () with its overall mean UHII 0.1°C higher than that recorded at the city centre observation point (LCZ 5).
Figure 6. Near-surface air temperature difference between the local climate zones (LCZs) studied in Inverness, Scotland over 30 dates between 01/06/2019 and 31/08/2019.
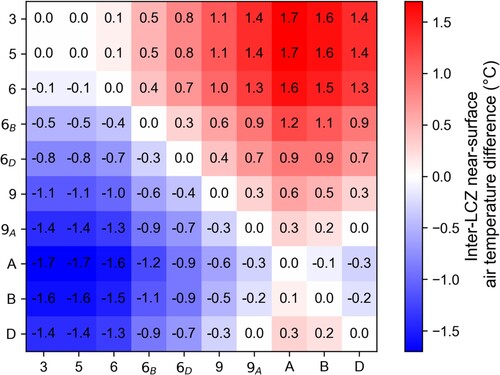
A notable drop of 0.5°C in the mean urban air temperature occurred at observation points 4 and 5 on the transect. At these locations, the transect passed through trees bounding Inverness Golf Course and surrounding parkland (LCZ 6B). A steady decline in temperature was observed as the transect progressed further out of the city towards Inverness Campus and the city’s ‘green corridor’. At observation points 9 and 10, temperatures were 1.4°C lower than in the city centre. Much of the woodland cover within these areas (LCZ 9A) has since been removed and the land redeveloped for housing.
Observations within the rural countryside were generally consistent except for observation point 17 which included an area of dense trees (LCZ A) and was 0.1–0.2°C cooler than its surrounds.
Relationship between air temperature and pervious surface cover
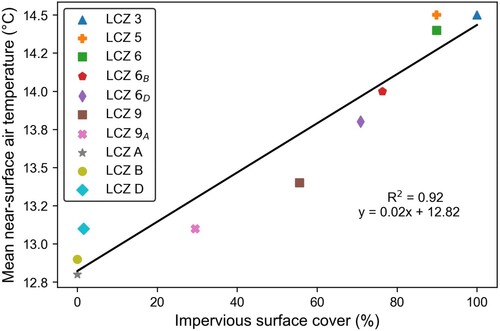
In the previous section, several examples were highlighted whereby air temperature varied in response to different land uses, particularly woodland and parkland. Whilst comparing differences in air temperature with greenspace cover can effectively explain intra-observation point UHI variability during the summer months (Hamada & Ohta, Citation2010), changes in plant transpiration rate render this approach less effective year-round. van Hove et al. (Citation2015) found that comparing differences in air temperature with building surface fraction enabled a strong predictor for intra-observation point UHI variability at any time of year. A linear regression analysis was therefore carried out between the air temperature and the fraction of pervious surfaces within respective LCZs, based on data from Morton et al. (Citation2020). illustrates the result of the linear regression covering the full duration of the study and indicates a strong relationship between air temperature and land use (R2 = 0.92). A two-tailed t-test confirms that this relationship is significant (p = .008352) at an alpha level of .05.
Figure 7. Relationship between mean near-surface air temperature and fraction of impervious surface within 250 m of the observation points studied, by local climate zone (LCZ).
Understanding the impact of meteorological conditions
Inverness city is subjected to meteorological conditions arising from its proximity to the coast, the River Ness, and wider situation within the Great Glen valley. It is therefore necessary to consider the how these conditions may have impacted the results of the study. Meteorological reports from Munlochy PWS (Met Office ID: 882856001), located at a semi-rural site approximately 8 km NNW of the city centre (), were obtained post hoc and analysed alongside field notes for this purpose ().
Table 2. Summary of wind and cloud cover conditions at Inverness during the study period.
On dates with a high UHII (UHII > 1.6°C), mean wind speed did not exceed 1.3 ms−1. This is consistent with findings at coastal locations elsewhere (Kolokotsa et al., Citation2009; Pinho & Orgaz, Citation2000). On these dates wind direction was generally variable, owing to the low wind speed.
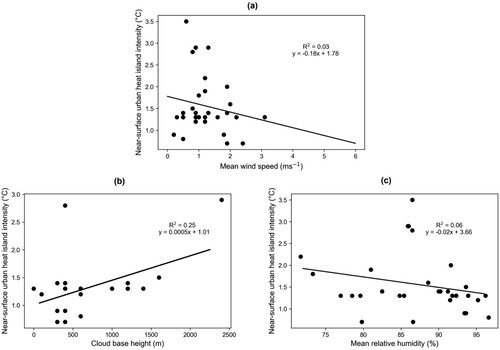
Mean wind speeds were often higher on low UHII dates (UHII < 1.6°C), reaching up to 3.1 ms−1. When analysed using linear regression, there appears to be a weak negative relationship between mean wind speed and UHII (R2 = 0.03) (a). However, application of a two-tailed t-test confirms that this relationship is not significant (p = .56826) at an alpha level of .05.
Figure 8. Relationship between daily nocturnal near-surface urban heat island intensity and (a) wind speed, (b) cloud base height, and (c) mean relative humidity on each of the 30 dates studied between 01/06/2019 and 31/08/2019.
Murphy et al. (Citation2011) found that prevailing wind direction can have a strong influence on UHII where a settlement is located near to a coastal location and vulnerable to sea breeze effects. No real trend was determined between UHII and wind direction across the observation period. Wind direction varied principally between the two prevailing directions and ‘variable’ owing to lower wind speeds.
Cloud base height and cloud cover were variable throughout the observation period. The highest recorded UHIIs occurred on evenings with limited cloud cover and a high cloud base height. A positive relationship between UHII and cloud base height exists upon linear regression analysis (R2 = 0.25), which is significant (p < .001) at an alpha level of .05 on application of a two-tailed t-test (b). Cloud cover on all high UHII dates was non-existent to few (1-2 oktas), with 75 per cent of dates exhibiting no cloud. This is likely due to the occurrence of enhanced nocturnal radiative cooling in rural areas where there is a lack of cloud cover (Morris et al., Citation2001). These results therefore compound understanding of fundamental physical effects associated with cloud cover and air temperature, namely the greenhouse effect and turbulent mixing by thermals.
Several studies identified a negative relationship between UHII and relative humidity (RH), whereby as RH increases the UHII decreases (Eastin et al., Citation2018; Kim & Baik, Citation2002). Linear regression of RH and UHII on each date of the study revealed a similar negative relationship (R2 = 0.06), confirmed as significant (p < .001) at an alpha level of .05 within a two-tailed t-test. (c). Thus, in practice, it might be expected that UHII would be lower after a period of rainfall owing to increased evaporative cooling of the urban surface. Conversely, often the dominance of impermeable materials within the urban area leads to reduced evaporative cooling due to their provision of prompt surface water runoff. It is therefore not surprising that Kim and Baik (Citation2002, p. 655) regard RH as the ‘least important predictor’ of UHII.
Frontal passages, which involve the movement of air masses associated with weather fronts, can potentially impact UHII (Gedzelman et al., Citation2003; Szymanowski, Citation2005). During frontal passages, the arrival of cooler air and changes in wind patterns can lead to reductions in UHII by providing greater ventilation and cooling effects. Eastin et al. (Citation2018) built on earlier fundamental understanding of UHI dynamics and concluded that dates without frontal passages are optimal for higher magnitude UHI development. During the observation period, only 2 frontal passages were experienced (). 1 of these passages was on a high UHII date (UHII >1.6°C), and 1 was below this threshold. Therefore, it is challenging to make definitive conclusions as to their impact on UHII dynamics during this study.
Conditions with no precipitation have previously been found to be optimal for UHI development (Eastin et al., Citation2018; Hartley, Citation1977). Precipitation was consistently very low throughout the observation period. Trace levels of precipitation were observed on 9 of the 30 dates studied, with the highest recorded level reaching 1.5 mm. Such levels made no discernible impact on UHII observed.
Comparison with other settlements
The majority of UHI publications address the effect in larger settlements (population >100,000), where the impacts are often more pronounced. However, it is important to acknowledge that other factors such as weather and climate, local physical geography, and urban form are of relevance in inter-settlement UHI variability comparison. Not all studies consider the UHI effect during the summer months which introduces a limitation to the comparisons made by this study (). Therefore, whilst comparisons are made here between this study and others, it should be considered that the UHII may be different during other seasons. This is due to reduced solar insolation, increased heating demand and waste heat generation in urban areas, and greater presence of temperature inversions.
Table 3. Review of near-surface UHI intensity (UHII) in selected cities, by population, latitude, Köppen climate classification and season recorded.
The closest comparator study in terms of population size is that of Hania, Greece (population: 53,000). Both cities have a significant coastal influence, but there are notable distinctions in terms of climate and built-up area. Hania experiences a hot-summer Mediterranean (Köppen Csa) climate and has a greater built-up area compared to Inverness. The study conducted in Hania during the summer months registered a mean UHII of 1°C higher than that observed in Inverness. With due consideration given to Hania’s climate and built form, the UHII value is a useful comparator in terms of settlement size.
The cities of Fairbanks, USA (64°N) and Brandon, Canada (50°N) are the closest small settlement comparators in terms of latitude. Both settlements have approximately half the population of Inverness and are located inland without significant coastal meteorological influence. Consequently, it could be anticipated these settlements would exhibit a stronger UHI signal. This is true in the case of Brandon where the summertime mean UHII of 3.2°C is significantly higher than that observed in Inverness. The long-term, year-round UHII of Fairbanks is noted as 0.3°C. Fairbanks experiences a multitude of confounding meteorological conditions including strong temperature inversions and chinook winds. Notwithstanding this, the low UHII of Fairbanks may be considered as a minimum value from which to validate the results from Inverness.
Settlements with a temperate oceanic (Köppen Cfb) climate, though varying in population size, share similar summertime nocturnal UHII intensities to Inverness (). These include Geisenheim and Stuttgart (Germany), Melbourne (Australia), Seattle and Portland (USA), and Reading (UK). Collective analysis of these studies returns a mean UHII of 2.3°C. It is important to note that while settlements in this climate classification share a similar UHII, variations in local physical geography may influence slight differences in UHII magnitude. For example, these comparator settlements have relatively flatter surrounding landscapes or differing extents of hill/valley topography which can affect air movement and temperature distribution. Coastal situations also differ, particularly in the case of Reading which lacks a direct coastal influence. Inverness is also a considerably smaller settlement in terms of urban centre size and scale. Building height and density is low, potentially leading to less heat storage within the urban area. However, based on this analysis, it could be concluded that the Inverness experiences a slightly below average UHII when compared to other settlements with the same Köppen climate classification.
Implications
Whilst a mean UHII of 1.6°C is low in comparison with values experienced in other settlements, it is a cause for concern. The result is an indication of the impact that urbanisation has had in the city of Inverness and is a direct consequence of national settlement planning policy.
It is expected that the UHII experienced in other seasons may differ from these findings recorded during the summer months. This study provides valuable initial insights into the UHI effect in Inverness, which can serve as a basis for more extensive investigations. Suggestions for this are given for this in the following section.
Limitations and future work
A limited period for observations was available owing to the research taking place as part of an undergraduate dissertation project. It was therefore necessary to maximise the available research time by focussing the research to nocturnal UHI effects during the summer months of June, July & August 2019. Future studies may wish to expand this using a similar method at different times of day, and during different seasons, to yield results which would enable interesting comparisons of UHI behaviour in Inverness. Such further research is necessary to better inform development of a mechanism accounting for the climate impact of development proposals, currently absent from Scotland’s present national planning framework (Scottish Government, Citation2023).
The lack of nearby reputable fixed weather station data in Inverness may be overcome by setting up a network of fixed weather stations to simultaneously measure the UHI effect across a range of LCZs, over a larger area. Alternatively, a ‘citizen science’ project could be explored, either using sensors affixed to private vehicles or public transport, or home weather stations. Both methods would require that a high level of attention be given to sensor calibration, and, in the case of the latter method, cleaning and verification of data.
Concluding remarks
This study has identified the presence of near-surface UHI phenomena in the small, mid-latitude city of Inverness during the summer months. A mean UHII of 1.6°C (with a maximum of 3.5°C) was observed.
Land use and prevailing meteorological conditions have a significant impact on the development of UHI effects in Inverness. More heavily built-up areas with a lack of pervious surfaces returned the highest UHI intensities. Conversely, areas of large urban greenspace were found to partially offset the UHI with a cooling effect. Whilst UHI phenomena was recorded on all dates of the study, the highest UHI intensities were recorded on dates with up to 1–2 oktas of cloud cover, low relative humidity, and high cloud base height. The city of Inverness compares closely with other, larger, settlements at a variety of latitudes sharing the same Köppen climate classification.
It is recommended that further research be undertaken to determine the scale and behaviour of UHI phenomena in Inverness over a wider time period and across differing local climate zones. The results identify a clear need for action to prevent development of UHI effects through the national planning framework and such policy changes should be informed by research.
Acknowledgements
This research originates from a final year BSc (Hons) Geography dissertation project at the University of the Highlands and Islands, supervised by Dr Anne-Marie Nuttall. Thanks are offered to Dr Eddy Graham for his thoughts and detailed explanation of his related (1993) Dublin study. The author would also like to thank Gary Johnston for collation and provision of data from Munlochy PWS. Acknowledgements are extended to Dr Stuart Black and Tim Stott at the Highland Council Planning Service for their support and interest in the project.
Disclosure statement
No potential conflict of interest was reported by the author(s).
References
- Akbari, H., Cartalis, C., Kolokotsa, D., Muscio, A., Pisello, A. L., Rossi, F., Santamouris, M., Synnefa, A., Wong, N. H., & Zinzi, M. (2015). Local climate change and urban heat island mitigation techniques – the state of the art. Journal of Civil Engineering and Management, 22(1), 1–16. https://doi.org/10.3846/13923730.2015.1111934
- Alves, E. D. L., & Lopes, A. (2017). The urban heat island effect and the role of vegetation to address the negative impacts of local climate changes in a small Brazilian city. Atmosphere, 8(2), 1–14. https://doi.org/10.3390/atmos8020018
- Brandsman, T., & Wolters, D. (2012). Measurement and statistical modelling of the urban heat island of the city of Utrecht (The Netherlands). Journal of Applied Meteorology and Climatology, 51(6), 1046–1060. https://doi.org/10.1175/JAMC-D-11-0206.1
- Chandler, T. J. (1962). Temperature and humidity traverses across London. Weather, 17(7), 235–242. https://doi.org/10.1002/j.1477-8696.1962.tb05125.x
- Diesnst, M., Lindén, J., & Esper, J. (2018). Determination of the urban heat island intensity in villages and its connection to land cover in three European climate zones. Climate Research, 76(1), 1–15. https://doi.org/10.3354/cr01522
- Eastin, M. D., Baber, M., Boucher, A., Di Bari, S., Hubler, R., Stimac-Spalding, B., & Winesett, T. (2018). Temporal variability of the Charlotte (sub)urban heat island. Journal of Applied Meteorology and Climatology, 57(1), 81–102. https://doi.org/10.1175/JAMC-D-17-0099.1
- Farrell, W. J., Deville Cavellin, L., Weichenthal, S., Goldberg, M., & Hatzopoulou, M. (2015). Capturing the urban canyon effect on particle number concentrations across a large road network using spatial analysis tools. Building and Environment, 92, 328–334. https://doi.org/10.1016/j.buildenv.2015.05.004
- Gedzelman, S. D., Austin, S., Cermak, R., Stefano, N., Partridge, S., Quesenberry, S., & Robinson, D. A. (2003). Mesoscale aspects of the urban heat island around New York city. Theoretical and Applied Climatology, 75(1), 29–42. https://doi.org/10.1007/s00704-002-0724-2
- Graham, E. (1993). The urban heat island of Dublin city during the summer months. Irish Geography, 26(1), 45–57. https://doi.org/10.1080/00750779309478717
- Grimmond, S. (2007). Urbanization and global environmental change: Local effects of urban warming. The Geographical Journal, 173(1), 83–88. https://doi.org/10.1111/j.1475-4959.2007.232_3.x
- Hamada, S., & Ohta, T. (2010). Seasonal variations in the cooling effect of urban green areas on surrounding urban areas. Urban Forestry & Urban Greening, 9(1), 15–24. https://doi.org/10.1016/j.ufug.2009.10.002
- Hart, M. A., & Sailor, D. J. (2009). Quantifying the influence of land-use and surface characteristics on spatial variability in the urban heat island. Theoretical and Applied Climatology, 95(3-4), 397–406. https://doi.org/10.1007/s00704-008-0017-5
- Hartley, M. (1977). Glasgow as an urban heat island. Scottish Geographical Magazine, 93(2), 80–89. https://doi.org/10.1080/00369227708736365
- Hathaway, E. A., & Sharples, S. (2012). The interaction of rivers and urban form in mitigating the urban heat island effect: A UK case study. Building and Environment, 58, 14–22. https://doi.org/10.1016/j.buildenv.2012.06.013
- Highlands and Islands Enterprise. (2015, June 1). Inverness – the city in the highlands: The natural place to invest. https://iabp.co.uk/wp-content/uploads/2015/06/Inverness-The-City-In-The-Highlands-New.pdf.
- Howard, L. (1833). The climate of London deduced from meteorological observations, made in the metropolis and at various places around it. Harvey & Darton.
- Ivajnšič, D., Kaligarič, M., & Žiberna, I. (2014). Geographically weighted regression of the urban heat island of a small city. Applied Geography, 53, 341–353. https://doi.org/10.1016/j.apgeog.2014.07.001
- Ketterer, C., & Matzarakis, A. (2015). Comparison of different methods for the assessment of the urban heat island in Stuttgart, Germany. International Journal of Biometeorology, 59(9), 1299–1309. https://doi.org/10.1007/s00484-014-0940-3
- Kim, Y.-E., & Baik, J.-J. (2002). Maximum urban heat island intensity in Seoul. Journal of Applied Meteorology and Climatology, 41(6), 651–659. https://doi.org/10.1175/1520-0450(2002)041<0651:MUHIII>2.0.CO;2
- Kolokotsa, D., Psomas, A., & Karapidakis, E. (2009). Urban heat island in Southern Europe: The case study of Hania, Crete. Solar Energy, 83(10), 1871–1883. https://doi.org/10.1016/j.solener.2009.06.018
- Levermore, G. J., Parkinson, J. B., Laycock, P. J., & Lindley, S. (2015). The urban heat island in Manchester 1996-2011. Building Services Engineering Research and Technology, 36(3), 343–356. https://doi.org/10.1177/0143624414549388
- Longley, I. D., Gallagher, M. W., Dorsey, J. R., & Flynn, M. (2004). A case-study of fine particle concentrations and fluxes in a busy street canyon in Manchester, UK. Atmospheric Environment, 38(22), 3595–3603. https://doi.org/10.1016/j.atmosenv.2004.03.040
- Magee, N., Curtis, J., & Wendler, G. (1999). The urban heat island effect at Fairbanks, Alaska. Theoretical and Applied Climatology, 64(1-2), 39–47. https://doi.org/10.1007/s007040050109
- McClatchey, J. (2014). Regional weather and climates of the British isles – part 9: Scotland. Weather, 69(10), 275–281. https://doi.org/10.1002/wea.2290
- Miles, V., Esau, I., & Miles, M. W. (2023). The urban climate of the largest cities of the European Arctic. Urban Climate, 48, 1–12. https://doi.org/10.1016/j.uclim.2023.101423
- Morris, C. J. G., Simmonds, I., & Plummer, N. (2001). Quantification of the influences of wind and cloud on the nocturnal urban heat island of a large city. Journal of Applied Meteorology and Climatology, 40(2), 169–182. https://doi.org/10.1175/1520-0450(2001)040<0169:QOTIOW>2.0.CO;2
- Morton, R. D., Marston, C. G., O’Neil, A. W., & Rowland, C. S. (2020). Land cover map 2019 (20 m classified pixels, GB) [Data set]. NERC Environmental Information Data Centre. https://doi.org/10.5285/643EB5A9-9707-4FBB-AE76-E8E53271D1A0
- Murphy, D. J., Hall, M. H., Hall, C. A. S., Heisler, G. M., Stehman, S. V., & Anselmi-Molina, C. (2011). The relationship between land cover and the urban heat island in northeastern Puerto Rico. International Journal of Climatology, 31(8), 1222–1239. https://doi.org/10.1002/joc.2145
- National Records of Scotland. (2018, March 12). Mid-2016 population estimates for settlements and localities in Scotland. https://www.nrscotland.gov.uk/statistics-and-data/statistics/statistics-by-theme/population/population-estimates/settlements-and-localities/mid-2016-population-estimates-for-settlements-and-localities-in-scotland.
- Nicholson, A. (2020). Analysis of the diurnal cycle of air temperature between rural Berkshire and the University of Reading: Possible role of the urban heat island. Weather, 75(8), 235–241. https://doi.org/10.1002/wea.3807
- Oke, T. R. (1973). City size and the urban heat island. Atmospheric Environment (1967), 7(8), 769–779. https://doi.org/10.1016/0004-6981(73)90140-6
- Oke, T. R. (1982). The energetic basis of the urban heat island. Quarterly Journal of the Royal Meteorological Society, 108, 1–24. https://doi.org/10.1002/qj.49710845502
- Oke, T. R. (1995). The heat island of the urban boundary layer: Characteristics, causes and effects. In J. E. Cermak, A. G. Davenport, E. J. Plate, & D. X. Viegas (Eds.), Wind climate in cities (pp. 81–107). Springer.
- Oke, T. R. (2004). Initial guidance to obtain representative meteorological observations at urban sites (IOM Report No. 81, WMO/TD No. 1250). World Meteorological Organization.
- Oke, T. R., Mills, G., Christen, A., & Voogt, J. A. (2017). Urban climates. Cambridge University Press.
- Perkins-Kirkpatrick, S. E., & Lewis, S. C. (2020). Increasing trends in regional heatwaves. Nature Communications, 11(1), 1–8. https://doi.org/10.1038/s41467-020-16970-7
- Pinho, O. S., & Orgaz, M. D. M. (2000). The urban heat island in a small city in coastal Portugal. International Journal of Biometeorology, 44(4), 198–203. https://doi.org/10.1007/s004840000063
- Ramamurthy, P., & Sangobanwo, M. (2016). Inter-annual variability in urban heat island intensity over 10 major cities in the United States. Sustainable Cities and Society, 26, 65–75. https://doi.org/10.1016/j.scs.2016.05.012
- Scottish Government. (2023). National planning framework 4.
- Siu, L. W., & Hart, M. A. (2013). Quantifying urban heat island intensity in Hong Kong SAR, China. Environmental Monitoring and Assessment, 185(5), 4383–4398. https://doi.org/10.1007/s10661-012-2876-6
- Stewart, I. D., & Oke, T. R. (2012). Local climate zones for urban temperature studies. Bulletin of the American Meteorological Society, 93(12), 1879–1900. https://doi.org/10.1175/BAMS-D-11-00019.1
- Suckling, P. W. (1981). Nocturnal observations of incoming longwave radiation and the urban heat island for a small prairie city. Archives for Meteorology, Geophysics and Bioclimatology Series B, 29(1-2), 23–27. https://doi.org/10.1007/BF02278187
- Szymanowski, M. (2005). Interactions between thermal advection in frontal zones and the urban heat island of Wrocław, Poland. Theoretical and Applied Climatology, 82(3-4), 207–224. https://doi.org/10.1007/s00704-005-0135-2
- Tan, J., Zheng, Y., Tang, X., Guo, C., Li, L., Song, G., Zhen, X., Yuan, D., Kalkstein, A. J., Li, F., & Chen, H. (2010). The urban heat island and its impact on heatwaves and human health in Shanghai. International Journal of Biometeorology, 54(1), 75–84. https://doi.org/10.1007/s00484-009-0256-x
- Taylor, J., Wilkinson, P., Davies, M., Armstrong, B., Chalabi, Z., Mavrogianni, A., Symonds, P., Oikonomou, E., & Bohnenstengel, S. I. (2015). Mapping the effects of urban heat island, housing, and age on excess heat-related mortality in London. Urban Climate, 14, 517–528. https://doi.org/10.1016/j.uclim.2015.08.001
- United Nations. (2015). Transforming our world: The 2030 agenda for sustainable development. (Report No. A/RES/70/1). United Nations.
- United Nations. (2019). World Urbanization Prospects: The 2018 Revision. (Report No. ST/ESA/SER.A/420). United Nations.
- van Hove, L. W. A., Jacobs, C. M. J., Heusinkveld, B. G., Elbers, J. A., van Driel, B. L., & Holtslag, A. A. M. (2015). Temporal and spatial variability of urban heat island and thermal comfort within the Rotterdam agglomeration. Building and Environment, 83, 91–103. https://doi.org/10.1016/j.buildenv.2014.08.029
- Vardoulakis, E., Karamanis, D., Fotiadi, A., & Mihalakakou, G. (2013). The urban heat island effect in a small Mediterranean city of high summer temperatures and cooling energy demands. Solar Energy, 94, 128–144. https://doi.org/10.1016/j.solener.2013.04.016
- Wai, C. Y., Muttil, N., Tariq, M. A. U. R., Paresi, P., Nnachi, R. C., & Ng, A. W. M. (2022). Investigating the relationship between human activity and the urban heat island effect in Melbourne and four other international cities impacted by COVID-19. Sustainability, 14(7), 1–25. https://doi.org/10.1108/SAMPJ-07-2021-0268
- Ward, K., Lauf, S., Kleinschmit, B., & Endlicher, W. (2016). Heat waves and urban heat islands in Europe: A review of relevant drivers. Science of the Total Environment, 569-570, 527–539. https://doi.org/10.1016/j.scitotenv.2016.06.119
- Yokobori, T., & Ohta, S. (2009). Effect of landcover on air temperatures involved in the development of an intra-urban heat island. Climate Research, 39, 61–73. https://doi.org/10.3354/cr00800
- Zipper, S. C., Schatz, J., Singh, A., Kucharik, C. J., Townsend, P. A., & Loheide II, S. P. (2016). Urban heat island impacts on plant phenology: Intra-urban variability and response to land cover. Environmental Research Letters, 11(5), 054023. https://doi.org/10.1088/1748-9326/11/5/054023