
ABSTRACT
In many parks and protected areas around the globe, reducing human-caused sounds is a critical component to providing quality visitor experiences. However, very little research examines the effect of vehicular road sounds on visitor experiences. Additionally, emerging pavement treatments have the potential to provide a new management tool for reducing impacts from vehicular road sounds. In this research, intercept surveys of visitors in Death Valley National Park and dose-response methods are used to identify the impacts of vehicular road sounds using normative concepts. The effects of different pavement treatments on visitor experiences are also evaluated. Results show that increasing vehicular road sounds have a negative impact on visitor experiences. Furthermore, Type II microsurfacing pavement treatments have a larger negative impact on visitor experiences than other pavement treatments. From this, managers of parks and protected areas can better understand the impacts of vehicle road sounds on visitor experiences, and possibly further reduce impacts through the use of pavement treatments.
1. Introduction
Providing quality visitor experiences is one of the core responsibilities of park and protected area managers (Miller et al., Citation2019). Increasingly, research shows that natural sounds are an important component of visitor experiences (Francis et al., Citation2017; Mace et al., Citation2004). When considering the management of natural sounds, park and protected area managers generally focus on reducing human-caused sounds because they often detract from quality visitor experiences (Freimund et al., Citation2011; Miller et al., Citation2014; Pilcher et al., Citation2009). Considering the increasing scarcity of areas free from human-caused sound (Buxton et al., Citation2017), it is imperative that managers have science-informed strategies to address pervasive human-caused sounds in parks and protected areas.
The U.S. federal government as well as the National Park Service (NPS) recognize natural sounds as protected resources (National Parks Air Tour Management Act, Citation2000; National Parks Overflights Act, Citation1987; NPS, Citation2006). Specifically, the NPS Director’s Order 47 outlines soundscape preservation and noise management. This order defines noise as ‘an unwanted or undesired sound, often unpleasant in quality, intensity or repetition.’
Recent studies examining the impacts of human-caused sound on visitor experiences in national parks largely considered vocalizations (e.g. Marin et al., Citation2011; Pilcher et al., Citation2009) and overflight sounds (e.g. Iglesias-Merchan et al., Citation2015; Miller et al., Citation2018; Taff et al., Citation2014, Citation2015; Weinzimmer et al., Citation2014). Although one study examined vehicular sound on attitudes about scenic evaluations in a lab-based setting (e.g. Benfield et al., Citation2018), no research has examined how vehicular road sound impacts the visitor experience in national parks. This is despite high-levels of visitor exposure to vehicular road sound (Miller, Citation2008; Park et al., Citation2010) and its claimed importance in national park soundscape management (Francis et al., Citation2017; Miller, Citation2008; Weinzimmer et al., Citation2014).
Even with a limited understanding of the impacts on visitor experiences in parks and protected areas, some managers initiated efforts to reduce vehicular road sounds. This includes mass transportation and limiting vehicle use (Manning & Anderson, Citation2012). Mass transportation systems are particularly common approach in the NPS with 16% of all units having some form of mass transportation (Davis, Citation2016). However, mass transit systems and restrictions on visitor use are not feasible or desirable in all parks due to considerations like increasing visitor use due to better access (via shuttles) and infringing on visitor values of parks (Lawson et al., Citation2011; Manning, Citation2003; Manning, Citation2011).
A potential new solution for reducing impacts from road sound in parks and protected areas is found in Death Valley National Park (DEVA) where managers are using a variety of pavement treatments (NPS, Citation2019b). These treatments can potentially reduce impacts from road sound by altering friction and vibrations between tires and roads (Praticò & Anfosso-Lédée, Citation2012). Given the unknown impacts of road sound on visitor experience coupled with emerging pavement technologies, the purpose of this study is to evaluate how pavement technologies and vehicular road sounds influence visitor experiences. To address this purpose, a single research question was developed:
R1: How does visitor experience related to road sound conditions change with different pavement treatments?
1.1. Thresholds for understanding visitor experiences in parks and protected areas
Understanding and managing visitor experiences in parks and protected areas is most often done through Management-By-Objectives frameworks (MBO) (Manning, Citation2011; Miller et al., Citation2019). These MBO include Limits of Acceptable Change (Stankey et al., Citation1984), the Visitor Experience and Resource Protection framework (Manning et al., Citation1995), and the more recent Interagency Visitor Use Management Framework (IVUMF, Citation2016).
One of the tenants of visitor use management in parks and protected areas is that accommodating any form or amount of visitor use leads to some resource or visitor use impact (Hammitt et al., Citation2015; Manning, Citation2011). Because of this, the critical question is not if impact will occur, but rather how much impact is acceptable (Miller et al., Citation2019; Wagar, Citation1964). In MBO, the level at which resource conditions become unacceptable is the threshold (IVUMF, Citation2016). Thresholds are a common thread among different MBO that allow scientists and managers to evaluate how changing resource conditions impact visitor experiences (Miller et al., Citation2019). In research on visitor experiences, normative concepts are often used to develop thresholds (Manning, Citation2011; Vaske et al., Citation1986). Developing statistical models from the measurement of normative concepts allows managers and scientists to understand how changing resource conditions impact visitor experience and identify the point where resource conditions are no longer acceptable to visitors (Manning, Citation2011; Miller et al., Citation2019; Pilcher et al., Citation2009).
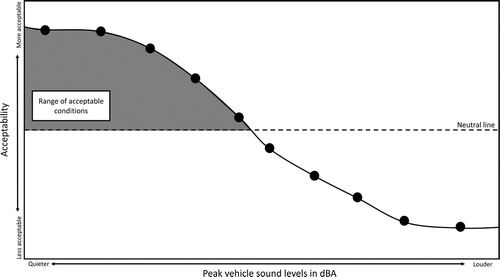
provides a conceptual normative model of thresholds commonly used in MBO. The x-axis is the range of resource conditions, which in this study is the peak level of A-weighted decibels (dBA). The y-axis is the normative evaluation of resource conditions, generally measured as acceptability (Miller & Freimund, Citation2018; Pilcher et al., Citation2009; Vaske et al., Citation1986). A neutral line is plotted horizontally in the middle of the y-axis. As the acceptability of resource conditions change, the point where acceptability crosses over the neutral line is the threshold (IVUMF, Citation2016; Manning, Citation2011; Miller et al., Citation2019). When viewed collectively, any resource condition rated above the neutral line is within the range of acceptable conditions and infers satisfactory visitor experiences (Manning, Citation2011).
Figure 1. Conceptual model of normative thresholds commonly used in MBO.
2. Materials and methods
2.1. Study site
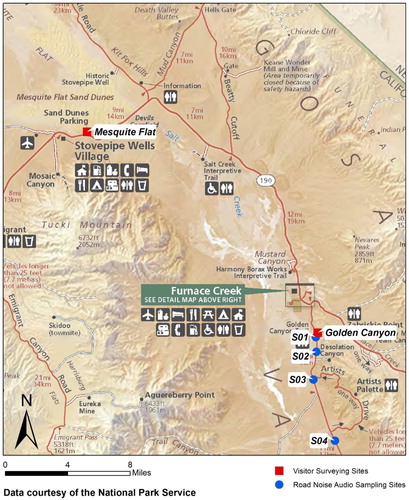
Death Valley National Park (DEVA) is located in southeastern California and southwestern Nevada and comprises the largest federally designated wilderness area in the contiguous 48-states of the U.S. (NPS, Citation2019a). DEVA provides visitors with a variety of experiences, including hiking, backpacking, bicycling, canyoneering, and sightseeing. This study focused on two locations for sampling visitors selected in consultation with DEVA managers: Mesquite Flats (Mesquite Flat Sand Dunes) and Golden Canyon (). These sites were selected because they provide road-proximate access to areas frequented by visitors.
Figure 2. (Colour online) Map of study location showing visitor surveying sites and road noise audio sampling sites.
2.2. Development of soundclips
Audio of vehicular road sound along Badwater Road in DEVA was collected by the Natural Sounds and Night Skies Division of the NPS and the U.S. Department of Transportation’s Volpe National Transportation Systems Center at four locations () and represented four different types of pavement (). Sound pressure levels were measured using microphones placed 50 feet (15.24 m) from the center of the travel lane and 5 feet (1.52 m) above the roadway plane. For more detailed reporting on the road noise sampling methods employed to collect data used in this study, please refer to Rochat and Lau (Citation2013). As with previous research (Abbott et al., Citation2016; Miller et al., Citation2020; Pilcher et al., Citation2009), sound clips were 30 s long and included a fade in and fade out portion. Soundclips were calibrated using dBA to mimic human hearing. In total, 30 soundclips were developed to form a pool that ranged in peak sound pressure levels from 60.9 to 74.4 dBA.
Table 1. Audio collection site descriptions.
2.3. Data instrument
A quantitative survey measured visitor responses to vehicular road sound using dose-response methods (Miller et al., Citation2019; Pilcher et al., Citation2009). Dose–response methods exposed visitors to a range of resource conditions in a way that would not be possible in a typical field-based setting (Miller et al., Citation2019; Pilcher et al., Citation2009). Using these methods, researchers provided a precise amount of ‘dose’ (in this case, various levels of road noise) to respondents for evaluation over a range of resource conditions. These methods are particularly useful for developing thresholds for sounds in visitor use management (Miller et al., Citation2019; Pilcher et al., Citation2009).
From the pool of 30 soundclips (see Section 2.2 above), each respondent was provided with a subset of five soundclips for evaluation. Soundclips were selected using a random starting point and presentation proceeded in a random order. This process allows researchers to obtain visitor responses over a wider-range of resource conditions without an order biasing effect or increasing visitor burden (Gibson et al., Citation2012; Miller et al., Citation2019). Soundclips were administered to visitors using Bose© noise-cancelling headphones and were calibrated to ensure proper sound level. The survey stated,
We will ask you to listen to five brief recordings of sounds. As you listen to each recording, imagine how you would have felt if you had heard the sounds in the recording during your visit to Death Valley’s front country (only). Please listen to each recording in its entirety; the computer will automatically advance to a page with questions after each recording is finished playing.
2.4. Survey administration
University-trained researchers administered the survey to visitors at DEVA using Qualtrics© offline data collection and a tablet from 16 October to 12 November 2018. Surveying at Golden Canyon generally took place from 9 am to 5 pm. Due to its popularity as a location for sunrise and sunset recreational activities, surveying at Mesquite Flat Sand Dunes was equally divided into am and pm sampling days, with sampling windows ranging from 7 am to 3 pm and 11 am to 7 pm respectively. This sampling schedule was adapted slightly on occasion due to changing daylight hours and sporadic dust storms. As visitors exited a trail, they were intercepted by a research technician and asked to participate in a 10-minute survey informing the management of DEVA. If they declined, only observational data was collected (respondent gender and sampling location) for non-response bias purposes due to administrative barriers. If the respondent accepted the survey, the research technician would begin with the administration of the instrument. If a group was intercepted, the member with the next upcoming birthday was asked to participate.
2.5. Data analysis
A mixed linear model using maximum likelihood estimation was used to develop vehicular road sound thresholds (Ferguson, Citation2019; Miller et al., Citation2019). Acceptability was the dependent variable in this model. Fixed effects in the model included sound pressure level and pavement treatment. The respondent was a random effect in this model, thus controlling for any unique variation associated with an individual (Ferguson, Citation2019; Miller et al., Citation2019). Version 25 of IMB©SPSS© was used for data analysis, and ggplot2 was used to graph the results in R (Wickham, Citation2016).
3. Results
Final sampling totaled 1,135 groups. Of those, 15% (n = 168) were unable to participate due to a language barrier. From the remaining 967 groups, 667 individuals (69%) agreed to the participate in the study. There was no difference in the rate of respondents and non-respondents by survey location (χ2 = 1.474, p = 0.479). There was a difference between respondents and non-respondents for gender (χ2 = 23.798, p = 0.000) with men being more likely to refuse. However, this effect was minimal (phi = .176) and likely does not represent a meaningful issue towards the quality of our data (Vaske, Citation2008).
3.1. Sample characteristics
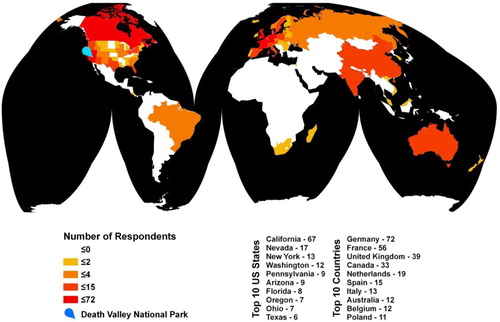
Of the n = 667 respondents surveyed, 48% were female. The average age of respondents was 43 years old, with a range from 18 to 83 years old. Visitors tended to be from large urban centers, with 57% of the sample reporting residence in medium cities (50,000–1 million people) or major metropolitan areas (over 1 million people). Foreign visitors made up the majority of the sample, with 57% of visitors being residents of countries other than the United States (). Respondents were surveyed from six continents: Europe (29 countries, n = 298), North America including the USA (2 countries, n = 250), Asia (8 countries, n = 25), Oceania (3 countries, n = 15), Latin and South America (2 countries, n = 4), and Africa (2 countries, n = 3). Respondents from 39 U.S. states were surveyed ().
Figure 3. (Colour online) Map showing the geographical distribution of respondents.
3.2. Mixed linear model for evaluating the influence of sound pressure level from different pavement types on visitor experience and developing thresholds
shows statistical testing for the fixed effects in the model. Overall, sound pressure level and treatment type were significant predictors of acceptability ratings. Additionally, the interaction between sound pressure level and treatment type was also significant. The significance of the interaction term means that at least one of the slopes, and therefore thresholds, for the pavement treatments were significantly different from at least one other slope.
Table 2. Statistical testing of fixed effects in acceptability model.
shows the results for the estimated fixed effects in the model. Overall, sound pressure level shows a significant, negative relationship with acceptability ratings. This means that as the sound pressure level increases, acceptability decreases regardless of pavement type. Several effects for pavement type indicate whether the acceptability for pavement type differs from the base pavement type (1/4″ chipseal is the base) in the model. Only the interaction for Type II microsurfacing was significant, meaning that the slope for Type II microsurfacing was significantly different from 1/4″ chipseal. Further interpreted, Type II microsurfacing was rated lower in acceptability when compared to 1/4″ chipseal.
Table 3. Estimates of fixed effects in acceptability thresholds model.
The results from the estimated fixed effects () are more clearly interpreted using regression equations and predicted thresholds. Overall, the regression equations show that visitor thresholds are significantly lower for Type II microsurfacing treatments. None of the other treatments were significantly different. Using the regression equations to predict the minimum acceptability threshold (acceptability = 4.99), Type II microsurfacing has a minimum threshold of 33.296 dBA, where the other pavement types range from 46.731 to 53.814 dBA. The predicted values from the mixed linear model are further graphed below in .
Figure 4. (Colour online) Predicted thresholds of vehicular road sound vary by pavement type.
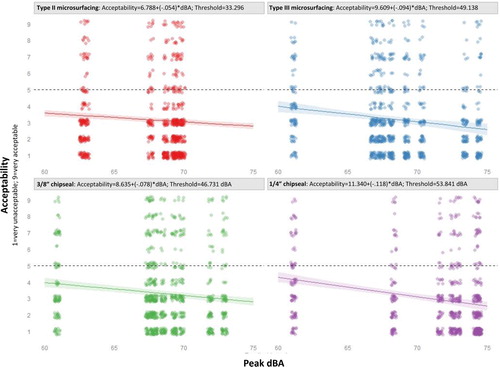
Table 4. Regression equations by pavement type for sound acceptability.
4. Discussion
The purpose of this research was to explore the role of pavement type and vehicular road sound on the visitor experience in a protected area. Using threshold concepts, the results show that acceptability of vehicular road sound was predicted by both peak sound pressure levels and pavement treatment types. Additionally, the interaction effect between sound pressure level and pavement treatments demonstrates differential effects on visitor experience. In the face of increasing anthropogenic sounds in even the most remote areas (Buxton et al., Citation2017; Rice et al., Citation2020), this research provides several insights related to the management of natural sounds and visitor experiences in parks and protected areas.
Although long assumed (Miller, Citation2008), this study empirically shows for the first time that road sound negatively influences visitor experience in a U.S. national park setting. This finding largely aligns with a suite of previous research that demonstrate the deleterious impacts of anthropogenic sounds on visitor experiences in parks and protected areas (Francis et al., Citation2017; Freimund et al., Citation2011; Mace et al., Citation2004; Manning et al., Citation2018; Miller, Citation2008; Miller et al., Citation2018; Pilcher et al., Citation2009). Regardless of pavement treatment, any road sound above 53.8 dBA is considered unacceptable to DEVA visitors. However, it must be acknowledged that road sound conditions below 53.8 dBA are still having a negative impact on at least some visitors in DEVA.
Perhaps most interesting, the significant interaction effect indicates that visitors have different thresholds for road sound levels when considering pavement treatment, but the only significant difference was for Type II microsurfacing. Further interpreted, this means that even at the same sound pressure level, Type II microsurfacing treatments result in lower levels of vehicle road sound thresholds. This is an important finding because other research partners on this project found Type II microsurfacing to be, on average, the quietest pavement (Hastings et al., Citation2020).
Most research studying visitor experiences related to sounds in parks and protected areas focuses exclusively on sound pressure levels as a predictor of acceptability and thus thresholds (Miller et al., Citation2019; Pilcher et al., Citation2009). This current study suggests that not only does sound pressure level influence the visitor experience, but sound qualities like roughness also play a role (Miller et al., Citation2019).
Managers can use this information when planning for visitor use in parks and protected areas. For instance, it is now clear that vehicle road sounds have a negative impact on visitor experiences. In certain cases, managers may want to focus on vehicle road sounds as an indicator of visitor experiences instead of or in addition to more frequently used indicators, like pedestrian-caused sound (e.g. Marin et al., Citation2011; Pilcher et al., Citation2009) and aircraft sound (e.g. Iglesias-Merchan et al., Citation2015; Miller et al., Citation2018; Taff et al., Citation2014, Citation2015; Weinzimmer et al., Citation2014). Additionally, managers may want to avoid Type II microsurfacing pavement treatments in areas where impacts to visitor experience are a consideration. Although 3/8″ chipseal pavement treatment was not significantly different (p < .05) from the 1/4″ chipseal, the relatively close p-value (p = .057) and lower calculated threshold (46.73 dBA) may warrant consideration of restricting this pavement treatment over 1/4″ chipseal or Type III microsurfacing when trying to reduce impacts on visitor experiences.
4.1. Limitations and future research
The results of this research should be interpreted with several limitations. Sound clips were developed from a restricted range (60.9 to 74.4 dBA) of recordings. Although these conditions are reflective of actual roadside noise in DEVA, expanding the sound clip pool to reach the lower and higher ends of conditions (e.g. <60.9 dBA or >74.4 dBA) may further our understanding of vehicle road sound thresholds. Due to the transient nature of sounds from passing vehicles, we used peak sound pressure level as our fixed effect instead of average sound pressure level of the sound clip. Other aspects of sound clips, such as tire or vehicle type, were not evaluated in this research. Further inquiry into these aspects may provide additional insights. Lastly, sampling was confined to two sites during the peak season of visitor use in DEVA. Expanding sampling efforts to include other times and locations may enrich these findings.
Future research is needed to further develop and apply these findings. Several limitations noted above could be part of this, including an expanded pool of sound clips and the role of tire and vehicle type on thresholds. Additionally, alternatives like shuttles (Manning & Anderson, Citation2012), reduced speed limits (Newton et al., Citation2018), and sound barriers (e.g. walls and vegetation) can also reduce impacts of vehicle road sound on visitor experiences. Managers need science-informed ways to make decisions about these alternatives, and future research revealing the trade-offs visitors are willing to make to achieve quieter conditions in parks and protected areas is needed. Spatial modeling of vehicle road sound could be coupled with visitor experience data to provide a regional display of social conditions in the area, thus allowing managers to see which locations have the highest levels of negative impacts on visitors. Lastly, other aspects should be evaluated in relation to vehicle road noise, such as the effect of road noise on visitor attention or mental health and well-being (Abbott et al., Citation2016; Francis et al., Citation2017).
5. Conclusions
This study shows that increasing vehicle road sounds have a negative impact on the visitor experience in DEVA, and that pavement treatments can affect the evaluation of vehicle road sounds – even at the same sound pressure level. Using mixed-linear models, Type II microsurfacing treatments had a significantly larger negative effect on the visitor experience than other pavement types. The model shows that any sound pressure level, regardless of pavement type, above 53.81 dBA becomes unacceptable to users. These findings can help managers of parks and protected areas make informed decisions about managing soundscapes for visitor experiences.
Disclosure statement
No potential conflict of interest was reported by the authors.
Additional information
Funding
References
- Abbott, L. C., Taff, B. D., Newman, P., Benfield, J. A., & Mowen, A. J. (2016). The influence of natural sounds on attention restoration. Journal of Park and Recreation Administration, 34(3), 5–15. https://doi.org/10.18666/JPRA-2016-V34-I3-6893
- Benfield, J., Taff, B. D., Weinzimmer, D., & Newman, P. (2018). Motorized recreation sounds influence nature scene evaluations: The role of attitude moderators. Frontiers in Psychology, 9, 495. https://doi.org/10.3389/fpsyg.2018.00495
- Buxton, R. T., McKenna, M. F., Mennitt, D., Fristrup, K., Crooks, K., Angeloni, L., & Wittemyer, G. (2017). Noise pollution is pervasive in U.S. protected areas. Science, 356, 531–533. https://doi.org/10.1126/science.aah4783
- Davis, T. (2016). National Park roads. University of Virginia Press.
- Ferguson, L. A. (2019). Strategies for managing natural sounds for human experience and ecosystem services [Doctoral dissertation]. The Pennsylvania State University. https://etda.libraries.psu.edu/files/final_submissions/17621
- Francis, C. D., Newman, P., Taff, B. D., White, C., Monz, C. A., Levenhagen, M., Petrelli, A. R., Abbott, L. C., Newton, J., Burson, S., Cooper, C. B., Fristrup, K. M., McClure, C. J. W., Mennitt, D., Giamellaro, M., & Barber, J. R. (2017). Acoustic environments matter: Synergistic benefits to humans and ecological communities. Journal of Environmental Management, 203, 245–254. https://doi.org/10.1016/j.jenvman.2017.07.041
- Freimund, W., Sacklin, J., Patterson, M., Bosak, K., & Saxen, S. W. (2011). Soundscapes and the winter visitor experience. Yellowstone Science, 19(2), 6–13.
- Gibson, A. W., Newman, P., Lawson, S., Fristrup, K., Benfield, J. A., Bell, P. A., & Nurse, G. A. (2012). Photograph presentation order and range effects in visual based outdoor recreation research. Leisure Sciences: An Interdisciplinary Journal, 36(2), 183–205. https://doi.org/10.1080/01490400.2013.862886
- Hammitt, W. E., Cole, D. N., & Monz, C. A. (2015). Wildland recreation: Ecology and management. John Wiley & Sons.
- Hastings, A., Rapoza, A., Chupp, W., Kaye, S., & Flynn, D. (2020). Quieter pavement project – Death Valley National Park: Interim report for post-treatment conditions, 1-month age [Natural Resource Report NPS/DEVA/NRR—2020/2079]. National Park Service.
- Iglesias-Merchan, C., Diaz-Balteiro, L., & Soliño, M. (2015). Transportation planning and quiet natural areas preservation: Aircraft overflights noise assessment in a national park. Transportation Research Part D: Transport and Environment, 41, 1–12. https://doi.org/10.1016/j.trd.2015.09.006
- Interagency Visitor Use Management Framework (IVUMF). (2016). The interagency visitor use management council. https://visitorusemanagement.nps.gov
- Lawson, S., Chamberlin, R., Choi, J., Swanson, B., Kiser, B., Newman, P., Monz, C., Pettebone, D., & Gamble, L. (2011). Modeling the effects of shuttle service on transportation system performance Rocky Mountain National Park. Transportation Research Record: Journal of the Transportation Research Board, 2244, 97–106. https://doi.org/10.3141/2244-13
- Mace, B. L., Bell, P. A., & Loomis, R. J. (2004). Visibility and natural quiet in National Parks and wilderness areas: Psychological considerations. Environment and Behavior, 36(1), 5–31. https://doi.org/10.1177/0013916503254747
- Manning, R. (2003). Emerging principles for using information / education in wilderness management. International Journal of Wilderness, 9(1), 20–27.
- Manning, R. E. (2011). Studies in outdoor recreation: Search and research for satisfaction (3rd ed.). Oregon State University Press.
- Manning, R. E., & Anderson, L. E. (2012). Managing outdoor recreation: Case studies in the National Parks. CABI.
- Manning, R. E., Lime, D. W., Hof, M., & Freimund, W. A. (1995, January). The visitor experience and resource protection (VERP) process: The application of carrying capacity to Arches National Park. The George Wright Forum, 12(3), 41–55.
- Manning, R. E., Newman, P., Barber, J., Hallo, J., Monz, C., & Lawson, S. L. (2018). Natural quiet and natural darkness: The new resources of the national parks. University Press of New England.
- Marin, L. D., Newman, P., Manning, R., Vaske, J. J., & Stack, D. (2011). Motivation and acceptability norms of human-caused sound in Muir Woods National Monument. Leisure Sciences, 33(2), 147–161. https://doi.org/10.1080/01490400.2011.550224
- Miller, N. P. (2008). US National Parks and management of park soundscapes: A review. Applied Acoustics, 69(2), 77–92. https://doi.org/10.1016/j.apacoust.2007.04.008
- Miller, Z. D., Ferguson, L. A., Newman, P., Ferguson, M., Tipton, N., Sparrow, V., & Taff, B. D. (2020). Developing visitor thresholds of sound from shale natural gas compressors for motorized and non-motorized recreation users in Pennsylvania State Forests. Applied Acoustics, 157, 107012. https://doi.org/10.1016/j.apacoust.2019.107012
- Miller, Z. D., & Freimund, W. (2018). Using visual-based social norm methods to understand distance-related human – wildlife interactions. Human Dimensions of Wildlife, 23(2), 176–186. https://doi.org/10.1080/10871209.2017.1397825
- Miller, Z. D., Hallo, J. C., Sharp, J. L., Powell, R. B., & Lanham, J. D. (2014). Birding by ear: A study of recreational specialization and soundscape preference. Human Dimensions of Wildlife, 19(6), 498–511. https://doi.org/10.1080/10871209.2014.921845
- Miller, Z. D., Rice, W. L., Taff, B., & Newman, P. (2019). Concepts for understanding the visitor experience in sustainable tourism. In A research Agenda for sustainable tourism. Edward Elgar Publishing. https://doi.org/10.4337/9781788117104.00012
- Miller, Z. D., Taff, B. D., & Newman, P. (2018). Visitor experiences of wilderness soundscapes in Denali National Park and Preserve. International Journal of Wilderness, 24(2), 32–43.
- National Parks Air Tour Management Act. (2000). https://www.faa.gov/about/office_org/headquarters_offices/arc/programs/air_tour_management_plan/documents/npatm_act2000.pdf
- National Parks Overflights Act. (1987). https://www.nps.gov/grca/learn/nature/upload/PL100-91.pdf
- Newton, J. N., Newman, P., Taff, B. D., Shr, Y. H., Monz, C., & D’Antonio, A. (2018). If i can find a parking spot: A stated choice approach to Grand Teton National Park visitors’ transportation preferences. Journal of Outdoor Recreation and Tourism, https://doi.org/10.1016/j.jort.2018.04.001
- NPS. (2006). Management policies. https://www.nps.gov/policy/MP_2006.pdf
- NPS. (2019a). Death Valley: Wilderness. https://www.nps.gov/deva/learn/nature/wilderness.htm
- NPS. (2019b). Death Valley: Road maintenance includes acoustic research. https://www.nps.gov/deva/learn/news/road-maintenance-includes-acoustic-research.htm
- Park, L., Lawson, S., Kaliski, K., Newman, P., & Gibson, A. (2010). Modeling and mapping hikers’ exposure to transportation noise in Rocky Mountain National Park. Park Science, 26(3), 1–11.
- Pilcher, E. J., Newman, P., & Manning, R. E. (2009). Understanding and managing experiential aspects of soundscapes at Muir Woods National Monument. Environmental Management, 43, 425–435. https://doi.org/10.1007/s00267-008-9224-1
- Praticò, F. G., & Anfosso-Lédée, F. (2012). Trends and issues in mitigating traffic noise through quiet pavements. Procedia- Social and Behavioral Sciences, 53, 203–212. https://doi.org/10.1016/j.sbspro.2012.09.873
- Rice, W. L., Newman, P., Miller, Z. D., & Taff, B. D. (2020). Protected areas and noise abatement: A spatial approach. Landscape and Urban Planning, 194, 103701. https://doi.org/10.1016/j.landurbplan.2019.103701
- Rochat, J. L., & Lau, M. (2013). Demonstration of using quieter pavement in Death Valley National Park (Natural Resource Technical Report NPS/NSNS/NRTR—2013/759). National Park Service.
- Stankey, G. H., McCool, S. F., & Stokes, G. L. (1984). Limits of acceptable change: A new framework for managing the Bob Marshall wilderness complex. Western Wildlands, 10(3), 33–37.
- Taff, D., Newman, P., Lawson, S. R., Bright, A., Marin, L., Gibson, A., & Archie, T. (2014). The role of messaging on acceptability of military aircraft sounds in Sequoia National Park. Applied Acoustics, 84, 122–128. https://doi.org/10.1016/j.apacoust.2013.09.012
- Taff, B. D., Weinzimmer, D., & Newman, P. (2015). Mountaineers’ wilderness experience in Denali National Park and Preserve. International Journal of Wilderness, 21(2), 7–15.
- Vaske, J. (2008). Survey research and analysis: Applications in parks, recreation, and human dimensions. Venture Publishing.
- Vaske, J. J., Shelby, B., Graefe, A. R., & Heberlein, T. A. (1986). Backcountry encounter norms: Theory, method, and empirical evidence. Journal of Leisure Research, 18(3), 113–138.
- Wagar, J. A. (1964). The carrying capacity of wild lands for recreation. Forest Science, 10(Suppl_2), a0001–24.
- Weinzimmer, D., Newman, P., Taff, D., Benfield, J., Lynch, E., & Bell, P. (2014). Human responses to simulated motorized noise in national parks. Leisure Sciences, 36(3), 251–267. https://doi.org/10.1080/01490400.2014.888022
- Wickham, D. (2016). Ggplot2: Elegant graphics for data analysis. Springer-Verlag.