Abstract
Visual research has historically been productive in foregrounding marginalised voices through photovoice as alternative to the written and oral forms of participation that dominate public participation. Photovoice projects have however been slow to leverage digital and spatial technologies for reworking the method in ways that enable geospatial analysis and collect structured metadata that can be used in workshops to bring different groups together around unpacking urban problems. The Urban Belonging project contributes to this by testing a new application, UB App, in an empirical study of how participants from seven marginalised communities in Copenhagen experience the city, including ethnic minorities, deaf, homeless, physically disabled, mentally vulnerable, LGBTQ+, and expats in Denmark. From a dataset of 1459 geolocated photos, co-interpreted by participants, the project first unpacks community-specific patterns in how the city creates experiences of belonging for different groups. Second, it examines how participants experience places differently, producing multilayered representations of conflicting viewpoints on belonging. The project hereby brings GIS and digital methods capabilities into photovoice and opens new epistemological flexibilities in the method, making it possible to move between; qualitative and quantitative analysis; bottom-up and top-down lenses on data; and demographic and post-demographic ways or organising participation.
Introduction
In the context of how cities are designed and governed, the arrangement of public participation has become foundational to urban planning in most democratic societies (Healey Citation2020). From notions of procedural justice and equal ‘rights to the city’ (Harvey Citation2008), contemporary planning demands that citizens have a voice in decisions about urban futures and that the public is invited to contribute local knowledge that can inform planning and policy making (Friedmann Citation1998). But what is an urban public? This depends on how the public is assembled and what participation is made possible.
An idealised notion of ‘the public’ in the political discourse typically construes the public as a stable entity that exists ‘out there’, having a priori status, and which can be sampled and consulted in rational discussions about pressing issues. The STS literature, however, troubles such a notion of ‘the public’ in two important ways that we build upon. First, Marres (Citation2005) offers a notion of ‘issue publics’ that builds on a Deweyan pragmatism (Dewey and Rogers Citation2012) and challenges the idea that a single public exists prior to the issues it forms opinions about. To the contrary, publics in the plural emerge ad-hoc around the issues that matter to them. For instance, there can exist one public around the problem of affordable housing and another public around the issue of urban nature. The consequence is that many publics can exist at the same time and people can occupy different positions within them. This also means that the composition of – and fault lines between – different publics is constantly developing. More importantly, on this account, the nation state or the administrative city is not necessarily the relevant container from which to sample the public and gauge its concerns. Second, STS scholars have emphasised the role of materiality in constructing the ‘democratic situations’ (Birkbak and Papazu Citation2022) that make up our society. The act of making a public tangible to decision makers is such a situation. No matter how this is done it involves material technologies for inscribing the public. What counts as the public thus becomes a consequence of the design of the socio-technical infrastructures through which it is manifested (Osborne and Rose Citation1999). Publics are in other words the result of situated data practices that can be unpacked, criticised, and redesigned (Ruppert and Scheel Citation2021). This is what this article contributes to. It documents the Urban Belonging project as a methodological experiment that uses a newly developed application, the UB App (Madsen et al. Citation2023), to ‘re-tool’ photovoice method in ways that enable a form of public participation that is inclusive to marginalised groups.
This is important because research has shown that public engagement in its conventional formats has a problem attracting a diverse group of participants and often foregrounds those that occupy the top of the social hierarchy (Lowndes, Pratchett, and Stoker Citation2001; Witkowski, Reyes, and Padilla Citation2021). Among identified reasons are inadequate and inconvenient methods like public hearings and written statements (Kahila-Tani, Kytta, and Geertman Citation2019), and what Boomgaard and Brom (Citation2017, 10) observes as a tendency to judge publics by a purely quantitative logic. As put by Kahila-Tani et al: ‘Although many techniques exist to arrange the participation of large groups of citizens, (…) the kind of pluralistic thinking that introduces a diversity of interests to support the creation of more innovative planning proposals remains rare’ (Citation2019, 46). Popular engagement methods like sample surveys and citizen assemblies (Flanigan et al. Citation2021) moreover sample citizens to be representative of the population (corresponding to a notion of an a priori ‘public’). The consequence is that minorities are likely to be represented by just one or two people, if at all, which can further tokenise and marginalise them. To many, this makes citizen engagement feel broken and non-inclusive. Irvin and Stansbury (Citation2004) further points out that although public participation has become a common practice in most urban and regional planning, conventional processes typically lead to ‘cherry picking’ and sparse influence on decision making and planning outcomes, which are for the most part already decided. Engagement methods in other words need rethinking to empower a diversity of people to participate in framing urban issues. Adding to this ‘engagement deficit’ in data-driven urbanism (Halegoua Citation2020), most cities continue to emphasise mainly written and oral forms of participation, as exemplified in the Action Catalog by the European Commission (http://actioncatalogue.eu/). With continued innovation in visual technologies, however, we are offered opportunity to imagine engagement methods that better include marginalised groups. Visual techniques like photography offer people an alternative way to show how they experience the city, foregrounding local, situated knowledges (Haraway Citation1988). As emphasised by Gillian Rose: ‘Visual images can be a powerful tool in this process’ (Citation2016, 135). Especially since advances in mobile technology make geolocated photo data increasingly accessible. Yet, visual methods continue to be underexplored within public participation. This is what the Urban Belonging project sets out to change: The project reconfigures the methodological toolbox of citizen engagement in urban planning, innovating a geolocated and digital version of photovoice method, documented here with an empirical case study of how seven marginalised communities in Copenhagen experience belonging.
Reviewing and Reimagining Photovoice Method
Photovoice was introduced as a framework during the nineties by Wang and Burris (Citation1997) as a participatory method where participants are given cameras and asked to take photos that represent their experiences or perspectives on a particular issue. It is often used as a participatory action research (PAR) method (Rose Citation2016) in community-based research to give voice to marginalised groups: More than photo capture, photovoice is typically followed by a process where participants select photos and use them to elicit groups discussions that aim to inform planning, policy, or collective actions that address the problems documented in photos (Gubrium & Harper Citation2016; Wang and Burris Citation1997). Photovoice thus sits somewhere in between ‘photo documentation’ and ‘photo elicitation’ (Harper Citation2002). But in contrast to photo elicitation, where photos can also be researcher-generated or sourced from archives, photovoice sources photos directly from participants who are empowered to frame an issue from their perspective (Budig et al. Citation2018). Citizens are hereby positioned as co-researchers in a participatory ethos mirrored in the credo ‘nothing for us without us’ (Wang, Burris, and Ping Citation1996). In the context of urban studies, photovoice has especially been used to engage disadvantaged groups who are otherwise overlooked, excluded, or invisible in the governing and planning of cities. Some projects for instance study how low-income, racialised, and disinvested communities navigate the local food environment (Soma, Li, and Shulman Citation2022; Valera et al. Citation2009), while others have explored how minorities like homeless people or Black women perceive safety in the urban environment (Davis et al. Citation2020; Gaboardi et al. Citation2018). Specifically regarding questions of belonging, as is the topic of this article, photovoice has been used to engage underrepresented groups in documenting experiences of what makes people feel at home in a place (see, e.g. Bennett (Citation2014), Duran (Citation2019), Magee (Citation2007), and Miled (Citation2020)). Relating back to the introduction, photovoice in these instances productively reconfigure who has a voice in public participation, challenging the ‘statistically representative’ approach by giving voice to marginalised communities. They also rework engagement methods that depend on oral and textual means by enabling a visual form of participation that is accessible to more people and foregrounds experience-based local knowledges.
Most urban projects are, however, characterised by methodological tendencies that we argue limit the potentials of photovoice for redesigning public participation in a more inclusive direction: First, most photovoice projects collect a small number of photos and have a sample size between 10 and 15 participants (Budig et al. Citation2018; Duran Citation2019; Holtby et al. Citation2015; Macdonald et al. Citation2022; Magee Citation2007; Meenar and Mandarano Citation2021; Plane and Klodawsky Citation2013), limiting the scope of results. Second, these projects tend to focus on one marginalised group, exemplified in studies of LGBTQ+ youth (Holtby et al. Citation2015), homeless people (Plane and Klodawsky Citation2013), indigenous youth (Goodman et al. Citation2019), or physically disabled people (Macdonald et al. Citation2022). Rarely do studies involve multiple groups at a time, thus missing out on opportunity for putting communities in conversation with each other, which potentially leads to further isolation and ‘othering’ of minorities. This correlates with a third trend in existing photovoice research, which has not yet adopted an intersectional lens on participants, who are construed primarily as the minority group they are invited to represent, rather than as full human beings with multiple aspects of identity. This potentially extends a tokenised view on marginalised groups, instead of producing nuanced stories about people’s experiences and empowering participants to voice when and how different parts of an identity shape their experiences. Finally, a characteristic of photovoice projects is that they typically ask participants to document a pre-defined area: Plane and Klodawsky (Citation2013) for instance investigate a local park, while Holtby et al. (Citation2015) studied a small urban centre in Ontario. Similar to conventional engagement methods, photovoice projects thereby impose a top-down, expert-led spatial ‘framing’ of an issue by pre-determining what environments it is relevant for participants to do photovoice in, rather than letting participants show what places matter to them.
Taking stock of these shortcomings it is also noticeable that photovoice projects typically self-position as qualitative research with little to no involvement of digital methods or GIS science. Adding to that, scholars like Foster, Davis, and Foell (Citation2023) have emphasised that the method has evolved little over the past two decades. This, in our opinion, represents an underexplored opportunity for reconfiguring photovoice as a public participation method, since mobile and geo-computational technologies offer a chance to reimagine photovoice in ways that connect photovoice to GIS and ‘quali-quantitative’ analytics (Venturini and Latour Citation2010). That this is not yet fully explored becomes clear, when we examine how photovoice research has leveraged the digital so far.
Innovation of Photovoice with Digital Technology
Within photovoice research, the uptake of digital and mobile technologies has in recent years allowed for new applications of the method. Smartphone cameras have for instance made it easier and more affordable to do photovoice, replacing digital, analogue, and single-use cameras, as seen in for instance Volpe (Citation2019). This has made the method more accessible to a wider range of communities, and has allowed for a more immediate and interactive process, compared to when analogue cameras were used. In addition, online photo-sharing platforms such as Instagram or Flickr are being used to more easily collect and share photos, as seen in projects like Cai and Marks (Citation2021), Foster, Davis, and Foell (Citation2022), and Greene, Burke, and McKenna (Citation2018) which connect photovoice to online storytelling. A set of challenges, however, arise when photovoice studies depend on re-using smartphone apps and social media platforms that are proprietarily owned and developed for purposes other than research. First, photovoice needs to be attentive to issues of privacy and the ‘blurry lines between research, informed consent, ethics, data protection, data ownership’ (Aboulkacem, Aboulkacem, and Haas Citation2021, 877). While there are exceptions, such as Petteway (Citation2019), many projects commit themselves to the conditions of commercial sites and platforms and ask participants to send photos to them via email, WhatsApp, Instagram, and the like (see, e.g. Plowman and Stevenson Citation2012). This means the researcher cannot guarantee protection of privacy or deletion of data if participants ask for that, since data live in environments outside the researcher’s control. Informed by ‘Data Feminism’ (D’Ignazio and Klein Citation2020) and an ‘ethics of care’ (Bellacasa Citation2017), we argue that it is necessary to ensure participants’ privacy and rights to delete data. A second challenge is that most projects do not collect structured annotations and little to no metadata (Budig et al. Citation2018; Duran Citation2019; Holtby et al. Citation2015; Macdonald et al. Citation2022; Magee Citation2007; Meenar and Mandarano Citation2021; Plane and Klodawsky Citation2013). Whether using smartphones, digital, or disposable cameras, most projects ask participants to annotate images sometime after photovoice, involving potential problems with recall and poor contextualisation and structuring of data.
Although increasingly looking to the digital as a source of innovation, photovoice scholars have thus been slow to rework the method beyond making photo capture easier or enabling wider photo sharing on social platforms. Garcia et al. similarly argue that in contrast to quantitative research, use of smartphones for qualitative research is ‘yet to be fully explored’ (Citation2016, 6). To the best of our knowledge, there are only a few projects that design digital photovoice tools. This includes García, Welford, and Smith (Citation2016) who tailored an existing mobile app, and Cila et al. (Citation2016) who prototyped a web-app for data collection. Though neither offer well-documented open-sourced apps, they show that design of smartphone apps for photovoice research holds potential for ‘retooling’ the method in ways that for instance geo-tracks locations of photos or builds annotation of images directly into the data collection process. In the Urban Belonging project, we took inspiration from this and designed a photovoice application, the UB App, available for Android and iPhone, which is open-source on GitHub (Kettles Citation2022).
Re-Tooling Photovoice: The UB App
Development of the UB App is documented in Madsen et al. (Citation2023), which describes how local communities, planners, and other stakeholders helped shape the app in a collaborative design process. Some functionalities are worth mentioning here, though, since they shape our results. The UB App:
Enables data collection with no limit to number of participants or photos.
Standardises photo collection across phones as a square format.
Collects timestamp and geolocation for photos and routes – with in-app consent.
Asks participants to annotate their images directly in the app when taking photos.
Invites participants to react to others’ photos, while keeping anonymity.
Gives option to see and delete data in the app, and stores data on secure servers.
With these and more features (see Madsen et al. Citation2023), the app protects privacy and anonymity, and produces photos that are enriched with three layers of information: (1) geolocation and timestamp metadata, (2) annotations by author of the image, and (3) reactions by other participants. This encourages an analytical process where structured geolocation, annotation, and reaction data can be used as input to exercises in workshops, to filter and analyse photovoice data, and to group participants in different constellations around different topics. This, as we shall demonstrate, opens various opportunities for studying cities with photovoice and subverts tendencies in conventional engagement discussed in the introduction.
Materials and Methods
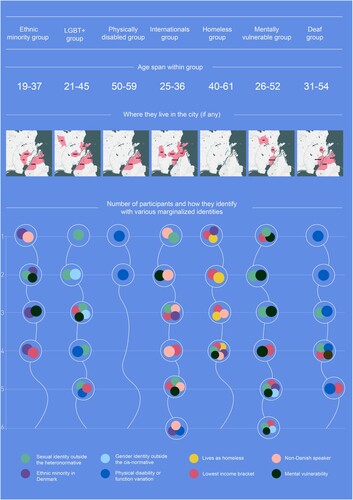
The Urban Belonging (UB) project was initiated in 2021 by a collective of researchers and planners with the goal of contributing new insights about underrepresented communities in Copenhagen. To engage a diversity of perspectives, the project invited participants who self-identify as ethnic minorities, deaf, homeless, physically disabled, mentally vulnerable, international expats in Denmark, and/or LGBT+. Building on principles of ‘Design Justice’ (Costanza-Chock Citation2020), we designed a process that involved communities from beginning to end as illustrated in . First, we partnered with local organisationsFootnote1 that represent each group’s interests, and let their insights about each group inform the design of our process through interviews. Collaborating with organisations, we engaged two to six participants from each community. The requirement for signing up was only that participants self-identify with one or more of the invited communities and live in Copenhagen, but to cultivate sensitivity to inter-group differences we encouraged community organisations to sample with variation among their members. In total, 32 individuals participated in the project (presented in ).
Figure 1. Process and how different actors were involved at different moments.
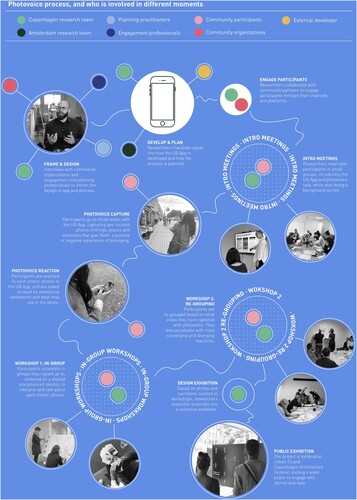
Figure 2. Overview of participants in each group.
After onboarding participants, we held introductory meetings with each community group. To mitigate digital divides, we handed out smartphones to participants without, and introduced the app to participants in small groups so we could help each person install and log into the app, and do tests with it in the room. In this setting, participants also filled out a questionnaire about how they self-identify. Following this, participants had ten days to go on three walks whenever they wanted, and take at least ten photos on each walk of ‘things, places or situations that negatively or positively affect your sense of belonging’. We did not define where people should go, but invited them to go on walks in different areas and asked them to avoid places that are risky, dangerous, or triggering for them (Pichon, Teti, and Brown Citation2022). On these walks, photos and routes were geo-tracked in the app, and participants were asked to tag photos in the app with a five-scale sentiment from negative to positive, and with one or multiple annotation categories such as ‘architecture’, ‘object’, ‘nature’, and others to indicate the content of photos (or use an ‘Other' option to write their own annotation tag). After photovoice collection, a reaction task opened in the app, showing people other participants’ photos and asking them to react to them with a sentiment from negative to positive.
Over three months, participants went on 100+ walks in the city and took 1459 photos. To protect privacy of people captured in photos, we used machine learning model ‘deface’ to blur faces in images. All participants are given pseudonyms in this article, and remained anonymous to each other in the app, giving them the choice to decide in workshops what they wished to share with others. This was informed by discussions on ‘paradox of exposure’ (D’Ignazio and Klein Citation2020) and ‘data ableism’ (Charitsis and Lehtiniemi Citation2023), recognising that visibility is not always desirable and should be in participant’s control. Following this, we facilitated two workshop rounds in which participants were first grouped according to the communities they signed up with, and secondly re-grouped with a post-demographic strategy (more on this in the results). Participants hereby worked together in different constellations on interpreting, contextualising and narrativising the photovoice data. The result is a collection of photos, maps, and visualisations that tell individual and collective stories about Copenhagen as a space of belonging. In 2022, these materials were displayed as exhibitions at Urban 13 and Copenhagen Architecture Festival, and in 2023 at Ars Electronica festival in Linz, where the project received the EU Citizen Science Prize.
Results
The photovoice carried out in this process opens for different analytical approaches. Here we demonstrate two of them: The first explores community-specific experiences of belonging. A second strategy uses the photovoice data to explore differences in viewpoints around particular places and situations in the city.
Community-specific Topographies of Belonging
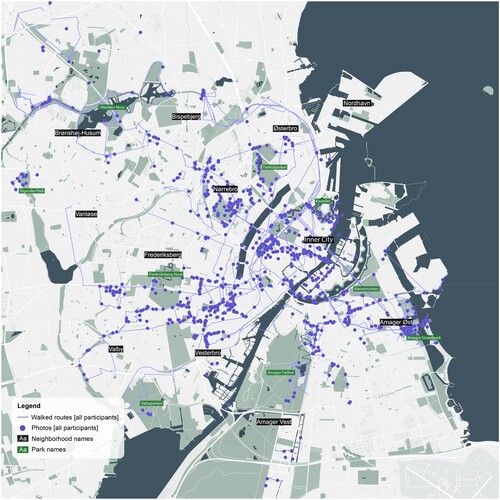
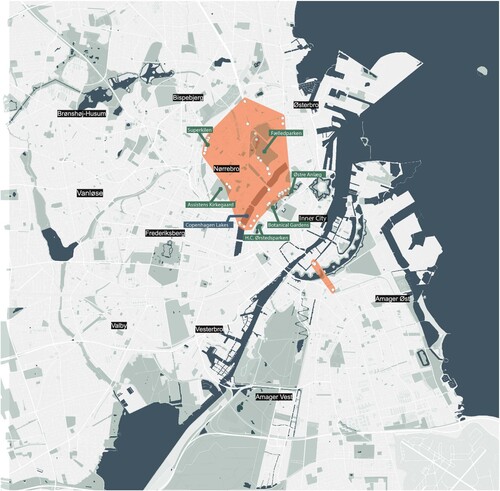
To study how participants experience belonging, we first investigate the data with a geo-spatial analysis, using QGIS to plot data. A simple map of photos (dots) and walks (lines) in Copenhagen can be seen in . The distribution of photos illustrates that the open photovoice task productively gives framing power to the participants: Whereas many citizen science projects ask participants to report experiences within a pre-defined area, the open and geo-tracked approach used here empowers participants to show what areas are relevant from their perspective. The map in for instance shows that the most photographed neighbourhoods, associated to belonging, are Vesterbro, Nørrebro, Inner City, and the parts of Amager closest to Inner City. In contrast, there are few photos taken in Frederiksberg (with photos mainly in the park ‘Frederiksberg Have’). Similarly, we see little to no photos in Østerbro, Nordhavn, Valby, Vanløse, or Amager with exceptions of photos from parks (some are labelled in the map). In fact, the map hints that participants often have photographed park and water-front areas. This indicates that green spaces are important to our participants’ experiences of belonging.
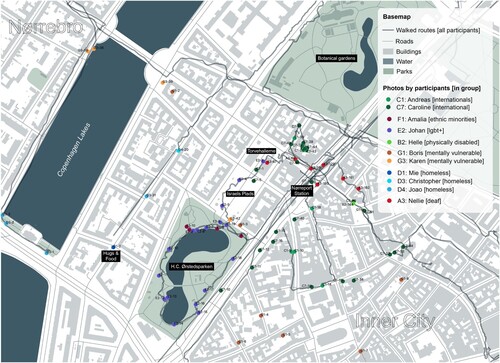
Figure 3. Map of images and walked routes submitted during photovoice.
To chart community-specific topographies of belonging, maps in and show where participants within each group have captured photos. Using QGIS, we ran a Concave Hull algorithm to draw a polygon around locations of photos captured by each group. In an ethos of counter-mapping (Dalton and Mason-Deese Citation2012), the polygons re-draw boundaries in Copenhagen according to what areas are associated with experiences of belonging by each community, while showing the locations of individual photos as white dots. Noticeable is first that homeless () and internationals () primarily photographed Inner City, while other groups tend to avoid most parts of the city centre and document other parts of the city.
Figure 4. Concave Hull maps: Polygons cover the area of the city in which participants from different groups captured photos (dots) during photovoice.
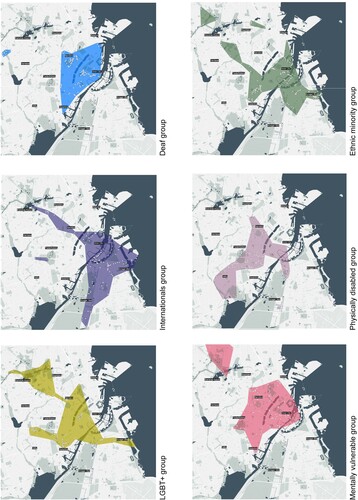
Figure 5. Concave Hull (polygon) showing where homeless participants captured photos (dots).
Inner City was also discussed with some ambivalence by the internationals in workshop one:
“The tourists in Inner City make me feel that there are international people here. The lack of appropriation by locals makes room for others. It feels more open to expats”.
“Nørreport station is an aggressive place, especially at night, with drunk people who yell, push and bump into others. Yet, as an expat your world revolves around the city center, and Nørreport is a focal point for us.”
To unfold group-specific experiences further, the first workshop round grouped participants according to the community organisation they had chosen to sign up with.
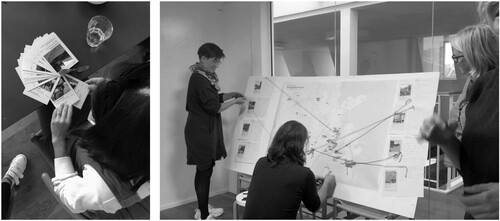
In workshops, we brought analogue decks of photos captured by each participant, who were asked to select two photos, and work in pairs on co-writing photo captions and titles, before placing them on a collective map with pins and strings (see photos in ). While 854 out of 1459 photos were annotated in the app with a positive sentiment, compared to just 210 with a negative sentiment, participants overwhelmingly chose to share photos of when the city excludes them based on their identity.
Figure 6. Images from workshops where participants selected and shared photovoice images.
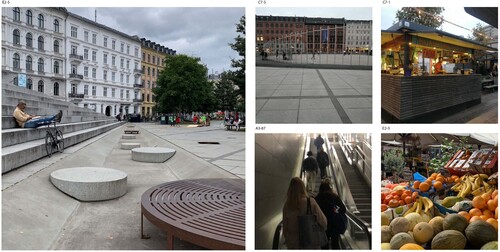
In , photo A taken by a participant in the ethnic minority group for instance expresses that the biking culture in Copenhagen can be difficult to decode, which can feel alienating and unsafe. Photo C, from a participant in the LGBT+ community, addresses a similar, yet different, negative experience stemming from decoding cultural signs and symbols in public space that are read as non-inclusive to queer people, while photo B expresses that as a mentally vulnerable person, navigating big crowds in public transport can feel difficult. For other groups, barriers to belonging revolve more explicitly around accessibility: A person in the deaf group for instance shared a story (see photo E) about how lack of visual information makes it hard to navigate public transport. A participant in the international group shared a similar, yet different, experience of language barriers (see photo D). We hereby were able to unpack a more nuanced understanding of how the urban environment affects people’s experiences of belonging and accessibility differently ().
Figure 7. Photos highlighted in workshop one. Title and caption by participants.
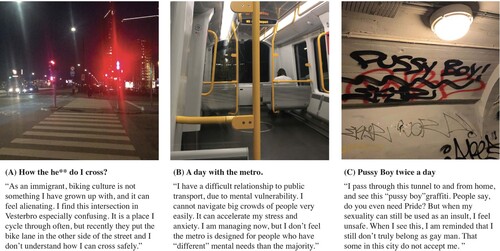
Figure 8. Photos highlighted in workshop one. Title and caption by participants.
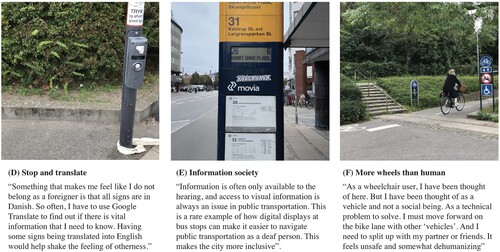
Finally, photo F by a disabled person showcases that even when cities design according to ‘universal design’ (Lid Citation2014) principles like barrier-free design, such solutions do not necessarily create feelings of belonging. The photo captures the entry to a park from the viewpoint of the street, with stairs to the left leading up to the park, while to the right a bike lane with a wheelchair sign runs along the park. As expressed in the caption, this urban design forces the participant to split up from companions and makes him feel ‘more wheels than human’. This demonstrates why it matters that planners and policy makers involve local, embodied knowledge in collaborative processes, when aiming to design socially sustainable cities. In this effort, photovoice offers an engagement form that, different from conventional formats, can immerse us in situ in an environment, situation, and emotion, and show us the city through different people’s eyes.
Site-specific Approach: Conflicting Viewpoints
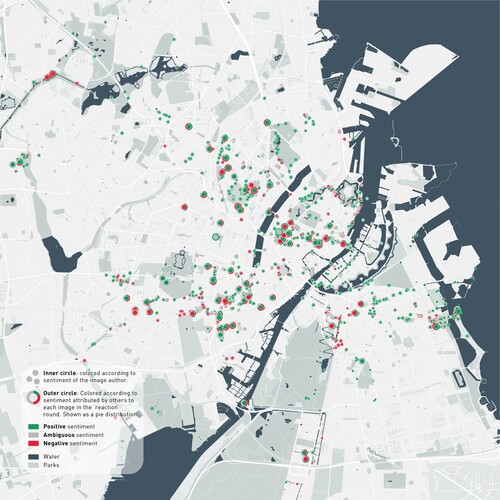
In addition to the open-ended approach taken so far, we propose that our geospatial photovoice method can also be used to explore how people experience particular places differently. To showcase this, we re-grouped participants for workshop two: Plotting all photos in QGIS, we used a K-means clustering algorithm to divide photos into five spatial clusters (see Appendix). Participants were then grouped based on which of these areas they had mostly taken photos within. This shifted the organisation of participation from community-specific to post-demographic (Rogers Citation2013) in workshop two, enabling us to zoom in on areas that everyone in a group has a relationship to. To open conversations about this, we used the two-fold sentiment scores attributed to photos and created the ‘double-sentiment’ map seen in : The map plots images as dots with an inner and outer ring. The inner ring indicates the sentiment ascribed to a photo by its author; green being positive, red negative, and grey ambiguous. The outer ring uses the same colours to show distribution of sentiments attributed by other participants when reacting to a photo in the app. Where the inner ring matches the colour of the outer ring, participants react to the photo with the same sentiment as its author. But some photos are also associated with diverging sentiments and for instance have a green inner dot, and a red outer ring. Participants reacting to a photo might also disagree, exemplified when the outer ring is both green and red. Using statistical capabilities of QGIS, we compute the 127 photos with the highest variance on sentiment. These ‘contested photos’ are displayed as bigger dots in .
Figure 9. Double-sentiment map showing the sentiment of each photo (inner dot) and distribution of sentiments ascribed to photos by other participants reacting to it (outer ring).
To elicit conversation about how people experience urban environments differently, we brought the most contested photos to workshop two. Here we asked participants to work in pairs (see ) on selecting a photo, discuss how they see it, and write notes. Examples are seen in and .
Figure 10. Images from workshop where participants discuss contested photos.
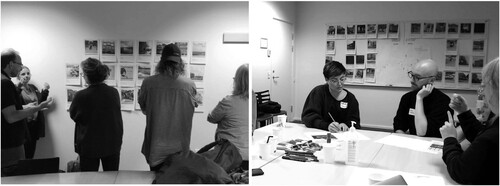
Figure 11. Contested photos discussed in workshop two. Caption by participants.
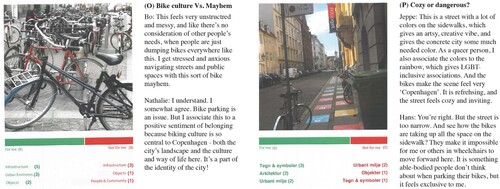
Figure 12. Contested photos discussed in workshop two. Caption by participants.
Here, Photo O and P tell conflicting stories about biking culture in the city: While Nathalie sees the bikes in Photo O as a characteristic part of the streetscape and a positive part of the identity and way of life in Copenhagen, Bo experiences the parked bikes as a ‘mayhem’ that is stressful to navigate as a mentally vulnerable person. Similar to Nathalie, Johan sees the bikes in photo P as adding positively to the identity and atmosphere of the street. But from Hans’ perspective, being in a wheelchair, the bikes in photo P block his movement on the sidewalk and exclude him from the space. This exemplifies how photovoice can unfold conflicting views and needs around for instance bike parking.
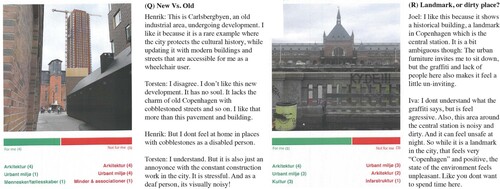
In , we see other examples of conflicting viewpoints. In photo Q, Torben feels negatively about the new urban development in Carlsbergbyen, which he feels lacks the charm of ‘old’ cobblestoned Copenhagen. Meanwhile, Lars, who is a wheelchair user feels positive about this area, where the smooth pavement makes the space accessible for him. In contrast, he feels excluded by the cobblestone streets mentioned by Torben. While both Torben and Lars identify as LGBT+, it is here other parts of their identities, one being deaf and the other physically disabled, that shape why react to this photo differently. This shows why it matters to take an intersectional lens and not assume that people who share one identity have the same needs. Photo R, meanwhile, discusses with ambivalence how the Central Station is at the same time seen as a positive landmark and a dirty, unsafe transit area. Here the participants agree, but feel positive and negative about this space. To design inclusive cities, it matters then that planners develop data practices that can capture such ambiguousness beyond simplistic ideas of spaces as either ‘good’ or ‘bad’. Photovoice, as demonstrated here, can help produce multilayered representations that contrast different viewpoints.
Studying difference in experiences can also come from zooming in on locations where participants have documented the same place. for instance shows the area around ‘Ørstedsparken’, photographed by different participants.
Figure 13. Map of photovoice data around Ørstedsparken (Inner City).
Ørstedsparken is a public park in central Copenhagen which for decades has been a cruising site for gay men. In the 2010s, the municipality cut down vegetation to regulate and prevent cruising (Bengtsen Citation2013). The park is located next to the square Israels Plads, a food market called Torvehallerne, and Nørreport train and metro station. What is noticeable is that neither the internationals nor homeless participants have captured photos of the park, although being frequent users of Inner City, as we learned earlier, where we saw that the homeless participants depend a lot on parks. That the homeless participants are not using this park, although being close by when visiting Hugs & Food, could indicate that the city’s interventions to ‘clean’ the park by cutting away vegetation has a negative effect on homeless people’s chances of finding protective pockets in nature. Noticeable is also that most participants photographing this area arrive from North. In fact, no one enters the park from the South, West, or East. Such insights could inform planning interventions to open the park up to other sides. Entering the park from the North, we see that participants instead create connection between the park and the square, food market and train station, exemplified by photos in .
Figure 14. Photos of Israels Plads and Torvehallerne.
Only a participant from the ethnic minority group, Amalia, who also identifies as bisexual, and a participant from the LGBT+ group, Johan, go into the park. compares their photos to make legible how the two participants notice different things. While Johan walks all the way around the park, Amalia stays in the part that is adjacent to Israel’s Plads. Whereas Johan mainly captures the park itself (statues, flowers, lake, and so on), Amalia’s photos portray people laying on grass, dog walking, visiting a café, and so on. She thus seems to connect mostly with the public life in the Northern part of the park, while Johan walks away from the many people at the entrance.
Figure 15. Map of two participants’ photovoice walks in Ørstedsparken.
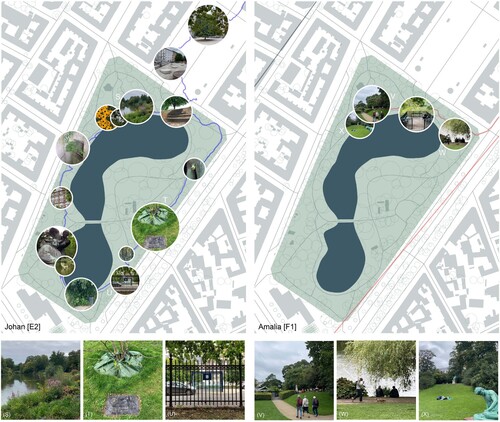
Here, he takes photo T of a tree that has been donated by Copenhagen Pride, hereby connecting actively with the LGBT-history of the park. While documenting the park as a space of belonging, Johan and Amalia thus have different uses and viewpoints of it. This deep dive exemplifies how we can use geolocated photovoice to trace difference in use and viewpoints. Seeing how participants move in and out of space can moreover help us understand places as networked and connected to other places through the way participants walk between them (Certeau Citation2011). And studying photovoice images as a series (temporally and spatially) further adds contextual understanding by making legible how people ‘string’ together experiences in the city; not from a snapshot moment, but from a sequence of impressions that connected environments create.
Conclusion
The Urban Belonging project has shown that by re-tooling photovoice with digital, mobile technology, it is possible to reconfigure public participation in urban planning. First, a review demonstrated that while traditional photovoice projects are efficient at reimagining who has a voice in planning, such projects often work with small-N samples, study communities in isolated ways, and has been slow to leverage digital opportunities for reworking the method. The article then introduced the way the UB App enables a digital, geospatial methodology, and delivered a two-fold analysis to exemplify what opportunities this creates: In the results, a geospatial analysis mapped community-specific topographies of belonging and unpacked group-specific narratives about barriers to feeling included in the city. Second, the analysis demonstrated how digital photovoice can be used to regroup participants and study how people experience the same places in different ways.
Discussion
The Urban Belonging project demonstrates that digital photovoice method can open new epistemological flexibilities with significant analytical potential: For one, the method made it possible to switch between a community-specific and post-demographic sampling. This reconfigures conventional engagement by creating opportunities to organise participation in different ways. Second, our methodology lets participants challenge expert-led problem frames exemplified by the spatially open-ended photovoice task. This relates to a third potential of the method, namely that it enables us to move between top-down and bottom-up inquiries: While the first analysis used explorative strategies to discover where people experience belonging, the second analysis demonstrated that photovoice can also be used in more targeted ways to understand how different people experience a particular site. Finally, the methodology enables quali-quantitative visual research, since the image data can be counted, filtered, and used to move between high-level quantitative patterns and local qualitative stories.
The project also raises dilemmas and questions that demand further reflection. One relates to data ableism and visual literacy. As with any tool, the UB App has affordances that can both include and exclude certain groups: In our project, a deaf participant, for instance, expressed that the visual method gives their community a stronger voice in planning:‘ With photovoice, the deaf community is given a chance to influence a city that is also good for us. The visual approach meant that we suddenly have a lot to “say”’. Simultaneously, however, photovoice method excludes the blind and visually impaired. Unless getting assistance, an app-based approach can also exclude people with physical disabilities who cannot operate a smartphone. While the UB App is purposefully designed to downplay differences in visual capabilities (see Madsen et al. (Citation2023)), it is also important to stress that hierarchies will always exist between people who are more and less capable of making their experiences legible through visual technologies (Krase Citation2016; Charitsis and Lehtiniemi Citation2023).
Finally, we might reflect on the imagined impact of photovoice. Scholars like Sanon et al. (Citation2014) have critically investigated the social justice outcomes of 30 photovoice projects from 2008 to 2013, showing that impacts tend to be more related to social justice awareness (n = 30), than amelioration (n = 11) or transformation (n = 3). With the Urban Belonging Project, we have first and foremost created increased awareness through a series of public photovoice exhibitions as the main project output ().
Figure 16. Photos from exhibition at Copenhagen Architecture Festival, 2022.
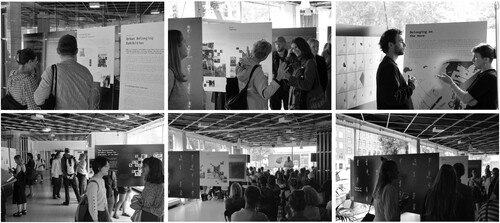
Talks held at the exhibition at Copenhagen Architecture Festival for instance brought researchers, policy makers, and participants together in panel debates about Copenhagen as an inclusive cities, demonstrating that photovoice exhibitions can replace a one-way relationship between publics and researchers with a dialogical one (Teti and Myroniuk Citation2022). In September 2023, the project was also awarded the EU Citizen Science Prize and exhibited at Ars Electronica in Linz, reaching an international citizen science audience. Beyond increased awareness in Copenhagen, the project has also had more applied impacts: In 2023, the method and app were used in a project in Aarhus, Denmark, to engage residents in giving input on city’s development of the Gellerup Park area, a majority non-White neighbourhood. The process has also been used in Seattle, where an environmental justice NGO, DVSA, used the app and method in 2022 to engage the BIPOC-youth in South Park in giving input on the city’s new comprehensive plan. DVSA and youth leaders used the photovoice data directly in workshops with policy makers to co-create new neighbourhood policies and form the city’s first Anti-Displacement framework. The photovoice method and UB App are hereby already used to create transformation impacts for marginalised groups in local urban settings around the world. While the project has not yet resulted in tangible interventions in Copenhagen, our participants expressed that the process itself increased their feeling of belonging and agency. One said: ‘Through participating in the project, I feel a greater sense of belonging than before we started.’ Another shared: ‘Analysing the data together increased my sense of agency’. While engagement processes, as discussed in the introduction, can alienate, they can thus also produce belonging. From this, we might finish by echoing the Othering & Belonging Institute: ‘More than just being seen or feeling included, belonging entails having a voice and the opportunity to use it to make demands upon society and political institutions’ (Araiza and Grossman Citation2021, 2). That is why innovation of equitable public participation methods matters.
Geolocation area
Copenhagen, Denmark.
Acknowledgements
The Urban Belonging Project is co-funded by the ‘Doing Data Together’ project grant, awarded to Anders Koed Madsen at Aalborg University, and Innovation Fund Denmark’s independent research grants awarded to Sofie Burgos-Thorsen and Drude Emilie Ehn respectively. In addition, it is supported by Gehl Architects, Service Design Lab (Aalborg University), Center for Digital Welfare (IT University Copenhagen), and the Centre of Expertise for Creative Innovation (CoECI) in Amsterdam. The core research team behind the project consists of Sofie Burgos-Thorsen, Drude Emilie Ehn, Anders Koed Madsen, Thorben Simonsen, Sabine Niederer, Maarten Groen, Carlo De Gaetano, Kathrine Norsk, Federico Di Fresco. Credit also goes to the project participants and community partners: LGBT+ Danmark, Mino Danmark, Sind, Dansk Handicap Forbund, Danske Døves Landsforbund, Hugs & Food.
DISCLOSURE STATEMENT
No potential conflict of interest was reported by the author(s).
Additional information
Funding
Notes on contributors
Sofie Burgos-Thorsen
Sofie Burgos-Thorsen is a sociologist and PhD in data-driven urbanism, working as a researcher at the Techno-Anthropology Lab (TANTLab), Copenhagen. She works to bridge research in visual methodologies, computational methods, humanistic GIS, and counter mapping, with practices of urban planning and architecture, exploring how these fields can come together to involve local communities in framing urban issues. She works from a data feminist approach in reimagining the role data can have in creating equitable cities.
Sabine Niederer
Sabine Niederer is Professor with the Visual Methodologies Collective at the Amsterdam University of Applied Sciences Faculty of Digital Media and Creative Industries, specialises in developing visual methods for social and cultural research.
Anders Koed Madsen
Anders Koed Madsen is Associate Professor at TANTLab where he does work on various aspects of digital knowledge organisation. His research agenda is currently made up of two sub-streams. One is concerned with digital methods and the re-tooling of humanistic methods. The other is concerned with big data and related shifts in organisational data practices.
Notes
1 Danish Deaf Association, LGBT+ Denmark, Danish Handicap Association, SIND Denmark, Mino Denmark, and Hugs & Food
References
- Aboulkacem, Abigail R., Slimane Aboulkacem, and Lory E. Haas. 2021. “Photovoice 2.0: A Comprehensive Research Framework for the Digital Generation.” TechTrends 65 (5): 874–883. doi:10.1007/s11528-021-00642-4.
- Araiza, Olivia E, and Sara Grossman. 2021. Redefining Who Belongs: Narrative Strategy for Belonging. Berkeley: Othering & Belgonging Institute.
- Bellacasa, María Puig de la. 2017. Matters of Care: Speculative Ethics in More Than Human Worlds. U of Minnesota Press.
- Bengtsen, Peter. 2013. “Just Gardens? On the Struggle for Space and Spatial Justice.” Australian Feminist Law Journal 39 (1): 79–92. doi:10.1080/13200968.2013.10854493.
- Bennett, Julia. 2014. “Gifted Places: The Inalienable Nature of Belonging in Place.” Environment and Planning D: Society and Space 32 (4): 658–671. doi:10.1068/d4913p.
- Birkbak, Andreas, and Irina Maria Clara Hansen Papazu. 2022. Democratic Situations. Manchester: Mattering Press.
- Boomgaard, J., and R. Brom. 2017. Being Public. Valiz Publishers. https://dare.uva.nl/personal/pure/en/publications/being-public(25a02d38-bb3e-456a-8993-3537ddf3a478).html.
- Budig, Kirsten, Julia Diez, Paloma Conde, Marta Sastre, Mariano Hernán, and Manuel Franco. 2018. “Photovoice and Empowerment: Evaluating the Transformative Potential of a Participatory Action Research Project.” BMC Public Health 18 (1): 432. doi:10.1186/s12889-018-5335-7.
- Cai, Yanjun, and Danny Marks. 2021. “Photovoice in the Age of Social Media: Helping to Build Participation Needed for Urban Climate Resilience?” Urban Climate 40 (December): 101019. doi:10.1016/j.uclim.2021.101019.
- Certeau, Michel de. 2011. The Practice of Everyday Life. Steven Randall ed. 3rd ed. Berkeley: University of California Press.
- Charitsis, Vassilis, and Tuukka Lehtiniemi. 2023. “Data Ableism: Ability Expectations and Marginalization in Automated Societies.” Television & New Media 24: 3–18. doi:10.1177/15274764221077660.
- Cila, Nazli, Guido Jansen, Maarten Groen, Wouter Meys, Lea den Broeder, and Ben Kröse. 2016. “Look! A Healthy Neighborhood: Means to Motivate Participants in Using an App for Monitoring Community Health.” Proceedings of the 2016 CHI Conference Extended Abstracts on Human Factors in Computing Systems. 889–898. CHI EA ‘16. New York, NY: Association for Computing Machinery. doi:10.1145/2851581.2851591.
- Costanza-Chock, Sasha. 2020. Design Justice: Community-Led Practices to Build the Worlds We Need. Cambridge, Massachusetts: The MIT Press.
- Dalton, Craig, and Liz Mason-Deese. 2012. “Counter (Mapping) Actions: Mapping as Militant Research.” ACME: An International Journal for Critical Geographies 11 (3): 439–466. https://acme-journal.org/index.php/acme/article/view/941.
- Davis, Denyvetta, Cheree Harris, Venita Johnson, Cheryl Pennington, Cresha Redus, Tiffani Sanders, Net-Hetep Ta-Nesert, et al. 2020. “Black Women’s Perspectives on Neighborhood Safety: Reflections from The Women of Northeast Oklahoma City Photovoice Project.” Gender, Place & Culture 27 (7): 917–943. doi:10.1080/0966369X.2019.1611547.
- Dewey, John, and Melvin L. Rogers. 2012. The Public and Its Problems: An Essay in Political Inquiry. Penn State Press.
- D’Ignazio, Catherine, and Lauren F. Klein. 2020. Data Feminism. Cambridge, Massachusetts: The MIT Press.
- Duran, Antonio. 2019. “A Photovoice Phenomenological Study Exploring Campus Belonging for Queer Students of Color.” Journal of Student Affairs Research and Practice 56 (2): 153–167. doi:10.1080/19496591.2018.1490308.
- Flanigan, Bailey, Paul Gölz, Anupam Gupta, Brett Hennig, and Ariel D. Procaccia. 2021. “Fair Algorithms for Selecting Citizens’ Assemblies.” Nature 596 (7873): 548–552. doi:10.1038/s41586-021-03788-6.
- Foster, Kirk A., Brittany Davis, and Andrew Foell. 2023. “Innovations to Photovoice: Using Smartphones & Social Media.” Urban Affairs Review 59: 1728–1744. doi:10.1177/10780874221100263.
- Friedmann, J. 1998. “The New Political Economy of Planning: The Rise of the Civil Society,.” In Cities for Citizens, edited by M. Douglass and J. Friedmann, 19–38. Chichester: Wiley.
- Gaboardi, Marta, Giorgia Zuccalà, Michela Lenzi, Sara Ferrari, and Massimo Santinello. 2018. “Changing the Method of Working with Homeless People: A Photovoice Project in Italy.” Journal of Social Distress and the Homeless 27 (1): 53–63. doi:10.1080/10530789.2018.1446407.
- García, Borja, Jo Welford, and Brett Smith. 2016. “Using a Smartphone App in Qualitative Research: The Good, the Bad and the Ugly.” Qualitative Research 16 (5): 508–525. doi:10.1177/1468794115593335.
- Goodman, Ashley, Marcie Snyder, Kathi Wilson, and Jason Whitford. 2019. “Healthy Spaces: Exploring Urban Indigenous Youth Perspectives of Social Support and Health Using Photovoice.” Health & Place 56 (March): 34–42. doi:10.1016/j.healthplace.2019.01.004.
- Greene, Stuart, Kevin J. Burke, and Maria K. McKenna. 2018. “A Review of Research Connecting Digital Storytelling, Photovoice, and Civic Engagement.” Review of Educational Research 88 (6): 844–878. doi:10.3102/0034654318794134.
- Gubrium, Aline, and Krista Harper. 2016. Participatory Visual and Digital Methods. Vol. 10. Routledge.
- Halegoua, Germaine R. 2020. The Digital City: Media and the Social Production of Place. Illustrated ed. NYU Press.
- Haraway, Donna. 1988. “Situated Knowledges: The Science Question in Feminism and the Privilege of Partial Perspective.” Feminist Studies 14 (3): 575–599. doi:10.2307/3178066.
- Harper, Douglas. 2002. “Talking About Pictures: A Case for Photo Elicitation.” Visual Studies 17 (1): 13–26. doi:10.1080/14725860220137345.
- Harvey, David. 2008. “The Right to the City.” The City Reader 1 (6): 23–40.
- Healey, Patsy. 2020. Collaborative Planning: Shaping Places in Fragmented Societies. Bloomsbury Publishing.
- Holtby, Alix, Kate Klein, Katie Cook, and Robb Travers. 2015. “To Be Seen or Not to Be Seen: Photovoice, Queer and Trans Youth, and the Dilemma of Representation.” Action Research 13 (4): 317–335. doi:10.1177/1476750314566414.
- Irvin, Renée A., and John Stansbury. 2004. “Citizen Participation in Decision Making: Is It Worth the Effort?” Public Administration Review 64 (1): 55–65. doi:10.1111/j.1540-6210.2004.00346.x.
- Kahila-Tani, Maarit, Marketta Kytta, and Stan Geertman. 2019. “Does Mapping Improve Public Participation? Exploring the Pros and Cons of Using Public Participation GIS in Urban Planning Practices.” Landscape and Urban Planning 186 (June): 45–55. doi:10.1016/j.landurbplan.2019.02.019.
- Kettles, Iain. 2022. “UB App.” TypeScript. Urban Belonging. https://github.com/Urban-Belonging/UrbanBelonging.
- Krase, Jerome. 2016. Seeing Cities Change: Local Culture and Class. London: Routledge. doi:10.4324/9781315608174.
- Lid, Inger Marie. 2014. “Universal Design and Disability: An Interdisciplinary Perspective.” Disability and Rehabilitation 36 (16): 1344–1349. doi:10.3109/09638288.2014.931472.
- Lowndes, Vivien, Lawrence Pratchett, and Gerry Stoker. 2001. “Trends in Public Participation: Part 2 – Citizens’ Perspectives.” Public Administration 79 (2): 445–455. doi:10.1111/1467-9299.00264.
- Macdonald, Diane, Karen Peacock, Angela Dew, Karen R. Fisher, and Katherine M. Boydell. 2022. “Photovoice as a Platform for Empowerment of Women with Disability.” SSM - Qualitative Research in Health 2 (December): 100052. doi:10.1016/j.ssmqr.2022.100052.
- Madsen, Anders Koed, Sofie Burgos-Thorsen, Carlo De Gaetano, Drude Ehn, Maarten Groen, Sabine Niederer, Kathrine Norsk, and Thorben Simonsen. 2023. “The Urban Belonging Photo App: A Toolkit for Studying Place Attachments with Digital and Participatory Methods.” Methodological Innovations (August): 20597991231185350. doi:10.1177/20597991231185351.
- Magee, Carol. 2007. “Spatial Stories: Photographic Practices and Urban Belonging.” Africa Today 54 (2): 108–129. doi:10.2979/AFT.2007.54.2.108.
- Marres, Noortje. 2005. “Issues Spark a Public Into Being: A Key but Often Forgotten Point of the Lippmann-Dewey Debate.” In Making Things Public, edited by Bruno Latour and Peter Weibel. Mass.: MIT Press. http://research.gold.ac.uk/id/eprint/13612/.
- Meenar, Mahbubur R., and Lynn A. Mandarano. 2021. “Using Photovoice and Emotional Maps to Understand Transitional Urban Neighborhoods.” Cities 118 (November): 103353. doi:10.1016/j.cities.2021.103353.
- Miled, Neila. 2020. “Can the Displaced Speak? Muslim Refugee Girls Negotiating Identity, Home and Belonging Through Photovoice.” Women’s Studies International Forum 81 (July): 102381. doi:10.1016/j.wsif.2020.102381.
- Osborne, Thomas, and Nikolas Rose. 1999. “Do the Social Sciences Create Phenomena?: The Example of Public Opinion Research.” The British Journal of Sociology 50 (3): 367–396. doi:10.1111/j.1468-4446.1999.00367.x.
- Petteway, R. J. 2019. “Intergenerational Photovoice Perspectives of Place and Health in Public Housing: Participatory Coding, Theming, and Mapping in/of the ‘Structure Struggle’.” Health & Place 60: 102229. doi:10.1016/j.healthplace.2019.102229.
- Pichon, Latrice C., Michelle Teti, and L. Lauren Brown. 2022. “Triggers or Prompts? When Methods Resurface Unsafe Memories and the Value of Trauma-Informed Photovoice Research Practices.” International Journal of Qualitative Methods 21 (January): 160940692211139. doi:10.1177/16094069221113979.
- Plane, Jocelyn, and Fran Klodawsky. 2013. “Neighbourhood Amenities and Health: Examining the Significance of a Local Park.” Social Science & Medicine 99 (December): 1–8. doi:10.1016/j.socscimed.2013.10.008.
- Plowman, Lydia, and Olivia Stevenson. 2012. “Using Mobile Phone Diaries to Explore Children’s Everyday Lives.” Childhood (Copenhagen, Denmark) 19 (4): 539–553. doi:10.1177/0907568212440014.
- Rogers, Richard. 2013. Digital Methods. The MIT Press.
- Rose, Gillian. 2016. Visual Methodologies: An Introduction to Researching with Visual Materials. SAGE.
- Ruppert, Evelyn, and Stephan Scheel. 2021. Data Practices: Making Up a European People. London: Goldsmiths Press. https://www.gold.ac.uk/media/documents-by-section/about-us/goldsmiths-press/publications/Data-Practices.pdf.
- Sanon, M.-A., R. A. Evans-Agnew, and D. M. Boutain. 2014. “An Exploration of Social Justice Intent in Photovoice Research Studies from 2008 to 2013.” Nursing Inquiry 21 (3): 212–226. doi:10.1111/nin.12064.
- Soma, Tammara, Belinda Li, and Tamara Shulman. 2022. “A Citizen Science and Photovoice Approach to Food Asset Mapping and Food System Planning.” Journal of Planning Education and Research, 0739456X2210889. doi:10.1177/0739456X221088985.
- Teti, M., and T. Myroniuk. 2022. “Image to Action: Past Success, Ongoing Questions, and New Horizons for Photovoice Exhibits.” Health Promotion Practice 23 (2): 262–266. doi:10.1177/15248399211054774.
- Valera, Pamela, Jill Gallin, Dawn Schuk, and Nakisha Davis. 2009. “‘Trying to Eat Healthy’: A Photovoice Study About Women’s Access to Healthy Food in New York City.” Affilia 24 (3): 300–314. doi:10.1177/0886109909337378.
- Venturini, Tommaso, and Bruno Latour. 2010. The Social Fabric: Digital Traces and Quali-Quantitative Methods. January.
- Volpe, Catherine Rita. 2019. “Digital Diaries: New Uses of PhotoVoice in Participatory Research with Young People.” Children's Geographies 17 (3): 361–370. doi:10.1080/14733285.2018.1543852.
- Wang, C., and M. A. Burris. 1997. “Photovoice: Concept, Methodology, and Use for Participatory Needs Assessment.” Health Education & Behavior: The Official Publication of the Society for Public Health Education 24 (3): 369–387. doi:10.1177/109019819702400309.
- Wang, Caroline, Mary Ann Burris, and Xiang Yue Ping. 1996. “Chinese Village Women as Visual Anthropologists: A Participatory Approach to Reaching Policymakers.” Social Science & Medicine 42 (10): 1391–1400. doi:10.1016/0277-9536(95)00287-1.
- Witkowski, Kaila, Armando Matiz Reyes, and Mark Padilla. 2021. “Teaching Diversity in Public Participation Through Participatory Research: A Case Study of the PhotoVoice Methodology.” Journal of Public Affairs Education 27 (2): 218–237. doi:10.1080/15236803.2020.1858534.
Appendix: Division of photovoice data into spatial clusters with K-means algorithm: One for English-speaking participants (red), and four for Danish-speaking participants.