?Mathematical formulae have been encoded as MathML and are displayed in this HTML version using MathJax in order to improve their display. Uncheck the box to turn MathJax off. This feature requires Javascript. Click on a formula to zoom.
Abstract
This paper investigates the potential use of natural ventilation strategies to reduce the energy demand for cooling and mechanical ventilation for high-rise buildings in summer. A 21-storey office building was selected to represent a mechanically ventilated high-rise design in temperate climates. Six natural ventilation scenarios were developed for the base design and the CFD package in DesignBuilder was used to predict their flow pattern under two summer conditions. Afterwards, the Operative temperature and the total fresh air changes per hour were calculated with EnergyPlus and were compared accordingly with European comfort standards. The percentage of discomfort hours indicates when a natural ventilation system would need active cooling or mechanical ventilation. Natural ventilation strategies can provide comfort conditions for up to 90% of the occupancy time in summer and therefore can save a significant amount of energy that is generally needed for the operation of traditional mechanical ventilation and air-conditioning systems.
1. Introduction
The primary purpose of a ventilation system is to provide a healthy and comfortable indoor environment (Etheridge, Citation2010). The two main types of ventilation systems are natural and mechanical ventilation. Occasionally, natural ventilation (both supply and exhaust without mechanical means) may be perceived to be inadequate, especially with large commercial buildings and, therefore, a hybrid ventilation system is a way of reducing the risk (Etheridge, Citation2012). Hybrid ventilation solutions, also known as mixed-mode systems, use a combination of natural and mechanical ventilation in order to minimise energy consumption. Typically using natural ventilation when the external conditions such as air temperature or wind speed are optimal, and switching the system to mechanical when the external conditions do not allow (Wood & Salib, Citation2013). There are some advantages and disadvantages when using a natural ventilation system. Perhaps the main advantage is by its contribution to a sustainable built environment. In commercial buildings, a substantial portion of energy is consumed by HVAC equipment, including fans. Recent studies show that fans account for roughly 15–20% of the total energy use in a multi-storey office building depending on climate and other factors (Raji, Tenpierik, & van den Dobbelsteen, Citation2017; Rossi & Wolf, Citation2016). Purely natural ventilation systems idealistically require no energy for the supply of fresh air since the major forces for ventilation are wind and buoyancy. Mechanical means should only create under- or over-pressure in the limited occasions of lack of natural draft, creating a considerable reduction of energy use.
In addition to providing fresh air, natural ventilation plays a key role in maintaining thermal comfort and may lead to thermal energy-savings. When cooling is required for occupants’ thermal comfort and the outdoor air temperature is lower than the indoor air temperature, outdoor fresh air can be used to achieve indoor cooling. This can be more beneficial in buildings with excessive internal or solar heat gains. Furthermore, ventilation has a direct cooling effect on the human body through convection and evaporation. In a naturally ventilated building, the ability of occupants to adapt to internal and external conditions is present, in the sense that having control over the indoor environment can extend the occupants’ comfort range and reduces the need for active cooling (Nicol, Humphreys, & Roaf, Citation2012).
Despite benefits, natural ventilation systems have a number of drawbacks that are important to be aware of when designing naturally ventilated buildings. Natural ventilation can save space necessary for plant rooms and duct networks, but due to its strong dependence on weather conditions, occasionally, non-domestic buildings require vertical shafts such as atria or solar chimneys to improve the air flow rate, when wind speeds are low. In this case, minimising the efficient use of floor space in commercial buildings may be unfavourable from a commercial viewpoint (Wood & Salib, Citation2013). Furthermore, it is difficult to control natural ventilation and it only works for relatively narrow floor plans.
The driving forces for natural ventilation in high-rise buildings are similar to those for other building typologies. However, tall buildings can take advantage of the excessive height to enhance air velocity and therefore the occupants’ comfort. Architectural features such as atria, solar chimneys and double-skin facades are increasingly incorporated into the design of high-rise buildings to assist natural ventilation (Wood & Salib, Citation2013). The interaction of heat and air flows between different building zones and these vertical shafts has been the topic of research until now (Holford & Hunt, Citation2003; Khanal & Lei, Citation2011; Khanal & Lei, Citation2012; Liping & Hien, Citation2007; Moosavi, Mahyuddin, Ab Ghafar, & Azzam Ismail, Citation2014; Priyadarsini, Cheong, & Wong, Citation2004). The scope of this paper is to investigate the potential use of natural ventilation strategies to reduce the energy demand for cooling and mechanical ventilation for high-rise buildings in summer. The next section comprises a thorough literature review on natural ventilation strategies that have been applied in multi-storey buildings.
2. An overview of previous studies
Comparing with conventional double-skin facades, Ding, Hasemi, and Yamada (Citation2005) investigated the potential performance of a solar chimney set on top of a double skin-façade building to enhance natural ventilation. According to the CFD results, a solar chimney with a minimum height of two floors on top of a double skin façade can increase pressure differences, hence the air change rate of intermediate floors. However, the number of air changes for the base and top floors varied significantly. For an even distribution of natural ventilation, Ding et al. suggested that the opening sizes of internal windows should not be the same at different floors.
Acred and Hunt (Citation2014) used simplified mathematical models to define buoyancy-driven ventilation of an atrium in a multi-storey building. In agreement with the findings of the previous study, they found the minimum and maximum air flows for the floors located on the top and the ground level respectively. The reason is that at higher levels the required pressure which drives the air flow is less. They came up with a simplified method to help designers to choose the appropriate vent sizes needed on different storeys for a multi-storey building with an unheated atrium design.
Shafiei Fini and Moosavi (Citation2016) investigated different atrium shapes with converging, diverging and vertical walls by using CFD simulations. The tilted walls have a 5° deviation from base to roof with a 8 m longest span. In all cases the atrium is located in the centre of a 10-storey building with an open plan layout (8 m depth) and the size of the air vents stayed the same for all floors. They found that an atrium design with converging walls enhanced the air velocity for base floors better than the others. No significant improvement in ventilation was observed for the case with diverging walls compared to the vertical one. The best performance, however, was achieved by an integrated atrium design that consisted of convergent walls for the base floors and vertical walls for the upper floors.
Prajongsan and Sharples (Citation2012) investigated the potential performance of ventilation shafts in a single-sided residential unit during summer (February-May) in a tropical climate. Air velocities and the percentage of comfort hours in a hypothetical room with and without a ventilation shaft were assessed using EnergyPlus and the CFD code in the DesignBuilder software. The test room was located at the second-to-last floor of a 25-storey high-rise building and at the centre of the building floor. The room has access to natural ventilation from a centrally positioned window facing the prevailing wind direction, with 2.4 m2 operable area, opened 24 hours a day. The proposed vertical shaft had a size of 0.6 × 2.0 m and it was placed at a distance of 6 m from the window. They found that the average air velocity in the room with a vertical shaft was substantially higher than in the room without a shaft under different wind conditions. Furthermore, they used Szokolay’s physiological cooling equation to calculate the potential cooling effect of elevated air velocities from the application of the vertical shaft. Comparing the operative temperature inside the room with and without shaft, the result showed that the shaft was able to extend the comfort time from 37.5% to 56.3% during the summer.
Liu, Lin, and Chou (Citation2009) assessed the efficiency of buoyancy-driven ventilation of an atrium building in a hot and humid climate using CFD combined with scale model tests. They found that the external ambient temperature has a larger impact on temperature variations in the atrium than the internal loads. When the atrium height is limited (4-storey) and the ambient air temperature is almost constant (such as in hot and humid climates), the buoyancy-driven ventilation is not very effective. In this case, a mixed-mode ventilation system might be necessary to provide the desired thermal comfort.
Through an overview of studies on natural ventilation systems, we found that buoyancy-driven ventilation by using atria or solar chimneys have been investigated for buildings with very limited height (low-rise buildings) for the majority of cases. Findings showed that the performance of the vertical shaft is highly influenced by the building height. As a result, for a better understanding of the performance of buoyancy-driven ventilation, more research is needed on tall buildings. Furthermore, a comparative study of different design strategies and their influences on natural ventilation for tall buildings could be very helpful from the architectural viewpoint since it can help architects to make energy-conscious decisions during the early-stage design.
3. Case study description
3.1. Building design
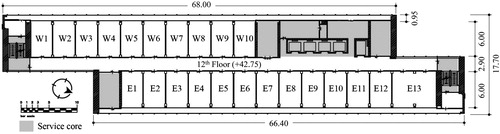
The 21-storey case study building concerns the Faculty of Electrical Engineering, Mathematics and Computer Science (EWI) of the Delft University of Technology. The EWI building was completed in 1968, a time in which the building regulations had limited energy directives. The building has a rectangular plan with an aspect ratio of about 4.5:1. The building has multiple cores. Vertical circulation is provided by two staircases located at both ends of the corridor, and by a large core in the east of the building containing elevators and sanitary facilities. On each floor two plant rooms are located diagonally opposing each other. The building layout contains cellular offices along the west and east sides and a central corridor, as shown in . The east- and west-facing facades consist of an outer single-glazed curtain wall and an inner single-glazed window enclosing a 95 cm cavity. The percentage of window-to-wall ratio (WWR) is higher for the external leaf (WWR: 95%) and lower for the internal leaf (WWR: 60%). While, the north- and south-facing facades (smaller sides) have no glazing. The inner windows cannot be opened since the building was designed to be mechanically ventilated. External vents allow the cavity to be naturally ventilated during summer. The cavity is continuous horizontally, but segmented at each floor vertically. Fresh air enters the cavity through the air vents located in the middle of the facade, while the exhaust air is drawn out at both ends of the cavity. The ventilation system for the office rooms is different from that of the cavity. Ducts in the façade cavity bring in fresh air for the office rooms. The stale air passes through air grills at the bottom of the doors and is then extracted through exhaust units in the corridor.
Figure 1. A typical floor plan of the EWI building and the location of studied rooms.
3.2. Climate
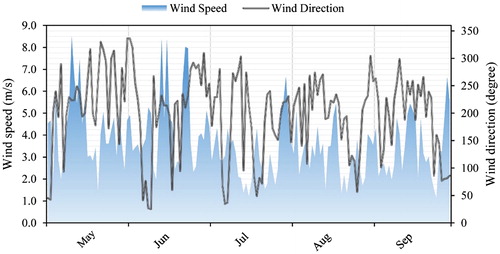
The EWI building is located in Delft, a city in the Netherlands with a temperate maritime climate (Latitude 51° 59′N and Longitude 4° 22′E). The climate of this region is influenced by the North Sea and the Atlantic Ocean; this results in a relatively small annual temperature range, considerable precipitation and occasionally high wind speeds. This climate generally features cool summers and mild winters (see ). Winds are omnidirectional but the predominant wind is south-west and the annual average wind speed is around 4.3 m/s. In fall and winter strong Atlantic low-pressure systems can bring strong winds which cause uncomfortable weather. However, the wind speed is lower during summer (). For this study, weather data were obtained from the nearby Royal Dutch Meteorological Institute (KNMI) weather station at Rotterdam-The Hague Airport (6.5 km south-east of the location). Since the energy consumption data measured were obtained in 2013, the weather data were also acquired from 2013.
Figure 2. Mean daily values of dry-bulb temperature and relative humidity at Rotterdam Airport in summer 2013 (KNMI).
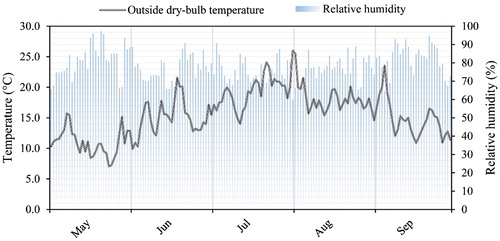
Figure 3. The daily wind speed and wind direction at Rotterdam Airport in summer 2013 (KNMI).
4. Methodology
This study is a follow-up of Raji, Tenpierik, & van den Dobbelsteen (Citation2016). In the first part, energy-saving measures such as glazing type, WWR and shading elements for the envelope design of high-rise office buildings in temperate climates were investigated with a special focus on cooling, heating and electric lighting. For this purpose, the EWI building was selected and the energy use prior to and after refurbishment was compared through computer simulations with DesignBuilder. The simulation model in DesignBuilder was validated using detailed metered energy data.
The follow-up study presented here aims at addressing the potential use of natural ventilation as a replacement strategy for mechanical ventilation systems by extending our investigation using the same validated base model from Raji, Tenpierik, & van den Dobbelsteen (Citation2016). For this purpose, six natural ventilation strategies were developed for the base case by changing the design parameters including the façade type (single layer façade versus double skin façade), the size of air inlets/outlets (the percentage of operable window area), and the application of vertical shafts (e.g. atrium and solar chimney). Through the application of different ventilation strategies, this research aims at addressing the following questions:
What is the percentage of the occupancy time in summer that natural ventilation can provide sufficient fresh air in the office rooms?
What is the percentage of the occupancy time in summer that natural ventilation can provide enough cooling to keep the indoor temperature in the office rooms within the comfort range?
Among the considered alternatives, which of the natural ventilation strategies can save the most energy?
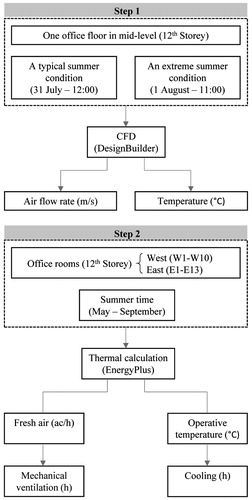
In this study, the investigation of natural ventilation (NV) strategies comprises of two main steps, as shown in . The objective of the first step is to predict the impact of different ventilation strategies on air flow patterns and temperature distribution in one office floor under two different weather conditions: a typical summer condition versus an extreme summer condition. In the second step, the energy-saving potential of the six NV strategies for ventilation and cooling will be analysed for all rooms facing east and west at a middle high floor (12th storey) in summer (May–Sep).
Figure 4. Methodological scheme of research.
4.1. Fresh air calculation
There are two approaches for modelling natural ventilation in DesignBuilder, i.e. scheduled and calculated. In this study, the natural ventilation model option is set to “calculated”. The calculated option allows for the calculation of natural ventilation based on opening and crack sizes, buoyancy and wind pressures. This will increase the complexity of the model and simulation run time, but it is the preferred option when designing a natural ventilation strategy. The EnergyPlus multi-zone airflow network model allows to identify multiple flow paths through the building, i.e. internal flows between spaces are taken into account. When the calculated natural ventilation option is selected, the EnergyPlus air flow network use wind pressure coefficients on each surface during the simulations. The solar radiation distribution is set to “full interior and exterior”. This option calculates the amount of beam radiation on each surface within the zone through the exterior windows, while also taking into account the effect of window shading devices.
For the operation of natural ventilation, a control mode was defined based on zone temperature. All the external openings can be opened if Tin>Tout and Tin>Tset and the operation schedule (occupancy hours 7:00–19:00) allows ventilation to occur. Here, Tset is the minimum indoor temperature for ventilation. In this study, 22 °C was selected for the Tset during the summer because the number of discomfort hours in office zone (and therefore the energy use) was increased slightly when selecting values higher or lower than 22 °C. When the zone temperature is lower than Tset, the building management system will automatically close the external windows to avoid unnecessary heat loss and draft during the cooler periods of the day (mostly early morning hours) in summer. For the proposed natural ventilation scenarios with a DSF, the internal windows are controlled entirely by schedule and are not affected by temperature controls. The building- and occupancy-related parameters with selected values used for the simulations are summarised in .
Table 1. Building and occupancy parameters and the proposed values for the simulation.
According to the Dutch building code (Bouwbesluit, Citation2011), the fresh air minimally required for light office work is around 6.5 l/s per person. Since all of the office rooms are identical and the occupancy rate is available, the minimum requirement concerning air changes per hour can be calculated with the following equation:
For the purpose of fresh air calculation, office rooms are assumed to be fully occupied (four persons/office room). Therefore, a total amount of 26 l/s of fresh air is needed to ventilate 110 m3 of the space. This means that each office requires a minimum of 0.85 ac/h to provide enough fresh air for the occupants. The total amount of fresh air changes per hour in all office rooms was simulated in EnergyPlus for the different ventilation strategies. The percentage of hours in which the ac/h was less than the minimum required value was obtained for all office rooms. In case of the meeting room (E13), it is supposed that the room volume and the occupancy rate increase by two and four respectively, as a result the minimum required fresh air would be higher compared to other office rooms.
4.2. Computational Fluid Dynamics (CFD)
The air flow rate and the temperature distribution in the building were simulated with the help of Computational Fluid Dynamics (CFD). In this study, the CFD code from DesignBuilder version 3.4 was employed. The most widely used and tested turbulence model, k-ɛ turbulence model, was selected among others that is belonged to the RANS family of models (Cheung & Liu, Citation2011; Nielsen, Citation1998; Ramponi & Blocken, Citation2012). The DesignBuilder’s CFD code has been validated by a number of studies through a comparison with measured data from existing buildings (Baharvand, Hamdan Bin Ahmad, Safikhani, & Binti Abdul Majid, Citation2013; Chung, Ahmad, Ossen, & Hamid, Citation2014) and also in comparison with the generated results from other CFD packages (Northumbria University, Citation2011). Using the CFD package in DesignBuilder simplifies the input of boundary conditions, since there is the possibility of using previously calculated quantities of temperatures, heat flows and flow rates from EnergyPlus. In this study, the number of outer iterations was initially set at 3000. This means that the calculations will terminate when the number of iterations reaches this value. In some cases when the solution has not converged, the number of iterations was gradually increased and the variation of the dependent variables was carefully monitored throughout the calculation in order to observe the point at which they finally stabilise. The CFD simulation results were taken as valid solution only when residual Root Mean Square Error (RMSE) values have reduced to 1E-5 and the selected dependent variable for the currently selected monitor cell reached a steady final value.
Grid size is an important factor in CFD simulations because the accuracy of the results depends highly on the grid definition (CitationGebreslassie, Tabor, & Belmont, 2012). The grid used by DesignBuilder is a non-uniform 3D Cartesian grid. It means that the grid lines are parallel with the main axes, and the grid regions (the distance between grid lines) enable non-uniformity. In this study, a grid sensitivity test was carried out. A diverse range of grid samples from extremely coarse (0.5 m) to very fine (0.1 m) were modelled for the computational domain (one floor at the mid-level) and air velocities were carefully monitored for different ventilation scenarios during a typical summer condition (31 July, 12:00). For the proposed model geometry, a grid structure couldn’t be generated with very fine grid size (0.1 m) because it requires a large amount of memory, especially when the model domain is remarkably large. The simulation results obtained for fine (0.2 m) and medium (0.3 m) grid samples were almost identical and the relative error of maximum air velocity was found to be less than 1%. However, the relative error increased to 3% and 8% for coarse (0.4 m) and very coarse (0.5 m) grid sizes respectively. According to the results, the medium grid size (0.3 m) is a good compromise between the fine and coarse grid sizes since it can satisfy the accuracy of solutions, while also avoid long calculation times. Therefore, in this study a grid spacing of 0.3 m with 0.03 m default grid line merge tolerance was defined for the computational domain. A 3D CFD grid was generated based on the key points from the model geometry along each of the major axes and the grid spacing and the grid line merge tolerance entered on the calculation option dialog. As a result, a 3D structure of grids consists a total number of 403848 cells (316 × 71 × 18) was made for the CFD experiments.
There is no dominant barrier in the proximity of the EWI building to block or reduce wind flows at the mid-height around this building. Therefore, the effect of wind flow is considered to be at its highest level (wind factor: 1). A default discharge coefficient of 0.65 is used for windows, doors and holes. DesignBuilder is supplied with a databases of wind pressure coefficients (Cp) from Liddament (Citation1986) which suits best for buildings of 3-storeys or less. However, for tall buildings (when height is more than three times the crosswind width), it is recommended to override this default data. Ideally, the specific pressure coefficient data should be obtained from wind tunnel measurements using scale models of the building (ASHRAE, Citation2005). However, wind tunnel testing is a very expensive and time-consuming method and therefore might not be applicable if the object that is being tested is too big. The wind pressure coefficients used in the present study were obtained from the experimental work of Davenport and Hui (Citation1982). They determined the local pressure coefficients of a tall rectangular high-rise building located in urban terrain. The data are given in 15° increments and for different points on the façade.
The CFD simulations were carried out for two distinct scenarios: a typical summer condition and an extreme summer condition (see ). The former (31 July, 12:00) represents a typical summer day with an outdoor air temperature of 22 °C and wind speed (4.5 m/s) coming from the prevalent direction (south-west). The performance of the NV strategies was also tested for an extreme weather condition (1 August, 11:00): a high temperature (29 °C) and a low wind speed (1.5 m/s). According to , a wind speed of 4–5 m/s from the south-west is most frequent during summer while for the minimum average wind speed (1–2 m/s), the north-east is the dominant direction.
Figure 5. Frequency distribution of wind speed and direction at Rotterdam Airport in the year 2013 (May–Sep) [20].
![Figure 5. Frequency distribution of wind speed and direction at Rotterdam Airport in the year 2013 (May–Sep) [20].](/cms/asset/63253f74-3cd4-4da5-828b-ec17c94bce62/tjov_a_1524210_f0005_c.jpg)
Table 2. The proposed weather scenarios for CFD simulations.
4.3. Comfort temperature calculation
The impact of ventilation strategies on the occupants’ thermal comfort during the summer (May-September) was assessed using the adaptive equations for comfort in free running buildings from the European standard (EN15251, Citation2007). In 2007, the European Committee for Standardisation (CEN) released the following equation for naturally ventilated buildings:
Where Trm7 is the exponentially weighted mean outdoor temperature for the last 7 days and is calculated with the following approximation:
A comfort temperature range was selected with 80% acceptability limits, which represents the category of normal expectancy for new buildings and renovations. These 80% acceptability limits introduce a boundary around the comfort temperature of ±3 °C.
4.4. Proposed natural ventilation strategies
Natural ventilation design can be separated into two aspects, the entry and exit of air through the envelope and the air movement within the internal spaces. The former phenomenon is influenced by the characteristic of the openings (air inlets and outlets) in the envelope design, whereas the latter is affected by the plan configuration, interior walls, grills and doors (resistance of the flow path) of the occupied space.
In this study six different ventilation scenarios were developed for the base case using single-sided, cross or stack ventilation or a combination of them. Detailed information for the six proposed ventilation strategies in line with their visual representations are provided in and , respectively. This study investigates the potential use of natural ventilation strategies to reduce the energy demand for cooling and mechanical ventilation for high-rise buildings during the summer in the temperate climates. The reference building has a double-skin facade (DSF) with one external vent per 28 meter (three vents each side; two at corners 2.00 × 3.75, and one in middle 4.00 × 0.90) for natural ventilation inside the cavity, but there is no internal operable window and therefore the building fully relies on fans and air-conditioning for providing comfort conditions (). For the reference design, small air grills (1.00 × 0.15) are embedded at the bottom of the doors so that the stale air can be extracted to the corridor. These air grills were kept unchanged in all ventilation strategies to have a better air circulation through the internal spaces.
Figure 6. Proposed ventilation strategies and the reference design. Arrows show the intended flow pattern within the ventilated spaces.
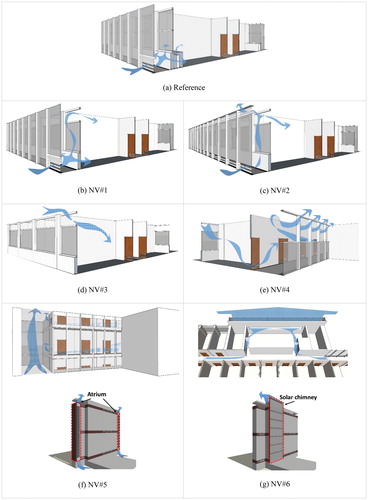
Table 3. Proposed natural ventilation strategies versus the reference design.
Among the six proposed ventilation strategies, two of them have a DSF and the other four have a single skin façade. For the first ventilation strategy (NV#1) fixed internal windows are changed to 30% operable while the external leaf has the same features as the reference building. The operable windows have a size of 3.6 × 2.7 m (W × L) and are located 1 m above the floor in the centre of the external wall. The position of the aperture of all operable windows (internal and external) is located on top and the aperture size is 30% of the total window area. The air flow opening is assumed to be a gap in the window. It means that 3 m2 of each window area can be opened for the purpose of ventilation through the top of the window. For NV#2 the size and number of external vents is increased by reducing the glazing area and adding horizontal air inlets (bottom) and outlets (top) along the entire east and west façade with a height of 45 cm ().
In order to change the façade type to a single skin, the internal leaf is moved 95 cm towards the outside so that the external layer is replaced without changing the window size (). Only the glazing type changed to improve the energy performance. As a result, the new single skin façade is characterised by a double-glazed low-e clear glass pane with a U-value of 1.49 (W/m2 K) and 58% solar transmittance (g-value). The main difference between NV#4 and NV#3 is the operation of external windows located in the corridor. For all ventilation scenarios, external windows in the corridor (located at both ends) are not operable except NV#4 that takes advantage of 50% operable windows in the corridor ().
For the last two natural ventilation scenarios, the potential of stack ventilation through the application of vertical shafts such as an atrium or a solar chimney is tested. In NV#5 two atria are added at the both ends of the corridor. Each atrium has a dimension of 4.7 × 9.6 m and it is extended vertically along the building height without any segmentation. The atria have access to external walls from three sides and the fourth side has connections with the corridor by an air vent at floor levels. The east and west walls are fully glazed but they are not operable. The air inlets and outlets are located on the lowest and highest floor of the building ().
The solar chimney (NV#6) employs a vertical shaft (1.4 × 24.6 × 83.2 m) with an exhaust vent at its top and is attached to the western external wall behind the service area. The shaft extends 6 m above roof level and the exhaust vents are facing towards east (against the predominant wind direction). The dimension of the air outlet is 5.0 × 24.2 m. In order to increase the thermal buoyancy within the solar chimney, the external leaf was fully-glazed with a single skin 6 mm clear glass pane and the interior leaf painted black (by using a dark surface layer) to absorb more radiation ().
The air paths between rooms and corridor is expected to be highly dependent on the type of natural ventilation strategy. For the reference design, the stale air passes through air grills at the bottom of the doors and is then extracted mechanically through exhaust units in the corridor. In NV#1, NV#2 and NV#3, a single-sided ventilation is expected. This means that the stale air is extracted through the opening on the same side it enters. In NV#4, NV#5 and NV#6, ventilation elements that are placed along the corridor of the building are expected to improve the flow rates and assist in drawing fresh air into and through the offices. The stale air passes through air grills at the bottom of the doors and is then extracted naturally through 50% operable windows in the corridor (located at both ends) or pulled up into a vertical shaft (atrium or solar chimney).
5. Results and discussion
5.1. Air flow patterns
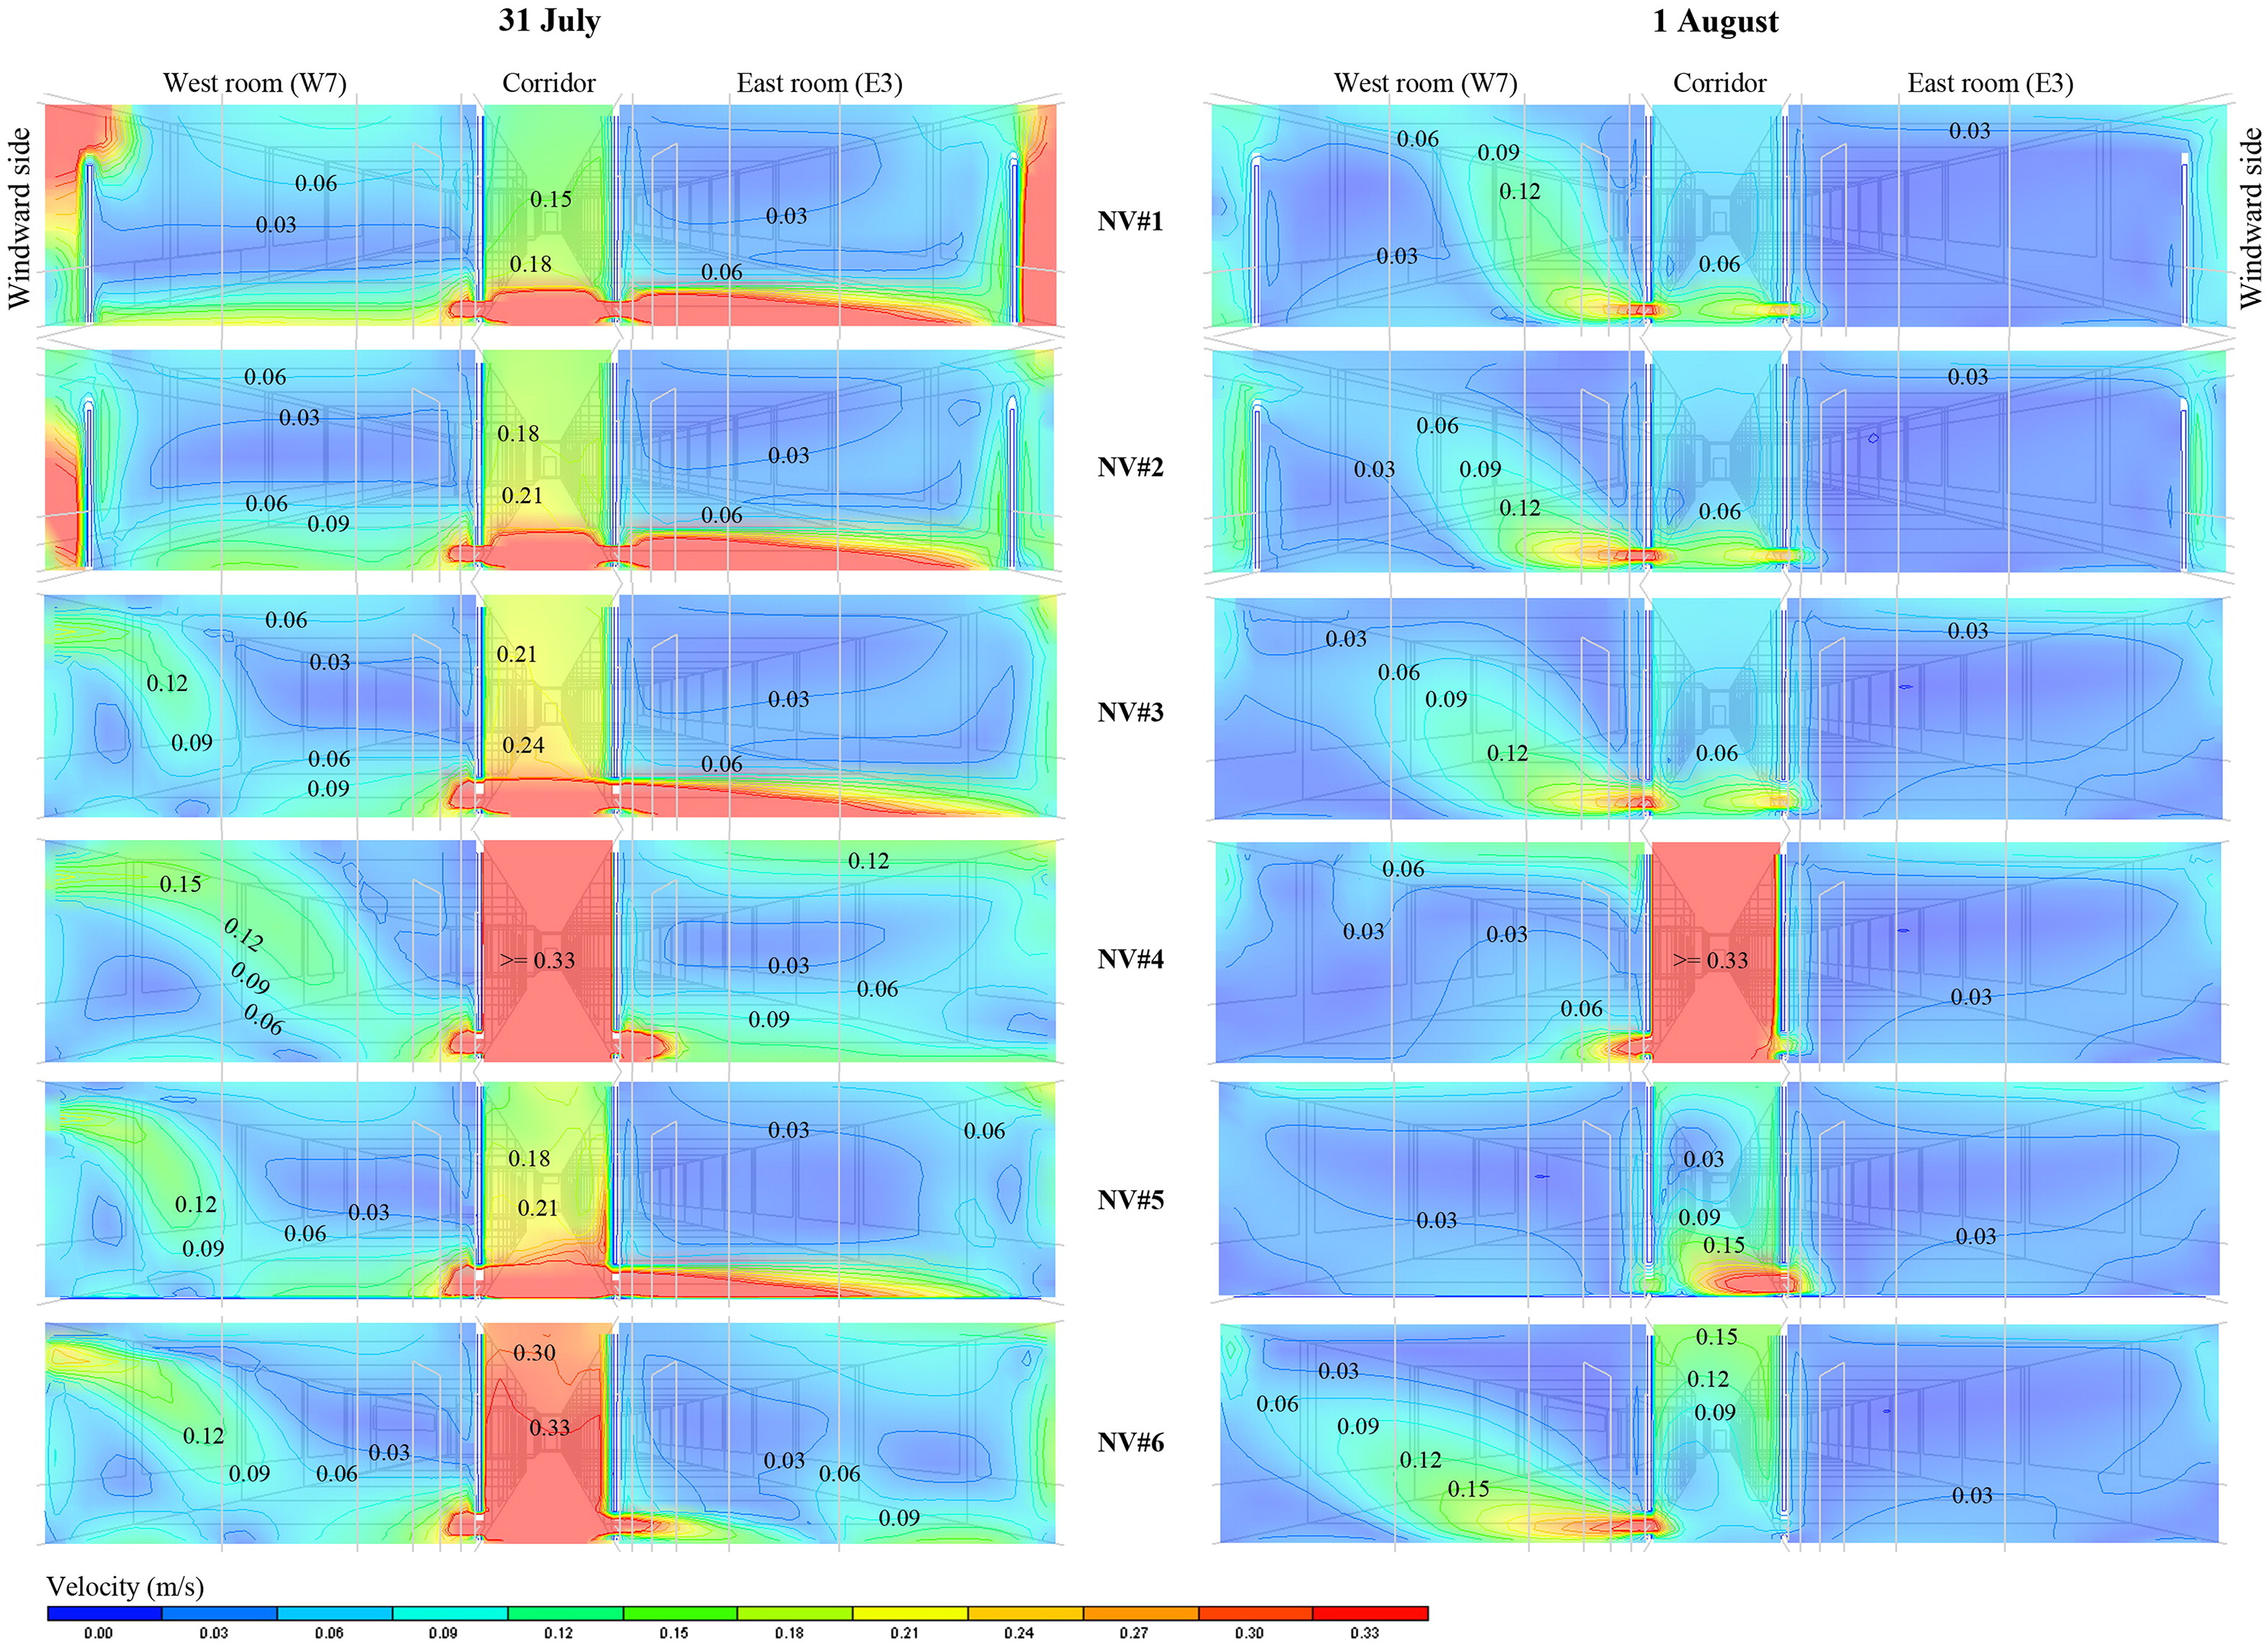
and show the air velocity contours and average air flow rate for different natural ventilation scenarios under two environmental conditions; a typical summer condition (31 July) and an extreme summer condition (1 August). The horizontal section of air velocity was taken approximately 1.2 m above the floor which could be seen as representative for the sitting position of office workers. Since the focus of this study is mainly on office rooms, the results of the CFD simulations for the service areas (staircases, plant rooms and sanitary spaces) were faded to avoid confusion. However, when they are used as part of the ventilation strategy as in the case of the atrium (NV#5) or the solar chimney (NV#6), the CFD results also cover those areas. Apart from the horizontal section, a vertical section of air velocity across the rooms W7 and E3 was taken to provide further information regarding the average wind speed and the air flow path across west-east rooms. The vertical section passes through the centre of the rooms as presented in Appendix 1.
Figure 7. The magnitude and direction of air flow through the plan for six ventilation strategies under wind speed of 4.5 m/s and outside air temperature of 22 °C (31 July, 12:00 pm).
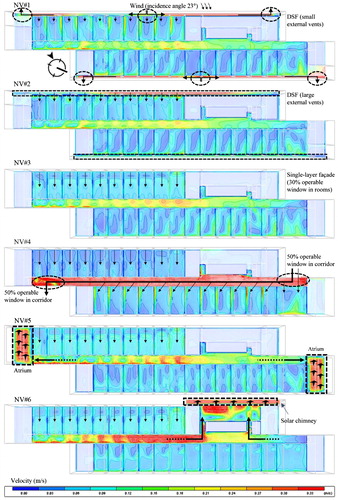
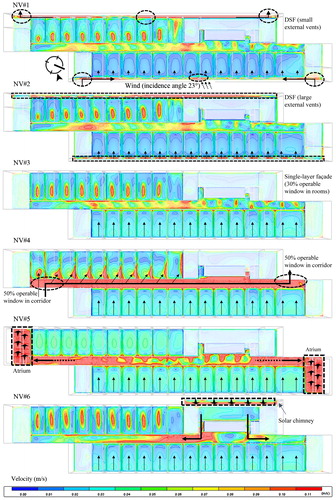
Figure 8. The magnitude and direction of air flow through the plan for six ventilation strategies under wind speed of 1.5 m/s and outside air temperature of 29 °C (1 August, 11:00 am).
Generally, in a typical summer condition, the average air velocity was higher for ventilation strategies that were applied to a single skin facade in comparison to a DSF. Although the building features a cellular plan layout, cross-ventilation for the rooms facing each other can occur through the air grills in the doors. This cross-ventilation is more likely to occur for higher wind speeds and for ventilation scenarios with a greater pressure difference between the rooms facing each other.
As can be seen in NV#1, the air velocity reduces considerably prior to entering the room. However, pressure differences between east and west rooms induce an air flow at floor level through the air grills in the doors.
In NV#2, increasing the size of air inlets and outlets for the external leaf lead to a reduction of areas of low wind speed for west-side rooms but its effect on east-side rooms was negligible.
Changing the façade type to a single skin (NV#3) lets the wind enter the rooms deeper from the windward side but again the influence on east rooms was not considerable due to the partition walls.
In NV#4, cross-ventilation inside the corridor was developed by changing the external windows of the corridor to 50% operable. The CFD results show that the cross-ventilation flow through the long corridor increases the average air velocity not only in corridor (up to 0.3 m/s) but also in the east-side rooms.
The influence of an atrium (NV#5) on air distribution and velocity was tested using the staircases at both ends of the corridor. The atria are designed here as a way to exhaust the stale air from offices to outside. This means the upward air flow in the atria is supposed to suck out the air from rooms into the corridor and from there, with the help of two air vents at the both ends of corridor, into the vertical shaft of atria. In practice, the two atria were not able to improve the air speed inside the corridor and rooms compared to the ventilation scenario without atrium (NV#3). Due to structural and architectural plan restrictions at the EWI building, the two atria have limited solar gain as windows are only in two directions (north and south). The solar heat gain in the atria, therefore, was not big enough to generate significant temperature variations between the ground floor and the top floor. As a result, the vertical shafts were not be able to induce the buoyancy driven ventilation and the atria space had a very low performance.
A solar chimney structure was proposed as strategy NV#6 in order to test its potential for natural ventilation. The stale air is drawn from the corridor into the service core and then through a large vent sucked out to the solar chimney. The air inlet for the chimney is 1.2 meters wide and 15.0 meters long and it is located 2.0 meter above the floor level in the service core. The CFD results show that under typical summer conditions the solar chimney performs as an air extraction system and can increase the air velocity inside the corridor and east room better than other ventilation strategies, except NV#4.
In case of extreme summer conditions (see ), the average air velocity for east-facing rooms were similar among ventilation strategies at a range of 0.03 m/s. For west-side rooms the highest air velocity was achieved by the application of a solar chimney. However, the CFD results for the extreme conditions show that a reverse flow exists in the chimney. The occurrence of the reverse flow results in a reduction of the air flow rate through the solar chimney and heat penetration into the building which is not desirable for ventilation (Khanal & Lei, Citation2012). Due to the high outdoor air temperature and excessive internal gains, the indoor air temperature near the inlet was higher than the backflow air temperature at the exit of the solar chimney system, and therefore the air goes downward in the chimney. Using operable windows inside the corridor (NV#4) can lead to a considerable increase of air velocity by up to 0.33 m/s within the corridor, even in low wind speed conditions (1.5 m/s). Among the 6 proposed ventilation strategies, the lowest air velocity was achieved by the application of atrium (NV#5), 0.03 m/s in western and eastern side rooms. Two openings (3.7 × 3.5 m) in the base and top of the atrium provides air flow (direct ventilation) into and along the atrium height (63 m). Direct ventilation of the atrium causes small temperature differences between internal and external spaces, so that bouncy-induced natural ventilation to be reduced. On the other hand, direct ventilation of the atrium interrupts the smooth flow of air through the connecting air grills between the corridor and the two atria.
5.2. Indoor air temperature
The air temperature distribution for the six natural ventilation strategies is presented in . In naturally ventilated buildings, the occupants’ perception of indoor thermal comfort depends largely on the outdoor air temperature variations. So if the indoor air temperature is within the comfort boundaries set by the adaptive thermal comfort model (Nicol et al., Citation2012), the ventilation strategy can be considered successful. Generally, the results show that the cellular offices that are located in the corners have higher indoor air temperatures compared to those located in the centre of the plan. That is the result of heat transmission from adjacent spaces that are not ventilated, such as plant rooms.
Figure 9. The air temperature on one floor for six ventilation strategies under two weather conditions; (a) wind speed of 4.5 m/s and outside air temperature of 22 °C (31 July, 12:00 pm), and (b) wind speed of 1.5 m/s and outside air temperature of 29 °C (1 August, 11:00 am).
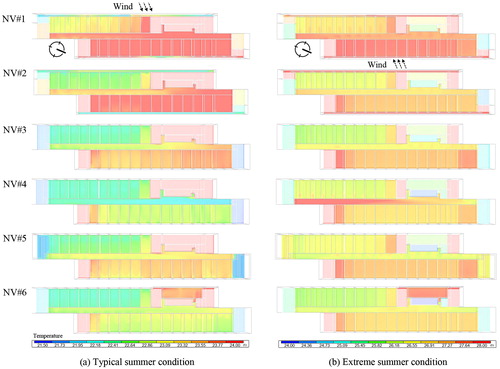
Since the CFD simulations were carried out for two snapshots around noon, it is expected that the east-facing offices have higher air temperatures than the west-facing offices because the first have received more solar radiation during the morning hours. The results also generally show a higher indoor air temperature for the natural ventilation strategies that were combined with a double skin façade (NV# 1 & NV#2). The internal configuration of the cavity in a DSF can influence the resistance of the air flow path, hence might increase the risk of overheating in summer if not ventilated adequately. Therefore, the design requires more consideration compared to conventional single skin façades. Increasing the vent size in NV#2, results in a reduction of the indoor air temperature by about 0.5 °C, with higher impact for rooms directly facing the wind.
For a typical summer condition when the outdoor air temperature is 22 °C and the dominant wind direction is south-west, three ventilation scenarios lead to a lower temperature for west-side rooms, i.e. NV#3, NV#4 and NV#6. In NV#4 due to higher ventilation rates, lower air temperatures are achieved inside the corridor and the east-facing rooms (see ). In a typical summer condition, the application of atrium (NV#5) resulted in slightly higher air temperature in the corridor and west-facing office rooms compared to NV#3 (single-sided ventilation). Therefore; there is no noticeable enhancement of air flows with the application of two peripheral atria in this case.
5.3. Indoor comfort
Thermal comfort and fresh air are among the main indoor comfort indicators. Using natural driving forces, comfort conditions can be improved to a different extent depending on the design and local weather conditions. Six ventilation strategies were simulated for different office rooms in the EnergyPlus calculation core of DesignBuilder. The amount of discomfort hours during the occupancy time in summer determines the number of hours that active cooling or mechanical ventilation is necessary to provide comfort conditions in the office rooms. A lower number of discomfort hours means that the ventilation strategy performs better; hence save more energy.
5.3.1. Fresh air changes
The percentage of hours in which the ac/h was less than the minimum required value (0.85) was obtained for all office rooms, as shown in . This graph shows the percentage of time during office hours (7:00–19:00) in which natural ventilation alone cannot meet the minimum requirement for fresh air and, therefore, supplementary mechanical ventilation is needed. This has two reasons. Either, the natural ventilation control mode does not allow the window to be opened (e.g. if Tout> Tin or Tin<Tset) or the window is open but the required fresh air cannot be generated due to undesirable wind direction (perpendicular to building sides with no opening) and/or too low wind speed.
Figure 10. The percentage of hours when natural ventilation is not enough to provide the minimum fresh air in office rooms for six ventilation strategies in summer (May–September, 2013).
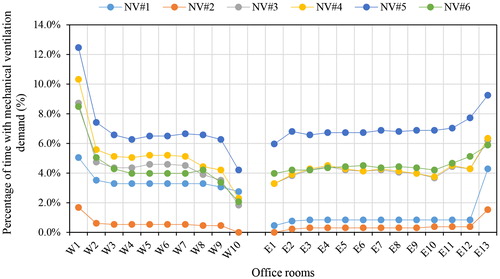
The simulation results for ventilation strategies are quite promising. For all natural ventilation strategies, the need for mechanical ventilation reduced to less than 8% of the occupancy hours in western and eastern side rooms, except for two rooms that are located in the corners (W1 & E13). The lowest demand for mechanical ventilation achieved by natural ventilation strategy with a double skin façade and larger external vents (NV#2). The use of DSF regulates pressure distribution across the envelope and helps the air flow to be distributed more evenly on different rooms. Additionally, a DSF acts as a thermal buffer. Solar gain in the double-skin cavity can serve to preheat fresh air before it enters the rooms during the cooler periods of the day (mostly early morning hours) in summer. As a result, office rooms can benefit from natural ventilation for a longer period. However, careful consideration should be given to the design of a DSF. If the cavity is not sufficiently ventilated or shaded, the rooms can experience discomfort conditions (e.g. overheating).
As shown in , the average percentage of discomfort hours (when mechanical ventilation is necessary) is almost equal for eastern and western side rooms among all ventilations strategies, except for NV#1. In NV#1, the configuration of the external vents is the same as the reference design. The fresh air is brought in from the centre of the façade and sucked out at the ends of the cavity’s corridor. The result shows that west-facing rooms need more mechanical ventilation compared to east-facing rooms in order to provide the minimum fresh air requirements in office rooms in summer. This means that the design of external vents (position and sizing) in NV#1 is not as effective as NV#2 in providing proper pressure distribution within the natural ventilation system.
The ventilation strategy with an atrium (NV#5) shows the highest demand for mechanical ventilation. The first reason is related to the efficiency of the proposed atria in extreme summer conditions which has the lowest air velocity in east- and west-facing rooms (as can be seen in Appendix 1) and therefore the minimum average number of air changes per hour among the six ventilation scenarios. Additionally, in order to provide natural ventilation for a longer period inside the building and to reduce the cooling demand, the minimum indoor temperature (Tset) for ventilation was set at 18 °C for the atrium which will allow the fresh air to circulate when the indoor temperature inside the atrium is equal to or above 18 °C. As a result, the temperature within the corridor reduces while the minimum ventilation set-point temperature in rooms is defined at 22 °C similar to other ventilation strategies. In case of a reverse flow in the atria, it is more probable for the temperature inside the office rooms to drop below the Tset and therefore, the windows inside the office rooms to be closed by control systems to avoid uncomfortable conditions.
All of the ventilation scenarios with a single skin façade (NV# 3–6) show slightly higher demand for mechanical ventilation. Generally, the use of a single skin façade, as opposed to a double skin façade, allows fresh air to enter the building with minimal obstructions, so that the internal air temperature might drop below the Tset more often due to a higher number of air changes per hour. To avoid uncomfortable conditions, the BMS automatically closes ventilation openings on the external façade and activates mechanical ventilation system.
The results show that the percentage of discomfort hours might vary according to the location of rooms. It is higher for the rooms located in the corners compared to rooms with a more central positioning. These differences are more distinguishable for natural ventilation strategies that are being provided through a single skin façade. Among them, natural ventilation solutions using a solar chimney (NV#6) or 30% external operable windows (NV#3) were providing the required fresh air for the longest period, respectively for the west and east offices in summer. Adding operable windows in the corridor (NV#4) to NV#3 has no significant influence on the east rooms but increases the percentage of time that the west rooms need mechanical ventilation.
5.3.2. Comfort temperature
The average percentage of thermal comfort hours for six ventilation strategies in east and west rooms during the summer months (May-September) is presented in . According to the simulation results, during the hot periods in summer such as in July big differences exist in the percentage of comfort hours among the ventilation solutions for single skin façades and double skin façades. But when the outdoor air temperature is lower, the results get closer.
Figure 11. The average percentage thermal comfort hours for six ventilation strategies during the summer months in: (a) west rooms W1-W10, and (b) east rooms E1-E13.
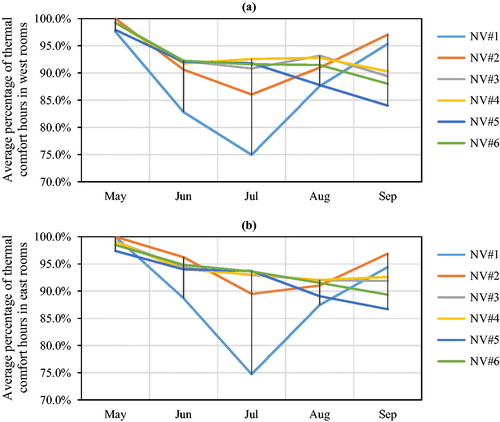
The results of show that the number of cooling hours is considerably higher in NV#1 (double skin façade with limited external vents) since the vents are not able to remove the excessive heat from the cavity and part of it will be transferred into the rooms and increases the operative temperature inside the offices; hence, leading to the lowest amount of comfort hours during the hot periods (about 75% in July). Improving the size of external vents in the double skin façade in NV#2 minimizes the risk of overheating, so that the number of comfort hours is higher than in NV#1. During the cooler periods, the fresh air is preheated by solar gains in the cavity of the double skin façade before it enters the occupied office spaces. The results show that the average room air temperature is slightly higher in NV#2 compared to other ventilation strategies with a single skin façade; differences are higher in September (1 °C) and smaller in May (0.5 °C). As a result, the number of comfort hours in NV#2 is highest among the ventilation strategies in May and September (and June for east rooms).
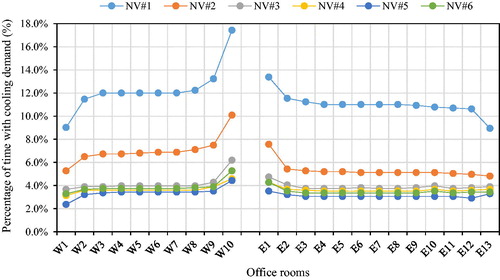
Figure 12. The percentage of hours when active cooling is necessary to provide thermal comfort in office rooms for six ventilation strategies in summer (May–September, 2013).
Although the total number of comfort hours are quite close for ventilation scenarios with single skin façade, single-sided ventilation combined with cross ventilation through the corridor (NV#4) shows the highest number of comfort hours for office rooms among the strategies. Using an atrium (NV#5) provides the lowest cooling demand however not the highest comfort. Here, the reason for having low cooling demand is because the low-performance atrium was not able to ventilate the rooms during the extreme conditions as much as other scenarios and therefore cool indoor air was not replaced with warm outdoor air.
5.4. Energy saving
Average operative temperatures obtained in west and east rooms for the six ventilation strategies were compared with the comfort temperatures and surrounding limits from the European standard EN15251. The cellular offices that are in direct contact with unventilated spaces such as staircase or plant room have higher indoor air temperatures compared to those located at some distance from the corners. Therefore, the average results for cellular offices that are located in the corners (W1, W10, E1 and E13) were excluded from the comparison. The percentage of hours when the operative temperature in the rooms during occupation was higher than the upper limit for indoor thermal comfort was calculated for the summer months (May-September). During this time, the rooms need active cooling in order to maintain a comfortable indoor temperature. In case of the reference design with air-conditioning system, the percentage of hours when the room air temperature was higher than the adjusted cooling set point temperature (24 °C) was calculated when the system is shut off. illustrates the percentage of occupancy hours during summer in which the rooms need active cooling.
Table 4. The percentage of occupancy hours in which active cooling is necessary to provide thermal comfort for office rooms located in the western (W2-W9) and eastern (E2-E12) side of the building (May–September, 2013).
Due to high internal gains and a low performative cavity (of the DSF) that is not ventilated properly, the reference buildings needs cooling during almost the entire summer (97–98%) when the building is open. According to , the cooling hours can drop from 98% to 12% by introducing NV through the internal operable windows (30%) while keeping the envelope design the same as the reference building. Generally, NV strategies were able to reduce the cooling demand effectively and approximately within the same range (to only 3–7% of active cooling required), except for NV#1. However, reducing the cooling demand does not necessarily mean that the rooms will also be thermally comfortable, specifically when looking at the percentage of comfort hours for the ventilation scenarios with an atrium design (NV#3). The percentage of comfort hours were between 91 and 93% for NV#3 in the representative rooms. The other percentage of time (4–6%) it would be cooler than the comfort range. Other single skin ventilation strategies provided thermal comfort for the proposed rooms between 93 and 95% of the time. An atrium design resulted in higher percentage of comfort hours than that in NV#1 (88–89%), but less than that in NV#2 (93–95%).
6. Conclusion
In this paper, the potential use of natural ventilation strategies to reduce the energy demand for cooling and mechanical ventilation was investigated. Six natural ventilation strategies were developed for a 21-storey office building and EnergyPlus combined with the CFD code in DesignBuilder were employed for the purpose of investigation. The study consists of two steps. The air flow rate and the temperature distribution of one floor at mid-level (12th storey) were simulated with the help of Computational Fluid Dynamics (CFD). The CFD simulations were carried out for two distinct temperature and air velocity scenarios in order to predict how they work under different summer conditions. In the second part, the potential of different NV strategies to reduce the energy need for cooling and mechanical ventilation were compared.
Natural ventilation strategies can provide thermal comfort and fresh air for up to 90% of the occupancy time in summer and therefore can save energy that is generally needed for the operation of traditional mechanical ventilation and air-conditioning systems. Most of the ventilation strategies had almost the same performance except those that were combined with a poorly ventilated double skin façade and the natural ventilation with atrium design.
The double skin façade of the investigated building can easily get too warm or too cold. Therefore, in order to take the most advantage of it, it is necessary to control the operation of vents with the help of a building management system (BMS). Additionally, the minimum temperature set-point for natural ventilation is a major factor for the operation of windows and the thermal comfort within the ventilated space and therefore it should be carefully adjusted according to outdoor temperature variations.
Despite the positive evidence from literature for utilising vertical shafts, our findings showed that natural ventilation strategies that employed stack ventilation by using an atria or solar chimneys had no extra advantages compared to other wind-driven scenarios, considering the air velocity rate or thermal comfort conditions in office rooms. Here two important issues should be emphasised. In this case the building studied features a narrow plan and it is located in a city with high average wind speed throughout the year. As a result, even using simple ventilation methods could achieve the required air changes for reducing the need for mechanical ventilation and cooling. However, stack ventilation has most benefits for buildings with a deep plan when cross ventilation can hardly occur. Furthermore, the configuration of a vertical shaft should be in such a way to provide the temperature variations required to induce buoyancy driven ventilation and to distribute the air flows equally for different floors. Finally, in climates where the wind speed is low and omnidirectional, using vertical shafts might perform better than other ventilation scenarios (single-sided or cross ventilation) since the driving force for the ventilation is not the wind.
Improving or adding natural ventilation strategies to existing buildings are different from new buildings due to the limitations associated with the structure and the architectural plan configuration. For some natural ventilation scenarios, more specifically in case of the atrium design, the performance might be affected under the influence of these design limitations (e.g. size and position of atria). However, the aim of this paper was to study the possible ventilation solutions while having the minimum interference in the existing building’s fabric. Moreover, the schedule for the operation of windows were set in accordance with the safety regulations to the occupancy schedule (7:00–19:00). Application of a summer nigh-time ventilation might extend the comfort conditions even to a higher percentage which needs to be investigated when there is no limitation for opening the windows. However, for high-rise buildings it is rarely possible to merely rely on natural ventilation throughout the operating year (Wood & Salib, Citation2013). It is important to have a supplementary mechanical ventilation system that can be activated when the external conditions are not optimal for using natural ventilation (due to temperature, noise or wind) or in case of design failures (due to changes in architectural design layout or in tenancy patterns). Therefore, a hybrid ventilation system is a way of reducing the risk when natural ventilation may be perceived to be inadequate.
There are some limitations and uncertainties associated with energy simulation tools. One of the uncertainties of this study is related to applied wind pressure coefficient and discharge coefficient values for the calculation of wind-induced pressure and the prediction of airflow through the openings. The wind pressure coefficient is a function of building geometry and site characteristics. Therefore, the specific pressure coefficient data is better to be obtained from wind tunnel measurements. However, this is a very expensive and time-consuming method and therefore might not be applicable if the object that is being tested is too big. Furthermore, the discharge coefficient is a function of window characteristics (window angle and aspect ratio) and the flow direction. In this study, a default discharge coefficient of 0.65 is used for windows and holes. Using a constant value might lead to some degree of inaccuracy for the prediction of air flow rates.
The DesignBuilder’s CFD code has limitations in defining graphically the air flows through the cracks; however, porous flows can be calculated in EnergyPlus. Therefore, importing the air flows from EnergyPlus that include the crack leakage can cause serious flow imbalance problems (DesignBuilder, Citation2016). To avoid this problem the effect of infiltration is excluded from air flow calculations. Furthermore, for summertime simulations the effect of infiltration would be insignificant as compared to flow rates from the vents, holes and open windows.
In this study, natural ventilation is operated by automated windows. It means that natural ventilation is possible when the room temperature is within the predefined temperature set points and the offices are occupied. Therefore, the whole office uses only one threshold to trigger opening and closing actions. To make the model appears like a real situation for window operation, future studies can introduce different set points for opening and closing to include the occupant’s interaction with windows.
Disclosure statement
No potential conflict of interest was reported by the authors.
References
- Acred, A., & Hunt, G. R. (2014). Stack ventilation in multi-storey atrium buildings: A dimensionless design approach. Building and Environment, 72, 44–52. doi:10.1016/j.buildenv.2013.10.007 Retrieved from http://www.sciencedirect.com/science/article/pii/S0360132313002989
- ASHRAE. (2005). Capter 16: Airflow around buildings: American Society of Heating, Refrigerating and Air-Conditioning Engineers.
- Baharvand, M., Hamdan Bin Ahmad, M., Safikhani, T., & Binti Abdul Majid, R. (2013). DesignBuilder verification and validation for indoor natural ventilation. Journal of Basic and Applied Scientific Research, 3(4), 182–189.
- Bouwbesluit. (2011). Energieprestatie van gebouwen – Bepalingsmethode NEN 7120.
- Cheung, J. O. P., & Liu, C.-H. (2011). CFD simulations of natural ventilation behaviour in high-rise buildings in regular and staggered arrangements at various spacings. Energy and Buildings, 43(5), 1149–1158. doi:10.1016/j.enbuild.2010.11.024. Retrieved from http://www.sciencedirect.com/science/article/pii/S0378778810004548
- Chung, L. P., Ahmad, M. H. B. H., Ossen, D. R., & Hamid, M. H. (2014). Application of CFD in prediction of indoor building thermal performance as an effective pre-design tool towards sustainability. World Applied Sciences Journal, 30, 269–279. doi: 10.5829/idosi.wasj.2014.30.icmrp.35
- Davenport, A. G., & Hui, H. Y. L. (1982). External and internal wind pressures on cladding of buildings, report of the boundary layer wind tunnel laboratory. London, ON: University of Western Ontario.
- DesignBuilder. (2016) DesignBuilder EnergyPlus Simulation Documentation. Retrieved from http://www.designbuilder.co.uk.
- Ding, W., Hasemi, Y., & Yamada, T. (2005). Natural ventilation performance of a double-skin façade with a solar chimney. Energy and Buildings, 37(4), 411–418. doi:10.1016/j.enbuild.2004.08.002 Retrieved from http://www.sciencedirect.com/science/article/pii/S0378778804002452
- EN15251. (2007). Indoor environmental input parameters for design and assessment of energy performance of buildings addressing indoor air quality, thermal environment, lighting and acoustics. Brussels: CEN.
- Etheridge, D. (2012). Natural ventilation of buildings theory, measurement and design. Chichester, West Sussex, UK: John Wiley & Sons.
- Etheridge, D. W. (2010). Ventilation, air quality and airtightness in buildings. In M. R. Hall (Ed.), Materials for Energy Efficiency and Thermal Comfort in Buildings (pp. 77–100): Woodhead Publishing Series in Energy.
- Gebreslassie, M. G., Tabor, G. R., & Belmont, M. R. (2012). CFD simulations for sensitivity analysis of different parameters to the wake characteristics of tidal turbine. Open Journal of Fluid Dynamics 02 (03), 9. doi: 10.4236/ojfd.2012.23006. Retrieved from http://www.scirp.org/journal/PaperInformation.aspx?PaperID=22536
- Holford, J. M., & Hunt, G. R. (2003). Fundamental atrium design for natural ventilation. Building and Environment, 38(3), 409–426. doi:10.1016/S0360-1323(02)00019-7. Retrieved from http://www.sciencedirect.com/science/article/pii/S0360132302000197
- Khanal, R., & Lei, C. (2011). Solar chimney—A passive strategy for natural ventilation. Energy and Buildings, 43(8), 1811–1819. doi:10.1016/j.enbuild.2011.03.035. Retrieved from http://www.sciencedirect.com/science/article/pii/S0378778811001447
- Khanal, R., & Lei, C. (2012). Flow reversal effects on buoyancy induced air flow in a solar chimney. Solar Energy, 86(9), 2783–2794. doi:10.1016/j.solener.2012.06.015. Retrieved from http://www.sciencedirect.com/science/article/pii/S0038092X12002277
- KNMI. Retrieved Date Accessed, 2015 from http://www.knmi.nl/home.
- Liddament, M. W. (1986). Air Infiltration Calculation Techniques: An Applications Guide: Air Infiltration and Ventilation Centre.
- Liping, W., & Hien, W. N. (2007). The impacts of ventilation strategies and facade on indoor thermal environment for naturally ventilated residential buildings in Singapore. Building and Environment, 42(12), 4006–4015. doi:10.1016/j.buildenv.2006.06.027 Retrieved from http://www.sciencedirect.com/science/article/pii/S0360132306003714
- Liu, P.-C., Lin, H.-T., & Chou, J.-H. (2009). Evaluation of buoyancy-driven ventilation in atrium buildings using computational fluid dynamics and reduced-scale air model. Building and Environment, 44(9), 1970–1979. doi:10.1016/j.buildenv.2009.01.013 Retrieved from http://www.sciencedirect.com/science/article/pii/S0360132309000213
- Moosavi, L., Mahyuddin, N., Ab Ghafar, N., & Azzam Ismail, M. (2014). Thermal performance of atria: An overview of natural ventilation effective designs. Renewable and Sustainable Energy Reviews, 34, 654–670. doi:10.1016/j.rser.2014.02.035. Retrieved from http://www.sciencedirect.com/science/article/pii/S1364032114001567
- Nicol, F., Humphreys, M., & Roaf, S. (2012). Adaptive Thermal Comfort Principles and Practice. Hoboken: Taylor & Francis.
- Nielsen, P. V. (1998). The selection of turbulence models for prediction of room airflow. ASHRAE Transactions, 104(Part 1B), 1119–1127.
- Northumbria University. (2011). An Inter-program Analysis of Computational Fluid Dynamics Based on PHOENICS and DesignBuilder Software. School of Built and Natural Environment. Retrieved from http://www.designbuilder.co.uk/version5/download/documents/31-designbuilder-cfd-validation-against-pheonics
- Prajongsan, P., & Sharples, S. (2012). Enhancing natural ventilation, thermal comfort and energy savings in high-rise residential buildings in Bangkok through the use of ventilation shafts. Building and Environment, 50, 104–113. doi:10.1016/j.buildenv.2011.10.020 Retrieved from http://www.sciencedirect.com/science/article/pii/S0360132311003696
- Priyadarsini, R., Cheong, K. W., & Wong, N. H. (2004). Enhancement of natural ventilation in high-rise residential buildings using stack system. Energy and Buildings, 36(1), 61–71. doi:10.1016/S0378-7788(03)00076-8 Retrieved from http://www.sciencedirect.com/science/article/pii/S0378778803000768
- Raji, B., Tenpierik, M. J., & van den Dobbelsteen, A. (2016). An assessment of energy-saving solutions for the envelope design of high-rise buildings in temperate climates: A case study in the Netherlands. Energy and Buildings, 124, 210–221. doi: 10.1016/j.enbuild.2015.10.049
- Raji, B., Tenpierik, M., & van den Dobbelsteen, A. (2017). Early-stage design considerations for the energy-efficiency of high-rise office buildings. Sustainability, 9(4), 623. Retrieved from http://www.mdpi.com/2071-1050/9/4/623
- Ramponi, R., & Blocken, B. (2012). CFD simulation of cross-ventilation for a generic isolated building: Impact of computational parameters. Building and Environment, 53, 34–48. doi:10.1016/j.buildenv.2012.01.004 Retrieved from http://www.sciencedirect.com/science/article/pii/S0360132312000133
- Rossi, A., & Wolf, M. (2016). Update on U.S. Fan Energy-Efficiency Regulation. Accessed, 5 July 2017. Retrieved from http://www.hpac.com/iaq-ventilation/update-us-fan-energy-efficiency-regulation.
- Shafiei Fini, A., & Moosavi, A. (2016). Effects of “wall angularity of atrium” on “buildings natural ventilation and thermal performance” and CFD model. Energy and Buildings, 121, 265–283. doi:10.1016/j.enbuild.2015.12.054. Retrieved from http://www.sciencedirect.com/science/article/pii/S0378778815304904
- Wood, A., & Salib, R. (2013). Natural ventilation in high-rise office buildings New York: Routledge.
Appendix 1: A vertical section of air velocity across the rooms W7-E3.