
 ?Mathematical formulae have been encoded as MathML and are displayed in this HTML version using MathJax in order to improve their display. Uncheck the box to turn MathJax off. This feature requires Javascript. Click on a formula to zoom.
Abstract
Enthalpy exchangers recovering sensible and latent heat have an increasing share of use in residential ventilation. In this study, we introduce an optimization approach for membrane-based enthalpy exchanger (MEE). Therefore, we develop a system model, combine it with a genetic optimization algorithm and optimize the design regarding energy demand and comfort. The methodology proves promising as its application to a residential building system indicates less permeable (2.68 × 10⁻¹⁰ mol m−1 s−1 Pa–1) and thicker membranes (75 µm) are used for moderate climates compared to cold and dry climates (2.91 × 10⁻¹⁰ mol m−1 s−1 Pa–1, 20 µm).
Introduction
Rising air tightness of the building stock leads to an increased necessity for mechanical ventilation in residential buildings. The use of energy recovery systems like heat exchangers or enthalpy exchangers has been established in practical applications of residential ventilation in the past decades. Typically, residential ventilation units inherit sensible heat recovery with air-to-air heat exchangers, but membrane-based enthalpy exchangers (MEEs) have been also widely discussed in the literature. The increased interest is due to the dual utilization of the enthalpy exchanger for simultaneous, passive temperature and humidity treatment of the air. Hence, during winter seasons the MEE can heat and humidify the fresh air, and during summer it can cool and dehumidify the air. The simultaneous temperature and humidity treatment can increase indoor air thermal comfort and save energy, especially in cold and dry or warm and humid climates, if active dehumidfication is used as well. However, in moderate climates, the outdoor air provides sufficient moisture content in transitional periods. Hence, enthalpy exchangers have to be bypassed to avoid high indoor air humidity. Since heat and moisture transfer are conjugated in membrane-based enthalpy exchangers, this leads to a decrease of recovered sensible heat as well. Consequently, the research question arises regarding how efficient moisture transfer in an enthalpy exchanger should be to provide a healthy and comfortable indoor air environment with minimum energy demand.
In the past decades, much research has been done on MEEs. The research studies can be divided into four different categories: investigations on the performance of MEE under varying boundary conditions, investigation on different membrane materials for MEE, enhancement in flow structures of MEE, and optimization of MEE.
Different studies address the analysis of the impact of the operation conditions on the effectiveness of MEE (Albdoor et al., Citation2020; Al-Waked et al., Citation2015; Koester et al., Citation2017; Min & Su, Citation2010, Citation2011; Niu & Zhang, Citation2001; Shakir Nasif & Al-Waked, Citation2014; Siegele & Ochs, Citation2019; Zhang & Niu, Citation2002; Zhang et al., Citation2008). They all found that sensible and latent effectiveness increase with decreasing volume flow rate, face velocity or Reynolds number. The Reynolds number linked to volume flow rate or face velocity influences the latent effectiveness stronger than sensible effectiveness according to their results. Moreover, some studies address the influence of outdoor and indoor air states on the MEE’s performance. Niu and Zhang (Citation2001) develop a mathematical model and show that the inlet humidity influences the latent effectiveness for materials with a non-linear sorption curve whereas the influence on materials with linear sorption curve is insignificant. Moreover, they show that the inlet temperature influences the latent effectiveness independent from the membrane material. Zhang et al. (Citation2008), Min and Su (Citation2011), Lee et al. (Citation2013), Koester et al. (Citation2017), Al-Waked and Nasif (Citation2019), and Siegele and Ochs (Citation2019) prove the dependence on the membrane material through experimental or simulative studies. In their experimental results and simulative studies, a performance dependency on the temperature and humidity conditions becomes visible for some membrane materials, whereas other membrane materials show no dependency. Albdoor et al. (Citation2022) show that the MEE’s performance depends on the outdoor humidity for warm and humid conditions but is independent for cold and dry conditions. It is hard to compare the results since different membrane materials are used. In total, all studies demonstrate that the influence of the temperature and humidity conditions depends on the membrane material and the heat and mass transfer direction.
As the membrane material influences the MEE’s performance, some studies examine new membrane materials for MEE applications. Niu and Zhang (Citation2001), Zhang et al. (Citation2008), Min and Su (Citation2010), Shakir Nasif (Citation2015), Koester et al. (Citation2016), Al-Waked and Nasif (Citation2019) and Sotokawa et al. (Citation2021) indicate that the membrane material influences MEE’s latent effectiveness, whereas the sensible effectiveness changes only slightly. Therefore, improving the MEE’s performance is linked to the choice of membrane material.
Next to membrane materials, researchers have investigated the optimization of MEEs through geometric design. One approach is the increase of the counter-flow share in the MEE (Al-Waked et al., Citation2015; Nasif et al., Citation2010, Citation2013). Another approach uses spacers or similar geometric elements to break up the boundary layer and, therefore, increase the convective heat and mass transfer (Koester et al., Citation2016). Although these spacers can increase the sensible and latent effectiveness, they also increase the pressure drop of the MEE, leading to a higher electric energy demand for the fans. Other approaches use plate-fin structures or cross-corrugated ducts to increase the MEE performance (Zhang, Citation2012).
Based on the research regarding the MEE performance depending on membrane material and geometric design, some researchers have developed methods to optimize the MEE’s design. To improve the sensible and latent effectiveness, Albdoor et al. minimize the entropy generation of MEE using a genetic algorithm (GA) varying different design parameters of the MEE (Albdoor et al., Citation2020). By optimizing mass flow rates through the MEE, length and width of the MEE, channel height, membrane thickness, thermal conductivity and the membrane material’s diffusion coefficient, they reduce the entropy generation by 20%–30%. This optimum leads to increased sensible and latent effectiveness as well. However, optimizing the mass flow rates can lead to insufficient air exchange in the building when allowing small mass flow rates. Albdoor et al. propose an optimum with small mass flow rates (40% of the baseline design). They do not provide information on the application of the MEE. Hence, the optimal mass flow rates might be sufficient for ventilation, but reasonable limitations should be implemented if considering the mass flow rate as a parameter for optimization. Zhang optimizes the MEE design considering the uncertainty of parameters (e.g. production tolerance) via a reliability-based approach (Zhang, Citation2016). The objective used is the economic return of the MEE. His results indicate the parallel-plate MEE with asymmetric polymer membranes as the optimal solution for the investigated data set. Moreover, his results prove a degradation of the MEE’s performance with uncertain geometric parameters compared to the exact parameters. Adamski optimizes a spiral recuperator regarding length and diameter using the economic payback period as an objective (Adamski, Citation2006). After developing a model based on experimental data (Adamski, Citation2009) he analyzes the influence of the energy carrier on the payback period (Adamski, Citation2017). Men et al. use a particle swarm algorithm to optimize the design of MEE (Men et al., Citation2021). They combine the objectives of Albdoor et al. (Citation2020) and Zhang (Citation2016) for a multi-objective approach, minimizing the entropy generation and maximizing the economic return. The study presents a data set of Pareto-optimal design parameters that can be weighted based on the entropy generation and economic return since the two objectives are counter-active.
The literature overview shows the widely investigated MEE performance considering boundary conditions and design parameters. Some researchers have started optimizing MEE design to improve performance. All these studies have in common that they focus on the MEE itself without considering the influence on the holistic system consisting of the building, heating and cooling supply and ventilation. Moreover, many researchers focus on warm and humid or cold and dry climates where MEEs are most beneficial. However, in moderate climates, outdoor air humidity is sufficient for building ventilation during spring and autumn to keep a comfortable indoor air humidity without any humidification or dehumidification. During these operation periods, sensible heat recovery would be beneficial. Nevertheless, MEE can improve the indoor air humidity during the winter season for these climates, if controlled properly. Therefore, optimizing MEE design needs to capture the interaction of the MEE with the building and its energy system. In this study, we propose an approach for optimizing the MEE design considering the interactions with the building’s energy demand and the indoor air comfort.
Methodology
We develop a dynamic model of an MEE for optimization and combine it with a system model of the building energy system. The system model is embedded in an optimization framework using a genetic optimization algorithm varying the MEE’s parameters.
Model of the membrane-based enthalpy exchanger
For modeling and simulation, we use the object-orientated language Modelica in combination with the software Dymola (Version 2022). We use the media model of moist air implemented in the AixLib (Maier et al., Citation2023).
The model has been developed in a previous study and consists of three sub-models (Kremer et al., Citation2019). Two sub-models represent the two air channel flows adjacent to each side of a single membrane. The third sub-model describes the membrane’s physics in terms of the heat conduction and heat capacity in the membrane itself as well as the sorption of water vapor at the membrane’s surface and the water vapor diffusion through the membrane.
The sub-models are discretized in flow direction. Thus, a counter-current arrangement can be implemented directly in the top-layer model by connecting the heat and mass transfer connectors in the opposite direction for the two air channel flow models. shows the schematic model structure of a counter-current enthalpy exchanger. The throttling symbols labeled with the reciprocal value of the local heat () and mass (
) transfer coefficients define the resistance regarding the convective heat and mass transfer. A minimum of two discrete volumes in the axial direction is necessary to provide a counter-current arrangement.
Figure 1. Model structure of a counter-current enthalpy exchanger.
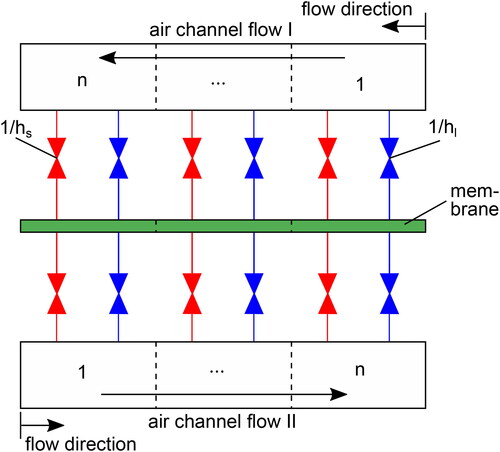
The structure presented in represents one single membrane with two adjacent air channel flows. To model the total MEE, the heat and mass flow rates are multiplied by the amount of parallel membranes in the exchanger. We assume heat and mass transfer to be equal throughout the enthalpy exchanger, thus allowing the periodic approach. In this way, we can reduce the size and complexity of the model to the shown structure.
Modelling the air channel flow
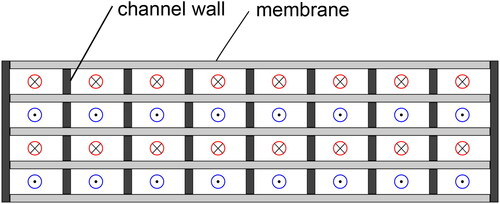
An MEE consists of parallel-arranged rectangular air channels. The air channels are separated by the membranes and their supportive layer. To stabilize the membrane package, webs perpendicular to the membrane surface are inserted into the air channel. The webs lead to multiple rectangular individual channels, as shown in .
Figure 2. Schematic construction of a membrane enthalpy exchanger.
Muzychka and Yovanovich provide a Nusselt correlation for laminar flow in non-circular channels (see EquationEquation (1)(1)
(1) ), which can be used in the case of an MEE to model the convective heat transfer coefficient (Muzychka & Yovanovich, Citation2004).
(1)
(1)
EquationEquation 1(1)
(1) yields the Nusselt number
for the dimensionless channel length
(Muzychka & Yovanovich, Citation2004). The index
refers to the square root of the cross-section of the rectangular channel being the characteristic length used to calculate the Reynolds number.
With the definition of the Nusselt number in EquationEquation (2)(2)
(2) , the convective heat transfer coefficient
is calculated. Using this coefficient, the convective heat flow from the airflow to the membrane’s surface is determined (see EquationEquation (3)
(3)
(3) ).
(2)
(2)
(3)
(3)
The convective mass transfer is derived from the analogy between heat and mass transfer. Thus, we use the Nusselt number to calculate the Sherwood number (EquationEquation (4)(4)
(4) ) with the Chilton-Colburn analogy (Niu & Zhang, Citation2001). The Lewis number is calculated according to EquationEquation (5)
(5)
(5) (Siegele & Ochs, Citation2019).
(4)
(4)
(5)
(5)
With the definition of the Sherwood number (see EquationEquation (6)(6)
(6) ), the convective mass transfer can be determined with the difference of the mass fractions in the airflow (feed or permeate)
and at the surface (feed or permeate)
(see EquationEquation (7)
(7)
(7) ).
(6)
(6)
(7)
(7)
The resulting energy and mass balances in the control volumes of the air channel (EquationEquations (8)(8)
(8) and Equation(9)
(9)
(9) ) are:
(8)
(8)
(9)
(9)
Modelling the membrane
The membrane conducts the heat and can store the heat, leading to the following energy balance for the membrane control volume (see EquationEquations (10)–(12)):
(10)
(10)
(11)
(11)
(12)
(12)
For the mass balance in the membrane, we assume that the membrane’s storage capacity of water vapor can be neglected due to its low thickness (between 20 and 150 μm in practical applications). This leads to the mass balance presented in EquationEquation (13)(13)
(13) . The mass transfer processes inside the membrane are more complicated than the heat transfer processes. The water vapor is adsorbed at one surface, diffuses through the membrane and is desorbed at the other surface again. We use the solution-diffusion model that summarizes the sorption and diffusion process, providing a single parameter, the permeability P, for the mass transfer through the membrane. The permeability is derived from the sorption coefficient S and the diffusion coefficient D (see EquationEquation (14)
(14)
(14) ). This leads to the mass flow rate of water vapor through the membrane presented in EquationEquation (15)
(15)
(15) (Wijmans & Baker, Citation1995).
(13)
(13)
(14)
(14)
(15)
(15)
Modelling the adsorption heat
During the adsorption of water vapor on the membrane’s surface adsorption heat is released. Since the adsorption heat is released at the membrane’s surface, we do not add it to the energy balance of the air channel model or the membrane model. Instead, we add the adsorption heat to the heat transfer connector between the two submodels. The heat transfer connector sums up all heat flows in and out. Since the heat transfer connectors of the air channel model and the membrane model are connected, the sum of heat flows is defined as in EquationEquation (16)
(16)
(16) .
(16)
(16)
(17)
(17)
The adsorption enthalpy is multiplied by the mass flow rate of the water vapor
in the energy balance. If the water vapor is adsorbed at the surface (
), heat is added to the heat port and vice versa for desorption.
Optimization methodology
We combine the simulation model with the optimization algorithm programmed in Python through the Dymola-API of the Python package ebcpy (Wüllhorst et al., Citation2022). A genetic algorithm provided by the package PyGAD (Gad, Citation2023) is used for optimization with the parameters listed in . The gene ranges will be explained below where we give more detailed information on the geometric parameters used for optimization. For detailed information on the optimization algorithm, we refer to Gad (Citation2023). The optimization algorithm calls a fitness function inheriting the Dymola-API that carries out an annual simulation of the system model and throws back the weighted objectives. The algorithm uses the results to create the next generation of parameter sets. This process is iterated until the defined number of generations (see ) is reached.
Table 1. Parameters used for the genetic algorithm.
Objectives
We choose two objectives for our optimization. As the first objective, we use the total use energy demand of all components. Therefore, the heating power, cooling power and electric power of the fans are integrated during the annual simulation and summed up. The GA aims to minimize the total use energy demand in kWh a−1. The second objective is the violation of comfortable indoor air humidity. As violations of the comfortable indoor air humidity occur dynamically during the annual operation, we define a KPI to quantify the violations. We use the Integral Absolute Error () which is well known in the field of control engineering as the basis for our KPI. The KPI is shown in EquationEquation (18)
(18)
(18) . Whenever the relative humidity
in the building overshoots the higher limit
or undershoots the lower limit
the difference will be integrated over the time the violation occurs leading to an integral value in %-h. Typical international standards define a range between 30 and 65% relative humidity (rH) for indoor air environments (ASHRAE Citation2023; German Institute for Standardisation, Citation2022).
(18)
(18)
To find an optimal solution, we weight the two objectives equally.
Enthalpy exchanger parameters for optimization
Many geometric parameters can be varied to optimize the system performance. Some of these influence both the latent and sensible effectiveness of the MEE and others mainly influence the latent effectiveness. In this study, we choose the membrane’s thickness and permeability and the spacing between the membranes as parameters. To keep the overall exchanger size constant, the spacing is directly linked to the number of parallel membranes in the exchanger. Therefore, we vary the number of parallel membranes and calculate the spacing between the membranes depending on the exchanger’s depth, which is kept constant. We thus ensure that the genetic algorithm only uses integer values for the number of membranes. The range for the number of membranes is 60 to 460, leading to a membrane spacing between 1 mm and 7 mm. Choosing higher values for the number of membranes yields in small spacing and too high pressure drops. According to Albdoor et al., typical polymer membranes’ permeability varies between 1 × 10–13 and 1 × 10⁻¹⁰ mol m−1 s−1 Pa–1 (Albdoor et al., Citation2022). Paper membranes usually have higher permeabilities. Hence, we choose a range between 1 × 10–13 and 3 × 10⁻¹⁰ mol m−1 s−1 Pa–1. The membrane thickness is limited between 20 µm and 200 µm. Lower values lead to problems in mechanical stability.
System model
We combine the MEE model with a dynamic building energy system model, as shown in . The model consists of a thermal zone model (Lauster & Constantin, Citation2017) equipped with heating and cooling devices and a residential ventilation unit model. The ventilation unit model consists of a preheater model, the MEE model and two fan models. The preheater is used to avoid frost formation in the MEE by controlling the inlet temperature to −5 °C. Rafatinasr (Rafatinasr, Citation2016) has shown that frosting can be avoided in MEE, if the temperature is higher than −5 °C for relative indoor air humidities lower than 50%. The controller model controls all actuators in the system that are the preheater power, the MEE bypass, the fans’ power and the set value for the internal heater and cooler. The weather model provides the outdoor air conditions for the ventilation unit and the thermal zone.
Figure 3. Structure of the building energy system model.
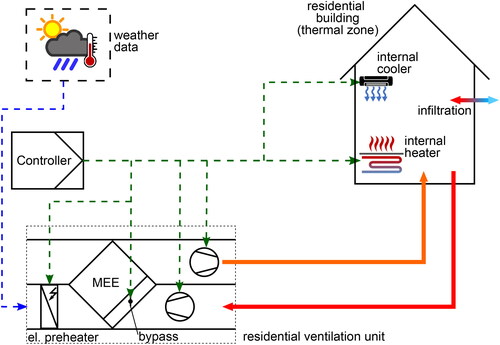
The thermal zone model represents the building structure. The building structure is parametrized using the Tool TEASER (Remmen et al., Citation2018). The tool delivers typical elements according to the year of construction and translates the building structure into a thermal network (resistance-capacity-model). In this study, we choose 2015 as the year of construction and a net area of 120 m2, obtaining the data from the TABULA database (Loga et al., Citation2012). We consider an infiltration of 0.06/h in the thermal zone model but assume no window ventilation in addition to the mechanical ventilation. To avoid overheating during summer, the thermal zone inherits an idealized shading model that reduces the solar radiation through transparent facade elements to 20% if the irradiation on the surface is higher than 200 W m−2. The thermal zone model inherits an idealized internal heating and cooling model to control indoor air temperature. These models simplify the behavior of heating devices such as radiators or underfloor heating or cooling devices by just providing a heat flow rate (positive for heating and negative for cooling) to the thermal zone’s air volume. The internal cooling model does not consider any condensate formation and therefore provides sensible cooling only. Internal loads such as persons, machines and light are modeled according to SIA 2024 (Schweizer Ingenieur- und Architektenverein, Citation2024), considering latent heat production of persons and other sources (e.g. plants and showers).
All in all, the building energy system modeled inherits the functionality of energy recovery, heating, and cooling. No active humidification or dehumidification is applied in this study. Therefore, indoor air temperature is fully controllable, but indoor air humidity control is limited to energy recovery. As no dehumidification is applied, the absolute indoor air humidity is always equal to or higher than the absolute outdoor air humidity due to internal gains. This setup is only applicable for dry climates that are analyzed in this study. Humid climates would need active dehumidification.
Control model
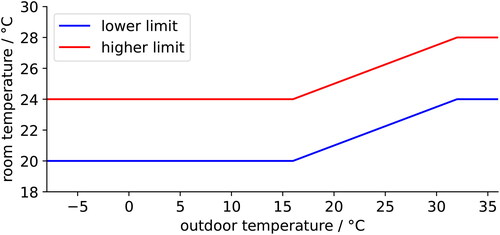
We develop a controller model for the residential ventilation unit to control the fans and the bypass over the MEE to avoid too high indoor air humidities and energy waste for additional heating and cooling. Moreover, the controller sets the cooling and heating power for the internal devices. The set point temperature for heating and cooling is derived from the German standard DIN EN 16798-1 (German Institute for Standardisation, Citation2022) (see ). We use the lower limit for a comfortable room temperature as the set point for heating and the higher limit as the set point for cooling. Since no dehumidification is considered in the simulation model, the humidity will not decrease in the building model. Hence, we use the higher limit (65% relative humidity) of comfortable indoor air humidity to control the bypass over the MEE. If the indoor air humidity exceeds the limit, the bypass will open, reducing the latent and sensible heat recovered. All set points are controlled using models of PID-controller.
Figure 4. Set points for indoor air temperature depending on outdoor temperature according to (German Institute for Standardisation, Citation2022).
Investigated scenarios
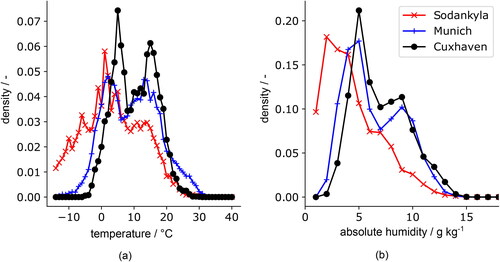
We carry out the optimization for three different locations in Europe - Sodankyla, Munich and Cuxhaven. Sodankyla, a city in Lapland (Finland), can be classified as a cold and dry climate with a temperature median of 1.4 °C and a humidity median of 3.37 g kg−1. The German city of Munich has a moderate continental climate (median temperature: 8.9 °C, median humidity: 5.27 g kg−1). Cuxhaven, on the contrary, has a moderate and more humid climate (median temperature: 9.8 °C, median humidity: 6.01 g kg−1) since it is a city located near the German coast. shows the density functions of temperature and humidity for the three locations based on historical (test reference year) weather data. The x-axes show the temperature and absolute humidity, respectively. The y-axes show the density of how often an interval occurs during the year. We use intervals of 1 K and 1 g kg−1 to calculate the densities. In Sodankyla, temperatures below 0 °C occur more often than in the German cities. Additionally, low absolute humidities occur more frequently. In Cuxhaven, temperatures between 5 and 20 °C have higher density than in Munich, whereas in Munich higher temperatures between 20 and 30 °C occur more often. Regarding humidity, both German cities have a similar density function, but absolute humidities between 5 and 10 g kg−1 have higher density in Cuxhaven. This interval is relevant for the operation of the MEE. Since these absolute humidities are sufficient for an indoor air environment, no humidification is needed when outdoor air humidity lies in the interval. In consequence, MEE cannot provide any benefit regarding comfort. Especially for outdoor air with absolute humidities between 8 and 10 g kg−1, the risk of reaching too humid indoor air if operating an MEE is high. Therefore, the difference in optimization results between Munich and Cuxhaven will be interesting to investigate.
Figure 5. Density function of temperature (a) and humidity (b) at the three investigated locations.
Results
Sensitivity analysis
In the first step, we carry out a simulative sensitivity analysis to quantify the parameters to be optimized impact on the MEE’s performance. We quantify the performance using the sensible and latent effectiveness
defined as follows (Niu & Zhang, Citation2001):
(19)
(19)
(20)
(20)
The base configuration of the MEE is given in . We use manufacturer data (Polybloc CV-2-31-0462-22) (polybloc AG. Winpoly, Citation2024) for the geometric parameters designing the MEE for the nominal volume flow in the simulation setup. Starting from this configuration, we vary the parameter values independently.
Table 2. Base configuration of MEE for sensitivity analysis.
presents the influence of the membrane thickness, permeability and spacing between the membranes on the MEE’s sensible and latent effectiveness as indicated by the simulation model. It is visible that the membrane thickness and permeability have a high impact on the latent effectiveness but do not significantly influence the sensible effectiveness. Since membranes in typical MEEs are thin, their thermal resistance is low, leading to nearly no effect on the heat transfer process. The membrane properties significantly influence the mass transfer process of water vapor as the membrane’s moisture resistance is higher than the convective resistance. The spacing between the membranes influences both the latent and sensible effectiveness. It is directly linked to the number of membranes as described in Section 2.2. In consequence, with decreasing spacing, the number of membranes increases, leading to an increased total transfer area in the MEE. The increased transfer area leads to higher heat and mass transfer. Moreover, the membrane spacing influences the characteristic length for the convecitve heat and mass transfer. Therefore, the convective transfer coefficients increase as the Nusselt/Sherwood number is nearly constant due to constant air flow velocity. For mass transfer, the diffusion process in the membrane is dominating. Therefore, the change in the convective mass transfer coefficient has less impact on the total mass transfer. Consequently, the influence of the spacing is lower on the latent compared to the sensible effectiveness. The convective heat transfer reduction caused by higher distances between the membranes has a higher impact on the total heat transfer compared to the total mass transfer as the membrane’s thermal resistance is low compared to the diffusion resistance.
Figure 6. Influence of membrane thickness, permeability and spacing between membranes on the MEE’s effectiveness.
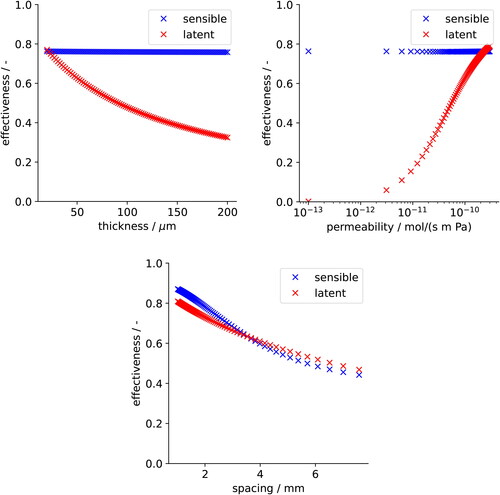
In total, two optimization parameters chosen in this study mainly influence the latent effectiveness, whereas one parameter will influence sensible and latent effectiveness. Using the three parameters provides the possibility to design heat and mass transfer in the MEE as needed for the application.
Optimization results
The optimization is carried out for the simulation setup, varying the three parameters introduced before for three different climatic boundary conditions. visualizes the solutions of the optimization algorithm. Each data point represents one combination of membrane thickness, permeability and membrane spacing. The corresponding total use energy demand is plotted above in %-h. For each climatic condition, an almost horizontal front for the minimum energy demand is observable while the
varies over a wide range. Hence, the results indicate the impact on energy demand is low compared to the impact on indoor air humidity. The solutions found with higher total energy demand are linked to higher values for the membrane spacing. With increasing spacing between the membranes, the sensible and latent effectiveness decreases (see ), leading to higher demands in the heating and cooling components of the energy system. On the other hand, the energy demand for the fans is decreasing with higher spacing values. However, the decrease in energy demand for the fans does not cope with the increasing energy demand for heating and cooling. shows the comparison between the found optimal solution by the genetic algorithm and the base configuatione as depicted in . As can be seen, the genetic algorithm finds solutions with lower heating demand but significantly higher use energy demand for the fans. For Sodankyla, the fan power at nominal volume flow increases due to higher pressure drops over the MEE from 43 W in the base config to 167 W in the optimized configuration. Since we optimize the use energy demand, the electric energy demand for the fans and the heating energy demand are treated equally by the genetic algorithm in this study. shows that the cooling demand is low compared to the heating demand. This is due to the usage of shading during summer time.
Figure 7. All solutions simulated by the optimization algorithm. (a) Sodankyla, (b) Cuxhaven, (c) Munich.
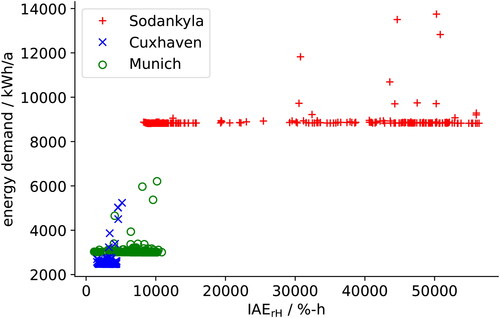
Table 3. Comparison between the MEE’s base configuration (see ) and its weighted optimum.
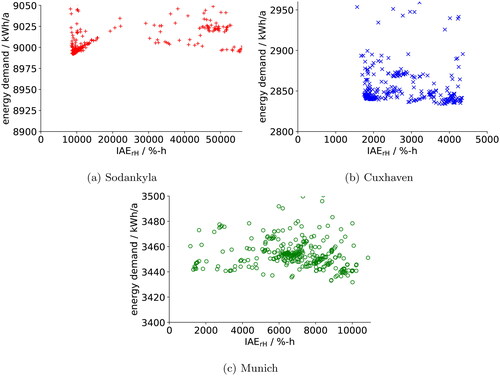
For a more detailed analysis, shows the solutions with the lowest energy demand seperately for the three climates. illustrates that the differences in the total use energy demand are small with a maximum of 100 kW h a−1 for the solutions near to the optimum found by the genetic algorithm. Especially for climates such as Sodankyla, the percentual impact on the energy demand is insignificant. For Cuxhaven and Munich, a small increase in the energy demand is visible for decreasing values. The percentual increase in energy demand is significantly lower (1%–4%) than the decrease of the
values (174%–766%) In consequence, the solutions focussed by the genetic algorithm are identical with the lowest
values.
Figure 8. Zoomed results for optimal solutions and the three locations.
presents the optimal solutions found by the optimization algorithm for all three climatic conditions. The first row of each climatic condition lists the weighted optimum. Moreover, we list the solutions with the lowest energy demand and the lowest value found by the algorithm as well. It has to be noticed that the solutions for the objectives energy and
might not be the optimal solutions regarding a single objective optimization as we did not optimize the energy demand or the
value directly. The results show that the optimization algorithm chooses lower values for the spacing between the membranes near the minimum range limit. For colder and dryer climates, such as Munich and Sodankyla, thinner membranes (20 - 30 µm) with higher permeability are chosen, leading to higher latent effectiveness (see ). For moderate climates with higher outdoor air humidity, the optimization algorithm chooses thicker membranes (75 µm) compared to Munich (31 µm) or Sodankyla (20 µm). The solutions with the lowest energy demand indicate that thicker or less permeable membranes lead to lower energy demand.
Table 4. Weighted optimal solutions for the MEE design and the solutions with the lowest energy demand and value.
Discussion
We have introduced an optimization approach for MEE in the context of the building energy system and applied it to a residential building at different European locations. The results indicate that the optimization in the context of residential ventilation is mainly driven by the comfort violation regarding the indoor air humidity. As no active humidification and dehumidification are provided in this study, the MEE’s design has a high impact on keeping the indoor air humidity in comfortable ranges. For cold and dry climates such as Sodankyla, thin and highly permeable membranes lead to the lowest comfort violations since they lead to high latent effectiveness and in consequence effective passive humidification during winter seasons. With increasing outdoor air humidity, the optimization algorithm chooses thicker and less permeable membranes compared to Sodankyla, leading to lower latent effectiveness. Especially for moderate climates such as Cuxhaven, the outdoor air humidity during transitional seasons lies in the comfortable range for the indoor air at 20 °C. Consequently, high latent effectiveness will increase the risk of exceeding the higher limit of comfortable indoor air humidity. The bypass over the MEE has to open more often, leading to less sensible heat recovery as well. However, lower latent effectiveness leads to lower indoor air humidity during winter. Therefore, the optimization algorithm finds a compromise between the energy demand and indoor air comfort. The results for Cuxhaven show that the genetic algorithm does not choose the highest value for the membrane thickness and the lowest value for the membrane permability. The chosen values indicate the usage of a sensible heat recovery would lead to worse results regarding indoor air comfort. However, the energy demand could be decreased with sensible heat recovery as the results indicate that the solution with the lowest energy demand for Cuxhaven lies for less permeable membranes resulting in lower latent effectiveness.
The optimal solution is dependent on the weights chosen. In this study, we choose equal weights for the energy demand and the It has to be noted that the units are not equal for both objectives which implicates an unequal weighting by nature of the two objectives. Choosing higher weights for the energy demand than for the
will lead to an MEE design with lower latent effectiveness and vice versa.
The optimization results show that lower values for the membrane spacing are beneficial. Since lower membrane spacing leads to a higher number of membranes and, therefore, to a higher total heat and mass transfer area, the sensible and latent effectiveness is increased. The increased transfer area evokes lower energy demands for heating and cooling but higher energy demands for the fans. For cold climates such as Sodankyla, the benefit of reduced heating demand due to low membrane spacing is higher than the increase in energy demand for the fans. For moderate climates such as Cuxhaven, the results indicate that an increase in the membrane distance is more beneficial. Since the total energy demand for heating is significantly lower, the advantage of reducing the heating demand with low membrane spacing decreases. Hence, the increased energy demand for the fans will exceed the reduced energy demand for heating. Therefore, the optimization algorithm chooses slightly higher values for membrane spacing.
However, our application of the optimization approach does not consider the mechanical constraints in MEE regarding the pressure drop. Reducing the membrane spacing to 1 mm leads to a pressure drop of about 250 Pa in the model. A high pressure difference between the two air sides of the MEE can cause the membranes to contact each other or even damage the membranes. So, limiting the MEE’s pressure drop to ensure a secure operation is reasonable. MEE manufacturers specify a limit of 250 Pa for the MEE to avoid mechanical damage on the MEE (polybloc AG. Winpoly, Citation2024). Hence, the low values of membrane spacing are at the edge of operation limits and higher values should be chosen to ensure safe operation. Moreover, such high pressure drops are conflicting with European standards for ventilation regarding the energy demand of fans. Hence, limiting the pressure drop is part of future work.
In this study, we focus on the use energy demand without considering the energy supply systems, leading to equal weighting of the different energy demands like heating and fans. Considering the energy supply will influence the MEE design regarding the energy demand. For example, an efficient heat supply like a heat pump will reduce the percentage of heat demand in the total final energy demand so that the increased energy demand of the fans becomes more relevant and the optimum design can tend towards higher membrane spacing accordingly. Moreover, an efficient energy supply can reduce the influence of the MEE design on the energy demand, leading to an even more increased impact of the on the optimal MEE design.
Conclusion
We have presented a method to optimize the design of MEE in the context of a building energy system and applied it to a residential building with a typical ventilation unit consisting of a pre-heater and an MEE. The application of the methodology yields to optimization results indicating that optimizing MEE towards higher sensible and latent effectiveness can have a negative impact on the use energy demand of the holistic system. On the contrary, thinner and more permeable membranes lead to fewer violations of comfortable indoor air humidity in cold and dry climates, if no active humidification is used. Therefore, the approach presented is promising for optimizing the design of MEE for optimal operation of the overall system.
The influence of the MEE’s design on the energy demand is not significant for the investigated use case of a residential building and boundary conditions. With lower insulation standards or active humidification, it might increase. Consequently, the optimal MEE design with equal weights on energy demand and comfort violation is located near the minimum comfort violation. Our study focuses on the use energy demand of the building and ventilation unit. Efficient heat and cold supply can further decrease the significance of the energy demand for MEE design optimization.
In future work, limitations regarding the maximum pressure drop and considerations reagarding the energy supply systems need to be implemented leading to a more comprehensive optimization. Moreover, we want to address different building types, including humidification and dehumidification and investigate locations with warm and humid climate conditions. Transforming the continuous variation of the permeability to discrete values of existing membrane materials is part of further work. Our KPI definition for comfortable humidity addresses only linear dependency on the humidity difference and time. For example, the risk of mould growth depends strongly on the duration of excessive humidity in the room as well as on the value of the relative humidity. Hence, the KPI definition does not provide information on the influence on human beings. This should be addressed in further studies.
Disclosure statement
The authors declare no conflict of interest. The funders had no role in the design of the study; in the collection, analyses, or interpretation of data; in the writing of the manuscript; or in the decision to publish the results.
Data availability statement
All models used are published in the open-source library AixLib (https://github.com/RWTH-EBC/AixLib). The data that support the findings of this study are available from the corresponding author, Martin Kremer, upon reasonable request.
Additional information
Funding
Notes on contributors
Martin Kremer
Martin Kremer, M. Sc., RWTH Aachen University, is research associate and team leader of the team Ventilation Systems at the Institute for Energy Efficient Buildings and Indoor Climate.
Kai Rewitz
Kai Rewitz, Phd, RWTH Aachen University, is chief engineer and team leader of the team Occupant Behavior and Comfort at the Insitute for Energy Efficient Buildings and Indoor Climate.
Dirk Müller
Dirk Müller, Phd, Professor, RWTH Aachen University, is Head of the Institute for Energy Efficient Buildings and Indoor Climate and Vice Dean of the Faculty of Mechanical Engineering at the RWTH Aachen University.
References
- Adamski, M. (2006). Longitudinal spiral recuperators in ventilation systems of healthy buildings. Healthy Buildings, 2006.
- Adamski, M. (2009). Heat transfer correlations and NTU number for the longitudinal flow spiral recuperators. Applied Thermal Engineering, 29(2-3), 591–596. https://doi.org/10.1016/j.applthermaleng.2008.03.029
- Adamski, M. (2017). Mini longitudinal flow spiral recuperator. Healthy Buildings Europe, 2017.
- Albdoor, A. K., Ma, Z., & Cooper, P. (2020). Experimental investigation and performance evaluation of a mixed-flow air to air membrane enthalpy exchanger with different configurations. Applied Thermal Engineering, 166, 114682. https://doi.org/10.1016/j.applthermaleng.2019.114682
- Albdoor, A. K., Ma, Z., Al-Ghazzawi, F., & Arıcı, M. (2022). Study on recent progress and advances in air-to-air membrane enthalpy exchangers: Materials selection, performance improvement, design optimisation and effects of operating conditions. Renewable and Sustainable Energy Reviews, 156, 111941. https://doi.org/10.1016/j.rser.2021.111941
- Albdoor, A. K., Ma, Z., Al-Ghazzawi, F., Liu, J., & Awan, M. B. (2022). Experimental and numerical investigation of the operating performance of air-to-air membrane enthalpy exchangers. Sustainable Energy Technologies and Assessments, 49, 101722. https://doi.org/10.1016/j.seta.2021.101722
- Albdoor, A. K., Ma, Z., Cooper, P., Ren, H., & Al-Ghazzawi, F. (2020). Thermodynamic analysis and design optimisation of a cross flow air to air membrane enthalpy exchanger. Energy, 202, 117691. https://doi.org/10.1016/j.energy.2020.117691
- Al-Waked, R. F., & Nasif, M. S. (2019). Air to air energy recovery from HVAC systems under different membrane materials. Universal Journal of Mechanical Engineering, 7(2), 37–49. https://doi.org/10.13189/ujme.2019.070202
- Al-Waked, R., Nasif, M. S., Morrison, G., & Behnia, M. (2015). Cfd simulation of air to air enthalpy heat exchanger: Variable membrane moisture resistance. Applied Thermal Engineering, 84, 301–309. https://doi.org/10.1016/j.applthermaleng.2015.03.067
- ASHRAE. (2023). ASHRAE handbook – 2023 HVAC systems and equipment. American Society of Heating, Refrigerating and Air-Conditioning Engineers.
- Gad, A. F. (2023). Pygad: An intuitive genetic algorithm python library. Multimedia Tools and Applications, 83, 58029–58042.
- German Institute for Standardisation. (2022). Energy performance of buildings – Ventilation for buildings – Part 1: Indoor environmental input parameters for design and assessment of energy performance of buildings addressing indoor air quality, thermal environment, lighting and acoustics. SIS.
- Koester, S., Falkenberg, M., Logemann, M., & Wessling, M. (2017). Modeling heat and mass transfer in cross-counterflow enthalpy exchangers. Journal of Membrane Science, 525, 68–76. https://doi.org/10.1016/j.memsci.2016.10.030
- Koester, S., Klasen, A., Lölsberg, J., & Wessling, M. (2016). Spacer enhanced heat and mass transfer in membrane-based enthalpy exchangers. Journal of Membrane Science, 520, 566–573. https://doi.org/10.1016/j.memsci.2016.06.002
- Koester, S., Lölsberg, J., Lutz, L., Marten, D., & Wessling, M. (2016). On individual resistances of selctive skin, porous support and diffusion boundary layer in water vapor permeation. Journal of Membrane Science, 507, 179–187. https://doi.org/10.1016/j.memsci.2015.12.070
- Kremer, M., Mathis, P., & Müller, D. (2019). Moisture recovery – A dynamic modelling approach. E3S Web of Conferences, 111, 01099. https://doi.org/10.1051/e3sconf/201911101099
- Lauster, M., & Constantin, A. (2017). Verification of a low order building model for the modelica library aixlib using ashrae standard 140 [Paper presentation]. Proceedings of Building Simulation 2017: 15th Conference of IBPSA, Building Simulation Conference Proceedings. IBPSA.
- Lee, E.-J., Lee, J.-P., & Kim, N.-H. (2013). Moisture transfer characteristics of a LiCl-impregnated paper membrane used for an enthalpy exchanger. Journal of Mechanical Science and Technology, 27(5), 1527–1537. https://doi.org/10.1007/s12206-013-0333-2
- Loga, T., Diefenbach, N., & Stein, B. (2012). Typology approach for building stock energy assessment. main results of the tabula project. Institut Wohnen und Umwelt GmbH.
- Maier, L., Jansen, D., Wüllhorst, F., Kremer, M., Kümpel, A., Blacha, T., & Müller, D. (2023). Aixlib: An open-source Modelica library for compound building energy systems from component to district level with automated quality management. Journal of Building Performance Simulation, 17(2), 196–219. https://doi.org/10.1080/19401493.2023.2250521
- Men, Y., Liang, C., Li, Z., & Tong, X. (2021). Configuration optimization of a membrane-based total heat exchanger with cross-corrugated triangular ducts considering thermal economy and entropy generation. Case Studies in Thermal Engineering, 28, 101446. https://doi.org/10.1016/j.csite.2021.101446
- Min, J., & Su, M. (2010). Performance analysis of a membrane-based enthalpy exchanger: Effects of the membrane properties on the exchanger performance. Journal of Membrane Science, 348(1-2), 376–382. https://doi.org/10.1016/j.memsci.2009.11.032
- Min, J., & Su, M. (2011). Performance analysis of a membrane-based energy recovery ventilator: Effects of outdoor air state. Applied Thermal Engineering, 31(17-18), 4036–4043. https://doi.org/10.1016/j.applthermaleng.2011.08.006
- Muzychka, Y. S., & Yovanovich, M. M. (2004). Laminar forced convection heat transfer in the combined entry region of non-circular ducts. Journal of Heat Transfer, 126(1), 54–61. https://doi.org/10.1115/1.1643752
- Nasif, M. S., Al-Waked, R., Behnia, M., & Morrison, G. (2013). Air to air fixed plate enthalpy heat exchanger, performance variation and energy analysis. Journal of Mechanical Science and Technology, 27(11), 3541–3551. https://doi.org/10.1007/s12206-013-0872-6
- Nasif, M., Al-Waked, R., Morrison, G., & Behnia, M. (2010). Membrane heat exchanger in hvac energy recovery systems, systems energy analysis. Energy and Buildings, 42(10), 1833–1840. https://doi.org/10.1016/j.enbuild.2010.05.020
- Niu, J. L., & Zhang, L. Z. (2001). Membrane-based enthalpy exchanger: Material considerations and clarification of moisture resistance. Journal of Membrane Science, 189(2), 179–191. https://doi.org/10.1016/S0376-7388(00)00680-3
- polybloc AG. Winpoly. (2024). the certified planning tool. https://polybloc.com/downloads/
- Rafatinasr, M. (2016). Frosting in membrande energy exchangers [PhD thesis]. Univesity of Saskatchewan.
- Remmen, P., Lauster, M., Mans, M., Fuchs, M., Osterhage, T., & Müller, D. (2018). Teaser: An open tool for urban energy modelling of building stocks. Journal of Building Performance Simulation, 11(1), 84–98. https://doi.org/10.1080/19401493.2017.1283539
- Shakir Nasif, M. (2015). Effect of utilizing different permeable material in air-to-air fixed plate energy recovery heat exchangeron energy saving. ARPN Journal of Engineering and Applied Sciences, 10(21), 10153–10158.
- Shakir Nasif, M., & Al-Waked, R. (2014). Seasonal weather conditions effect on energy consumption and co2 emission for air conditioning systems coupled with enthalpy energy recovery heat exchanger. APCBEE Procedia, 10, 42–48. https://doi.org/10.1016/j.apcbee.2014.10.012
- Siegele, D., & Ochs, F. (2019). Effectiveness of a membrane enthalpy heat exchanger. Applied Thermal Engineering, 160, 114005. https://doi.org/10.1016/j.applthermaleng.2019.114005
- Sotokawa, H., Chung, J., Yoo, S.-J., & Ito, K. (2021). Numerical sensitivity analyses for identifying rate-limiting factors influencing total energy exchange efficiency in energy recovery ventilator. Indoor and Built Environment, 30(2), 245–263. https://doi.org/10.1177/1420326X19890376
- Swiss Society of engineers and architects. (2015). Raumnutzungsdaten für Energie- und Gebäudetechnik, SIA 2024 [Swiss Standard; english translation: Room utilisation data for energy and building technology].
- Wijmans, J. G., & Baker, R. W. (1995). The solution-diffusion model: A review. Journal of Membrane Science, 107(1-2), 1–21. https://doi.org/10.1016/0376-7388(95)00102-I
- Wüllhorst, F., Storek, T., Mehrfeld, P., & Müller, D. (2022). Aixcalibuha: Automated calibration of building and HVAC systems. Journal of Open Source Software, 7(72), 3861. https://doi.org/10.21105/joss.03861
- Zhang, L. Z. (2012). Progress on heat and moisture recovery with membranes: From fundamentals to engineering applications. Energy Conversion and Management, 63, 173–195. https://doi.org/10.1016/j.enconman.2011.11.033
- Zhang, L. Z., & Niu, J. L. (2002). Effectiveness correlations for heat and moisture transfer processes in an enthalpy exchanger with membrane cores. Journal of Heat Transfer, 124(5), 922–929. https://doi.org/10.1115/1.1469524
- Zhang, L. Z., Liang, C.-H., & Pei, L.-X. (2008). Heat and moisture transfer in application scale parallel-plates enthalpy exchangers with novel membrane materials. Journal of Membrane Science, 325(2), 672–682. https://doi.org/10.1016/j.memsci.2008.08.041
- Zhang, L.-Z. (2016). A reliability-based optimization of membrane-type total heat exchangers under uncertain design parameters. Energy, 101, 390–401. https://doi.org/10.1016/j.energy.2016.02.032