
ABSTRACT
Agricultural landscapes have become more intensive and monotonous, which may further increase biodiversity loss. Even though Finnish rural landscapes are often heterogeneous, crop choices and rotations lack diversity. The aim of this study was to develop an interactive, multi-step crop rotation tool, which acknowledges farmer’s preferences in land allocation for different crops depending on farm and field parcel characteristics. The tool was developed to provide as diverse a 5-year crop rotation plan as possible on the field parcel scale for the farmer’s consideration. The tool is flexible and interactive in the sense that it allows a farmer to include or exclude crops and spatially and temporally rearrange them to improve farming logistics. The tool was tested in southern-western Finland with the highest potential for diverse crop choices and sequencing. Test-runs indicated that the tool was powerful in proposing diversified crop rotations: the shares of current monotonous cereal-based rotations collapsed. The final diversification plan always lies in the farmer’s hands, who may exclude crop choices and even end up in cereal monoculture rotations. The tool provides estimates on farm economics for each step of the planning process. The tool will be available for all Finnish farmers (∼48,000) on the EconomyDoctor-portal with personal access only and the background information is automatically updated annually.
1. Introduction
One of the most alarming environmental challenges coupled with agricultural production is the loss of biodiversity (Rockström et al., Citation2009). Typically wide and monotonous agricultural landscapes that lack any mosaics caused by other types of land use (forests, waterways, set-aside lands etc.) are detrimental to biodiversity, though they might favour some species at the expense of others. For example, farmland specialist birds have declined by 20% in intensively farmed areas (Herzon et al., Citation2008). Compared to many European agrarian landscapes, the land use in Finland is quite heterogeneous and uniform farmlands dominate landscapes only locally. Thereby, the general prerequisites for maintaining biodiversity do exist. However, only a small number of crops dominate the land use. These are spring barley, oats, wheat and perennial grasslands with shares of ca. 24%, 15%, 9% and 24% of agricultural land use (Peltonen-Sainio & Jauhiainen, Citation2019a). Crop rotations are cereal-dominated and only some 2% of farms have diversified crop sequencing (Peltonen-Sainio & Jauhiainen, Citation2019b). However, not only biodiversity is at risk, but the current situation is alarming in numerous ways (Stoate et al., Citation2009), not least considering the impacts of monotonous cereal sequencing on the soil structure and functioning (Lal, Citation2015), with consequences such as yield stagnation and gaps (Peltonen-Sainio et al., Citation2015; Schils et al., Citation2018).
Even though agriculture exists to produce food for the increasing human population in a way that safeguards food security, farmers need to be able to reconcile the task of primary production with environmental, climatic, political and many other goals (Foley et al., Citation2011). Increasingly complex challenges of agricultural production require problem-solving tools and decision support systems. Any tool aiming to facilitate decision making processes has to be in one way or another based on the understanding of how the operator acts and what the drivers are for different types of decisions. This study focusses on supporting farmer’s decision making in the direction towards more diverse crop rotations and land use. We present a crop rotation tool developed for high-latitude conditions in Europe, where agriculture has alarmingly moved towards monotonous crop sequencing patterns (Peltonen-Sainio & Jauhiainen, Citation2019b) threating the state of the soil, water, air and biodiversity (Stoate et al., Citation2009). The same type of shift towards increasing cereal frequencies at the expense of other crops has also occurred in Western Australia and they have developed a land use sequence optimizer (LUSO) to support the introduction of break-crops into cereal-based rotations (Lawes & Renton, Citation2010; Malik et al., Citation2015; Renton et al., Citation2015). Additionally, many other tools and models aiming to understand and support decision making for more diverse crop sequencing and land use have been published (Capitanescu et al., Citation2017; Detlefsen & Jensen, Citation2007; Ditzler et al., Citation2018; Dury et al., Citation2012; Filippi et al., Citation2017). The dynamic and interactive tool presented in this paper is, however, based on novel, regionally relevant understanding on farmers’ decision making on land allocation combined with automatically provided, annually updated data on previous crop sequencing and parcel characteristics in a farm and all this at field parcel scale.
The tool was developed to acknowledge the decision making of Finnish farmers based on comprehensive field parcel scale data (Peltonen-Sainio et al., Citation2017, Citation2018; Peltonen-Sainio & Jauhiainen, Citation2019b). The aim of this study was to develop an interactive, multi-step tool for the diversification of 5-year crop rotations, which acknowledges gained understanding of the farmers’ preferences concerning land allocation for different crops depending on farm and field parcel characteristics. The tool was intended to be flexible and interactive in the sense that it allows a farmer to exclude unwelcome crops, include missing crops and rearrange their allocation to improve farming logistics. Thereafter, our aim was to run the tool in a test area and assess the diversification potential it proposed by estimating the shifts in the frequencies of crop choices and crop rotation types, and furthermore, to assess how realistic the suggested diversification proposals are.
2. Materials and methods
2.1. Estimating the suitability of field parcels for different crops
Assessment of the suitability of crops for a field parcel was based on previous work on the importance of different field parcel characteristics for decision making by farmers for land allocation (Peltonen-Sainio et al., Citation2018). The field parcel characteristics consisted of the following: the field size (ha), the field shape, the field slope (%), the distance to the farm centre (m), the proximity to a waterway (m), the soil type and ownership (owned/leased). All the field parcel characteristics were categorized into two or more groups. A generated understanding of how farmers currently allocate fields for different crops depending on the parcel characteristics was used to estimate the suitability of each individual field parcel for a crop in the study region (16,000 km2) with 74,119 parcels located in the south-western coastal area of Finland. Field parcels that were not divided into several agricultural parcels were included in the analyses, i.e. at least 70% of the parcel area had to be for a single dominating crop. Dairy and organic farms were not included in the analysis. Modelling was carried out for 74,119 field parcels, but the developed tool was tested on a larger area including 142,765 field parcels. The estimation on the suitability of a parcel was based on a recently published method (Peltonen-Sainio & Jauhiainen, Citation2019b), in which a multinomial logistic regression (SAS/LOGISTIC procedure) was used to model the probability that a field parcel would suit different crops. The basic idea was that all field parcel characteristics were included in the model at the same time. Using the estimated parameters of the model, the preferences of the farmers concerning land allocation was calculated for all fields and crops. Because the magnitude of the calculated preferences was related to the frequency of different crops in the study area and the crops’ suitability depending on the field parcel characteristics, the preferences were compared to the distribution of preferences for 74,119 parcels. After that, all crops in any field parcel were put in rank order (= rankij, where j was the rank for jth crop in the ith field parcel, j = spring barley, spring oats, spring wheat, winter wheat, winter rye, peas, faba beans, rapeseed, and sugar beet).
2.2. Formula to calculate scores for crop choices
The tool developed in this study offers a crop for a parcel for the next year by using a formula that has three main considerations: crop suitability, crop rotation and limitations. The crop suitability score for the ith field parcel is −0.287 × rankij, where rankij is the rank for jth crop applying ranking calculations based on the logistic analysis of 74,119 field parcels. Thereby, the crop suitability score is between 0 and −2.583 points.
A crop rotation score takes into account the four previous years. The scores for the next year and for all possible crops (spring barley, spring oats, spring wheat, winter wheat, winter rye, peas, faba beans, rapeseed, and sugar beet) were calculated as follows:
+0.0, if the same cereal species was in a field in all of the four preceding years and then suggested for the next year
+1.0, if the same cereal species was in a field for four years and another cereal for one year
+2.0, if the same cereal species was in a field for three years, and another cereal species for two years or two other cereals both for one year
+2.5, only cereals were cultivated in a field for all five years but in a more diverse way than above
+3.0, crop rotation with a break-crop was applied in a field in which cereals dominated but another crop species appeared as a break-crop at least for one year
+3.5, crop rotation with break-crops was applied in a field in which cereals dominated but two other crop species appeared as break-crops and both of them at least for one year
Some additional points and penalization points were included in the scoring system. First, +0.5 points were added if a rotation included both spring and winter cereal species. Second, the crop of the previous year was penalized, if the same, by −1.0 point (the penalization concerned only the previous year, not further history except for rapeseed). As rapeseed following rapeseed must be avoided due to the increasing crop protection risks, penalty for that was set to even −4.0 points. Rapeseed after one break-year with another crop was set to −2.0 points, while 2 and 3 break-years were set to −1.0 and −0.5 points, respectively. If four previous years did not include peas or faba beans, +0.3 points were added for these grain legumes due to their advantageous impacts. Penalties were set to be −0.75, −0.50 and −0.25 for these crops if 1, 2 and 3 break-years were used between them, respectively.
Two limitations were set to the formula: (1) the typical sowing time for winter wheat and winter rye is the end of August/early September in Finland, while the harvesting of faba beans and rapeseed takes place in September–October, therefore winter cereals were excluded as an alternative following crops after faba beans and rapeseed, (2) the harvesting for spring wheat is at the time typical for sowing winter cereals, and according to Finnish official agricultural statistics (Luke’s Statistical Services, Citation2019), winter cereals can only follow the earliest maturing spring wheat cultivars in rotation, so the tool suggests this kind of pre-crop and following-crop combination only in the case that a winter cereal is a superior crop choice, and the penalty was set to be −0.50 point for such a combination.
2.3. Basic idea of the tool
The tool to diversify crop rotations was developed to include three steps and to produce as diverse a 5-year crop rotation plan as possible as an outcome of each step for each of the owned and leased field parcels on a farm (). In the first round, the preconditions of the farm are considered, and a rotation plan is produced using the formula explained in Section 2.2. Thereafter, the farmer may change the crop choices by excluding some suggested crops and including new ones. The tool will accordingly provide an updated crop rotation plan. Again the farmer may exclude or include crops, but also spatially and temporally rearrange them, e.g. to achieve better logistic advantages, and the tool then provides the final crop rotation plan for a farm. The impacts of the changes in crop rotations on the farm economy are estimated in each step, but such data will not be available until the developed tool is fully launched and used by the farmers in an interactive manner to provide grounds for reliable estimations, e.g. depending on farming system and farm type.
Figure 1. The general flow chart of the developed, farm-based, interactive diversification tool for 5-year crop rotations for all the >1 million field parcels in Finland.
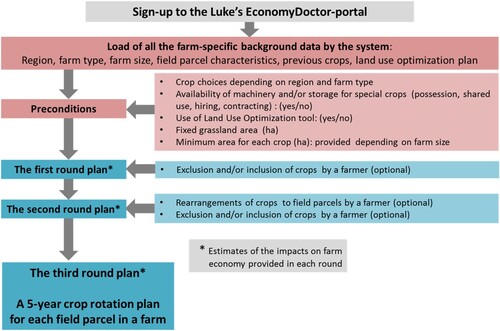
2.3.1. The first-round crop rotation plan based on preconditions of a farm and field parcels
The process starts by loading all the relevant background data for a farm, both owned and leased parcels. The following characteristics that steer farmer’s decision making on land allocation to different crops (Peltonen-Sainio et al., Citation2018) are available for each field parcel of the farm: parcel size, shape, slope, the distance to farm centre, proximity to waterway and soil type. Furthermore, the tool loads the previous crops grown in each field parcel for the last four years. The tool acknowledges the potential crop choices in a region. The regions used in the tool are based on the areas defined by the Finnish Centres for Economic Development, Transport and the Environment (ELY Centres). Potential crop choices can be divided into the following: (1) dominating crops in a region, (2) major crops, (3) emerging crops and (4) novel crops. Dominating crops such as spring cereals have a high share of land in a region and the tool aims to reduce their monotonous sequencing patterns. Major crops are common and usually well adapted to the conditions in a region and farmers are experienced with them. Emerging crops have a low cultivation area and they are likely to be more prone to weather-related risks in a region, but farmers have gradually gained more experience with their cultivation. Farmers are not yet experienced with novel crops, and they are not yet well adapted to high-latitude conditions and hence, they carry high production risks.
The tool acknowledges the farm size and farm type, which both set some limits for land allocation, especially regarding the total number of crops on a farm to meet the demand of sufficiently high lot sizes for the total crop yield in a year (Peltonen-Sainio et al., Citation2017, Citation2018). The area of grassland also needs to be fixed according to animal head numbers. To define the minimum cultivation area for each crop on a farm the minimum acceptable crop area (ha) was estimated depending on the farm size (<30 ha, 30–59 ha, 60–99 ha and ≥100 ha) and farm type (crop farms, dairy and beef farms, pig farms, poultry farms, sheep and horse farms and horticultural farms) by excluding the lowest 10% of the crop specific land areas. As the farm type had a negligible if any impact on the minimum crop areas in a farm, only the farm size was considered. The only exceptions were for spring wheat (Triticum aestivum L.) and winter rye (Secale cereale L.), for which the minimum areas were estimated separately for two main farm categories, crop and animal farms. The minimum cultivation areas were estimated for spring barley (Hordeum vulgare L.), oats (Avena sativa L.) and wheat, winter wheat and rye, rapeseed [both turnip rape (Brassica rapa L.) and oilseed rape (B. napus L.)], peas (Pisum sativum L.), faba beans (Vicia faba L.), cereal mixtures and cereal-grain legume mixtures. The area of grassland was fixed to be similar to the previous year.
Farmers may also choose to use a land use optimization tool (Peltonen-Sainio, Jauhiainen, Laurila, et al., Citation2019), which is another service available on Luke’s Economydoctor-portal. This tool allocates field parcels on a farm into three categories: sustainably intensified, extensified and afforested parcels. The latter two are solely devoted to greening purposes [e.g. green fallow, nature managed field, game field, reed canary grass (Phalaris arundinacea L.)] if not afforested. The means of extensification of a parcel is for the farmer to decide. Parcels proposed for afforestation are not suitable for food production and they are unimportant for future food security. The sustainably intensified fields again will be targeted for food production, and the crop rotation tool concentrates on diversifying such parcels. Other pre-selection options are also open for a farmer such as: (1) limitations on special machinery, storage capacity etc. that are required for crops such as potatoes and sugar beet, and (2) the farmer’s interest in contracting and the shared use of machines, storage and land with other farmers.
By considering the preconditions of a farm, the tool allocates appropriate crops for each field parcel on the farm using the formula explained in Section 2.2.
2.3.2. The second-round crop rotation plan based on farmer’s preferences on crop choices
Farmer can make changes to the outcomes of the first-round crop rotation plan by excluding some proposed crops and including new ones. The data is too limited to enable an analysis of the farmer’s preferences for land allocation for minor and novel crops, which can therefore only be included by the farmer. Such crops that might interest some farmers could include: caraway (Carum carvi L.), winter rapeseed, flax (Linum usitatissimum L.), buckwheat (Fagopyrum esculentum L.), hemp (Cannabis sativus L.), sunflowers (Helianthus annuus L.) and maize (Zea mays L.) as well as all the horticultural crops. All the alternative crops are listed in the tool for the farmer to include if preferred.
Once the farmer has reselected the crops to be included in the planning process, the tool allocates crops with a similar procedure to the one in the first round. The crops lacking sufficient data on farmer preferences are allocated by the farmers. Information on the prior land use for special crops on a farm may guide the identification of appropriate field parcels. Thereby, the second updated version of the crop rotation diversification plan will be shared for the farmer’s consideration.
2.3.3. Final crop rotation plan based on farmer’s spatial and temporal rearrangements
All the crop choices are principally fixed during the second round, and their sequencing in rotations is scheduled for the next five growing seasons. If the farmer still has doubts about a crop, it can be replaced by another crop. However, the main consideration in the third round for a farmer is to fine tune the plan by reallocating crop(s) into other than selected field parcels, e.g. due to logistic advantages. A farmer may like to have the same crop in a nearby field or to locate some crops closer to the farm centre. Furthermore, break-crops such as rapeseed and grain legumes may be switched to appear only in one particular year instead of having them scattered over several years with smaller production volumes per year. By following these rationales, the final 5-year crop rotation plan for each of the field parcels on the farm is produced. The crop rotation plan is stored by the tool and there is no need for the farmer to update it according to the realized crop rotations as the tool will automatically upload the cultivated crops for each year once official information is made available by the Finnish Food Authority.
2.4. Comparing previous and proposed rotations when applying the tool
Data on 142,765 field parcels from the south-western coastal region of Finland was used for planning of the forthcoming 5-year crop rotations depending on the crop sequencing during the four preceding years and the suitability of field parcel characteristics for different crop species. Two plans were made. In the first plan, the formula and the tool were used without setting any limitations or making selections available for the farmer. In the second plan, the option to set limitations was applied.
The cultivation of sugar-beet requires special machinery and was likely to be a serious option only for a small number of farms. In addition, detailed examinations of farmer’s preferences concerning land allocation showed that sugar beet has quite unique land parcel requirements. Therefore, sugar beet was the most suitable crop for field parcels that fulfilled these specific requirements without any competitive alternative crop. Hence, second plan was made expecting that a farmer would exclude sugar beet. Dairy farms and organic farms were not included in the test runs.
3. Results
To avoid the risk that the tool would provide scattered and unrealistic crop rotation plants with an overly low share of land devoted to each or certain crop species, the minimum cultivation areas were estimated for each crop. The farm size had a substantial impact on the minimum cultivation area for spring cereals (), for which the acceptable area increased from 1.5 ha for barley and 1.2 ha for oats when grown on small farms (<30 ha) to even 14.0 and 8.6 ha, respectively, for very large farms (≥100 ha). The farm types, when analysed as crop or animal farms, had an impact only on spring wheat and winter rye. On crop farms the minimum area for spring wheat increased more, from 1.6 ha on small to 11.0 ha on very large farms, when compared to animal farms, which were 1.6 and 8.2 ha, respectively. For winter rye the difference between farm types was more modest as were the minimum land areas. For winter wheat, rapeseed, peas and faba beans the minimum requirements for the land area on a farm were higher on larger farms (3.9, 5.5, 1.0 and 3.6 ha, respectively, for very large farms), but were lower than that for spring cereals.
Table 1. The minimum cultivation areas (ha) for each crop on a farm depending on the farm size, when the lowest 10% has been excluded.
Spring cereals dominated land use in the test region with 78,076 field parcels with a 46.0% share for barley, 26.1% for oats and 15.5% share for spring wheat (). When the crop rotation tool was applied, the shares shrank and were 15.7%, 18.3% and 9.7% for barley, wheat and oats, respectively. Simultaneously, the shares of all the other crops expanded and the shift was most significant for faba beans and peas (from 0.2% shares to 12.9% for peas and 8.3% for faba beans) though only marginally for rapeseed and winter cereals. Because the farmer preferences differed for land allocation for sugar beet compared to other crops (Figure S1), the share of sugar beet tended to increase noticeably when the tool was applied, from the current <1.7% to 15.7%. On the other hand, if farmer excluded sugar beet from the crop choices in the second step, e.g. due to a lack of machinery, the shares of all the other crops increased. However, this depended on how well the field parcels liberated from sugar beet were suited for other alternative crops. Rapeseed benefitted most, while oats benefitted the least from the land liberated from sugar beet, followed by peas, winter rye and spring wheat.
Table 2. Shifts in frequencies (no.) and shares (%) of different crop species for each five-year period before and after applying the tool for 78,076 field parcels.
The crop rotation tool was applied to the test region with 142,765 field parcels in order to estimate the potential shifts in shares of different crop rotations when compared to the preceding 5-year rotation. As the area allocates as grassland and green-fallow rotations were fixed, the shifts in shares occurred with cereal-based and diverse crop rotations (). The tool was successful in allocating all the fields currently with cereal species monoculture rotations to other rotation types. These monoculture rotations had barley after barley or oats after oats with one other cereal, if any, (i.e. oats for barley rotation and barley for oats rotation) over five years. Also the share of cereal monoculture rotations shrank from 13.3% to only 0.5% and that of break-crop rotations slightly reduced (from 22.7% to 17.3%), while diverse crop rotations increased from the current share of 1.9% to 7.3%. However, as the share of unidentified rotations would have increased dramatically, we identified another rotation type that had a negligible share until the tool was applied. This was called a more flexible diverse rotation and its share was as much as 33.2% when the crop rotation tool was applied, and thereby the share of unidentified rotations remained quite unchanged (from 17.7% to 18.3%). If sugar beet was not included, the share of cereal monoculture rotations slightly increased (to 2.1%), as did the share of break-crop rotations (24.2%) at the expense of diverse rotations (6.8%) and more flexible rotations (25.1%), while the share of unidentified rotations remained the same (18.2%).
Table 3. Shifts in frequencies (no.) and shares (%) of different 5-year crop rotations before and after applying the tool for 142,765 field parcels.
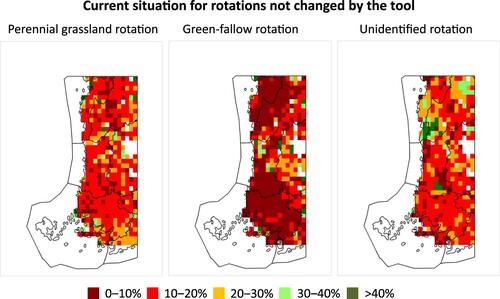
In order to characterize the spatial differences in shifts within each rotation type when the crop rotation tool was applied, gridded maps were produced for the study region. Independent of whether sugar beet was included or not there was not a single 10 × 10 km grid with shares of cereal species monoculture rotations that exceeded 10% despite some differences in shares in the preceding period (). The same was true for cereal monoculture rotations (). However, with the break-crop rotations the shifts in the shares differed depending on the region. In preceding period these rotations were most frequent (with up to a 40% share) in the south-western Finland Proper region where their share was reduced to <20% or in some cases even <10%, though a bit less when sugar beet was not included in crop choices (). Elsewhere the shifts were smaller if sugar beet was included, but if not the share of break-crop rotation was increased by the tool in the coastal regions and the northern parts of the study region. Very scarce diverse rotations became more frequent in areas where the shares of break-crop rotations declined, especially in the Finland Proper region without being markedly influenced by the presence or absence of sugar beet (). The newly identified, more flexible diverse crop rotation gained high shares of land use (>40% at most) everywhere in the study region except in the mid-regions of the study area covering parts of Pirkanmaa and the border areas of Satakunta and Ostrobothnia (). The current shares of perennial grassland, green-fallow land and unidentified rotations remained unchanged and most frequently had shares of 10–20%, <10% and 10–20% of the field parcels, respectively (). Unidentified rotations were most frequent in the northern parts of the study region, while green-fallow rotations were the most common in the Pirkanmaa region inland.
Figure 2. Current frequencies of cereal species monoculture rotations and estimated changes when the tool was applied. Each square is 10 × 10 km and when white in colour, the number of field parcels is too low (<30). The tool outcome does not differ if the farmer agrees or not to cultivate sugar beet.
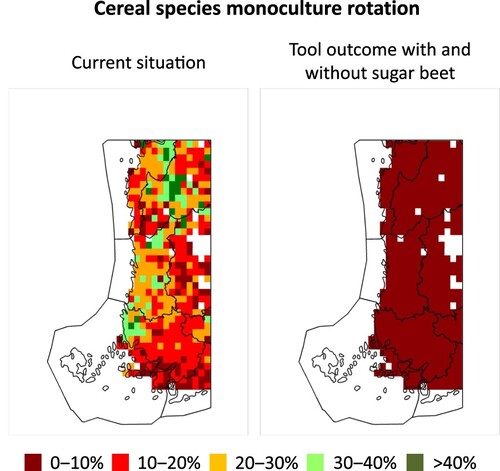
Figure 3. Current frequencies of cereal monoculture rotations and estimated changes when the tool was applied. Each square is 10 × 10 km and when white in colour, the number of field parcels is too low (<30). The tool outcome does not differ if the farmer agrees or not to cultivate sugar beet.
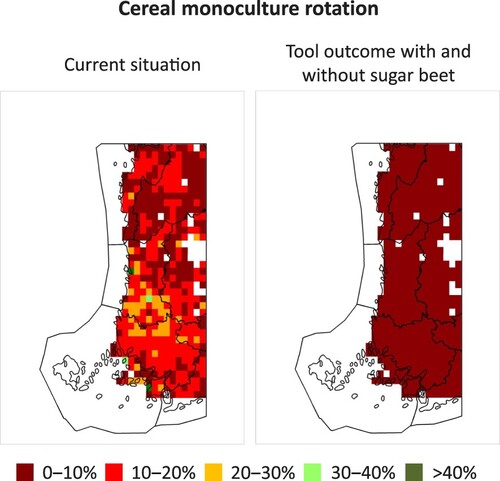
Figure 4. Current frequencies of break-crop rotations and the estimated changes when the tool was applied. Each square is 10 × 10 km and when white in colour, the number of field parcels is too low (<30). The tool outcome is shown for two cases, in which the farmer either agrees or not to cultivate sugar beet.
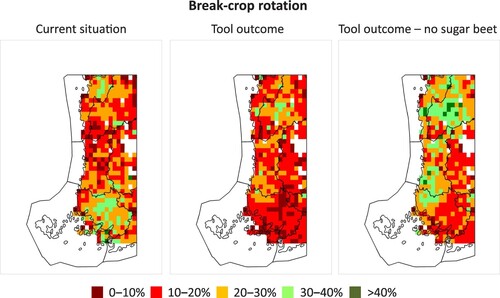
Figure 5. Current frequencies of diverse rotations and the estimated changes when the tool was applied. Each square is 10 × 10 km and when white in colour, the number of field parcels is too low (<30). The tool outcome is shown in two cases, in which the farmer either agrees or not to cultivate sugar beet.
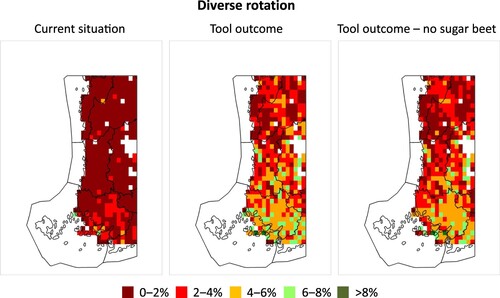
Figure 6. Frequencies of more flexibly determined diverse rotations when the tool was applied. Each square is 10 × 10 km and when white in colour, the number of field parcels is too low (<30). The tool outcome is shown in two cases, in which the farmer either agrees or not to cultivate sugar beet.
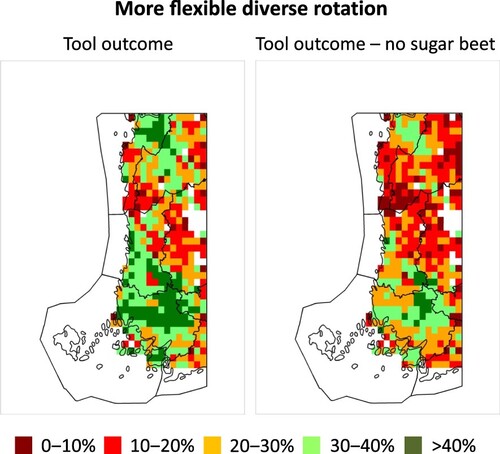
Figure 7. Current frequencies of rotations that were not changed when the tool was applied.
4. Discussion
4.1. Features, performance and limitations of the tool compared to the goals
The main aim for the development of the crop rotation tool was to create a crop rotation plan which truly encourages farmers to shift towards diversified crop shares and rotations on the farm and acknowledges farmers’ preferences as much as possible in allocating land to different crops (Peltonen-Sainio et al., Citation2017, Citation2018; Peltonen-Sainio & Jauhiainen, Citation2019b). This was considered important because increasing numbers of decision support systems are available for farmers for various purposes and if any of them work against the user’s logic, it is most likely abandoned after a short lifespan.
The crop rotation tool was built to increase spatial heterogeneity by diversifying agricultural land use especially by replacing monotonously sequenced cereals with diversifying crops that are better or equally suitable for the parcels (Figure S2). To ensure appropriate lots sizes and logistic advantages in the case of a higher number of crops on a farm, the minimum land area for each crop on a farm was determined. This area was found to increase as the farms became larger, and to be lower for other crops than spring cereals (). During the project it was important to benefit from this data and build a better understanding for the development of the tool. This was an additional measure to ensure that rational land allocation plans were proposed for farms in spite of the primary aim to diversify crop choices and rotations.
The primary aim of achieving as diverse crop rotations as possible for each field parcel was successfully achieved according to the test runs of the tool. Interaction with the farmer during the phases of using the tool (though outcomes not yet available at this stage of the process), will further assure that the diversification plan are implementable. This feature is apt to encourage farmers to more seriously consider the plan than when compared to the recent obligation to make a 5-year crop rotation plan as a part of the Agri-Environment Scheme without virtually any systematic support. Hence, farmers have argued the scheme was an obligation which will be fulfilled solely on paper (Peltonen-Sainio et al., Citation2018).
As an outcome of applying the crop rotation tool, the shares of dominating spring cereals were significantly reduced and the shares of all the other potential crops increased (). Hence, cereal monoculture species rotations (barley after barley or oats after oats) were eliminated, cereal monoculture rotations dramatically shrank, the share of break-crop rotations slightly declined and consequently, the share of diverse rotations increased (). The share of unidentified rotations remained more or less the same but only because a new type of diverse rotation was identified and named as a more flexible diverse rotation. As the field parcels that farmers allocate to sugar beet differed from those allocated to other crops (Figure S1), the tool tended to primarily propose such fields only for cultivation of sugar beet. It is, however, likely that farmers often ignore sugar beet as an alternative crop because it requires special machinery and is not competitive at high latitudes of Europe due to low yields (Luke’s Statistical Services, Citation2019). Therefore, tests were also run for the cases in which sugar beet was ignored, and thereafter crops were redistributed to the field parcels for the next five years. The shares of all remaining crops increased, but especially rapeseed gained more parcels as did peas, winter rye and spring wheat (). The tool acknowledges the need for a lag-period for cultivation, depending on the crop, to avoid increases in their crop protection risks (Hannukkala et al., Citation2016; Huusela-Veistola & Jauhiainen, Citation2006).
The above examples indicate that the first step proposal for the allocation of crops and rotations fully meets the original target of proposing crop rotations that are as diverse as possible for a farm. However, when a farmer excludes and/or includes crop(s) in the selection, the outcome may change radically and might even result in a plan with monotonous cereal-based land use without any marked transition towards diversification (Stoate et al., Citation2009). In any case, the tool provides estimates for farm profitability during the three-step process and thereby, the farmer gains insights into the economic impacts of the diversification, which may serve as an encouragement and commitment for future planning. This economic data may also encourage farmers to consider crops such as rapeseed and caraway if they earn better profits. On the other hand, if cereal prices are high, it tends to discourage the cultivation of special crops, while in the opposite situation it is likely to encourage them (Liu et al., Citation2016; Purola et al., Citation2018). In cases when cultivating a special crop is not encouraging because of the prevailing market situation, the farmer can benefit from the feature in the tool to shift special crops to later years in the rotation. Nonetheless, agricultural policies have a central role in supporting shifts towards more environmentally sustainable systems (Stoate et al., Citation2009).
Sometimes farmers are reluctant to cultivate some crop(s) due to previous disappointments even when there may be the expectation of earning high profits from them. For example, rapeseed has a bad reputation among Finnish farmers due to many coinciding events that caused yield declines in the early 2000s (Peltonen-Sainio et al., Citation2007). However, if a diversifying crop is excluded by a farmer, the tool may suggest some other crop to diversify the rotations and land use.
One limitation of the current version of the tool is that the crop choices proposed by the tool are those that have adequate data available in the registers of the Finnish Food Authority to enable comprehensive estimations on how farmers allocate field parcels to each crop. Hence, at the current stage farmers can only add minor crops which are available in the list of alternative crop choices in the tool. Crop choices are again region specific to avoid weather-related risks especially related to the length of the growing season. However, additional analyses will be carried out to expand the crop choices so that they will be automatically proposed by the tool in the case that the cultivation areas for some minor crops expands (Peltonen-Sainio, P., personal communication, 5.6.Citation2020) due to the farmers’ increased interest (like currently towards caraway and winter rapeseed) and due to the expanding growing season brought by climate warming (Ruosteenoja, Räisänen, Venäläinen, & Kämäräinen, Citation2016; Ruosteenoja, Räisänen, Venäläinen, Kämäräinen, & Pirinen, Citation2016). Climate warming may also necessitate updating the list of region-specific crop candidates (Elsgaard et al., Citation2012).
It could also be considered a further limitation of the tool that the field parcels under grasslands are fixed to be similar to the previous year because they are perennial stands. Farmers also differ in what they consider to be a safe grassland area per animal head because the number of cuts and yields may vary considerable depending on the weather conditions (Korhonen et al., Citation2018; Niemeläinen et al., Citation2001). In the case of serious weather constraints such as drought, limited feed stocks may have serious consequences on animal farms as there are no organized markets for silage. Although the field parcels allocated to perennial grassland rotations often diverge from those allocated to cereal-based rotations (Peltonen-Sainio et al., Citation2017), opportunities to propose a better mix between these two rotation types exist. Abandoning the current differentiation of field parcels between those used as grassland and those for cereals would be a valuable means of enhancing soil conditions in fields with a long history of monotonous cereal sequencing (Heikkinen et al., Citation2013) in fields with a long history of monotonous cereal sequencing.
As with minor crops, in this first version of the tool, the farmer makes possible changes in land allocation to grasslands and the tool reconsiders the crop disposition accordingly. It is possible to consider grasslands more dynamically in the crop rotation tool because the EconomyDoctor-portal has data on animal head numbers on a farm for estimation of the required grassland area. Including grasslands is, however, not a straightforward process as their lifespan may vary from one to four years depending on stand quality. Furthermore, as farmers tend to allocate different types of field parcels as grasslands than cereals (Peltonen-Sainio et al., Citation2018), land allocation using a tool that respects the farmer’s preferences will not necessarily change the land allocation dramatically.
These examples of opportunities to expand the automatization of crops proposed by the tool, however, emphasize the flexible nature of the developed tool and open opportunities for updates.
4.2. The interface between diversification plans and targets set for agriculture
The crop rotation tool was developed to support farmers to increase both the spatial and temporal heterogeneity of the land use on the farms. Such changes may increase resilience to climatic variability (Kahiluoto et al., Citation2019), which is important in the high-latitude regions with many weather constraints that cause yield losses and variations (Peltonen-Sainio et al., Citation2016). This is highly important as such risks are a growing burden (Kron et al., Citation2019) and are expected to become even more frequent in the future (Jylhä et al., Citation2014). However, to benefit from possible resilience impacts spatial diversity should be encouraged in all growing seasons, even though it is possible that due to logistic advantages (Myyrä & Pietola, Citation2002) farmers may prefer to cultivate crops such as rapeseed in large areas in one year and then have a required lag-period for the next three or four years in rotation. Weighting temporal heterogeneity over spatial heterogeneity may increase rather than reduce the risks caused by weather constraints, as in the worst case one unfortunate year with low yields (e.g. due to drought) cannot be compensated for by years with higher yields. Furthermore, increasing areas of a single crop is apt to increase crop protection risks (Huusela-Veistola & Jauhiainen, Citation2006) in spite of proper lag-periods. Therefore, the tool in the EconomyDoctor-portal will advise a farmer with a structured, pop-up message about the increasing risks concerning resilience, pests and diseases in the case that the farmer weighs temporal heterogeneity over spatial heterogeneity on a large scale.
It is likely that farmers who are interested in diversification will be primary users of the tool. In general, there is increasing interest towards diversification of crop rotations (Peltonen-Sainio et al. Citation2019b) for various reasons. If the final plan implemented by farmers supports the transition towards more diverse crop rotations, and in addition to this the farmers also benefit from the land use optimization tool by sharing field parcels so they are sustainably intensified and extensified (Peltonen-Sainio, Jauhiainen, Laurila, et al., Citation2019), landscape heterogeneity may increase substantially, as evident according to Figures 2–7. These figures are based on an outcome of the first-round crop rotation plans with or without sugar beet and hence indicate potential, but not expected changes after implementation. However, any gradual transition towards more a diverse, unevenly cultivated agricultural landscape may provide habitats that enhance biodiversity (Ekroos et al., Citation2013; Stoate et al., Citation2009; Toivonen et al., Citation2015). It is, however, important to highlight that along with cultivation of even a high variety of crops, also other landscape scale changes are elemental in agriculture to conserve and restore biodiversity. This means additional measures to ensure the existence of High Nature Value farmlands, grazed grasslands, traditional rural biotopes, extensive land use, fine-scale mosaic landscape structures provided by the tree and shrub ‘islands’ and natural waterways (Mäkeläinen et al., Citation2019).
4.3. Implementation of the tool with estimates of the impacts on the farm economy
An important target for developing the tool was to make it easily available and to provide access for all Finnish farmers free of charge. Farmers may share the data with extension services and neighbouring farmers. The tool will be realized by including it as a novel service on Luke’s EconomyDoctor-portal (Luke’s EconomyDoctor, Citation2019). This portal is well-known by farmers and other stakeholders, and annually 120,000 reports are loaded from the different services provided by the portal. The service is in Finnish, Swedish and English but can be in virtually any language. The tool is available for all Finnish farmers (∼48,000) with personal access only and the background information is automatically updated annually. Although farmers have easy access to the tool, it is unlikely that its implementation would suddenly cause shocks in the availability of different crop yields because the majority of the farmers are often very conservative and cautious about making changes in their course of actions (Sorvali J., personal communication, 5.6.2020).
The tool provides information on the farmer’s crop choices and growing areas in each step of the process and the farmer can track the changes in farm economics. Because information on the sale proceeds and variable costs of the different products from all Finnish farms is not available, analyses on the impacts of changes in crop choices on the farm economy are based on profitability bookkeeping data from 800 farms (the Finnish FADN maintained by Luke). The average economical outcomes are again available from the Agriculture and Horticulture service on the EconomyDoctor portal (Luke’s EconomyDoctor, Citation2019). The total costs of each profitability bookkeeping farm are allocated to all the products of a farm. The sale proceeds and subsidies of each product for each farm are included as well. Thereby, the economic outcome for each crop is calculated for each farm type and region and the impacts of product changes on the economy are then estimated. The crop rotation tool applies these profitability bookkeeping farm-based estimates to all Finnish farms.
The impacts of changes in crop choices on the farm economy are calculated according to prevailing prices based on profitability bookkeeping data. A couple of additional scenarios can also be used, with changes in relative prices, e.g. increasing or decreasing cereal prices compared to those of alternative, diversifying crops. Furthermore, novel knowledge on pre-crop values for a high-number of previous and subsequent crop combinations available for Finnish growing conditions (Peltonen-Sainio, Jauhiainen, Honkavaara, et al., Citation2019) will be valued in euros and included in the economic assessments. The economic outcomes of the tool components are not yet, however, available as it requires that the tool is launched and used by farmers in an interactive manner to provide the grounds for reliable estimations.
5. Conclusions
The development of a highly target-oriented, interactive, multi-step crop rotation tool was introduced. The tool acknowledges farmers’ preferences towards land allocation for different crops depending on farm and field parcel characteristics with the ultimate aim to achieve as diverse a plan for a 5-year crop rotation as possible on the field parcel scale for all Finnish farms. A farmer can include or exclude crops and spatially and temporally rearrange them. When the tool was tested in southern-western Finland, which has high potential for the diversification of land use, it proved to be powerful in test-runs in the sense that the shares of current monotonous cereal-based rotations were eliminated in the rotation plans and those of diverse rotation types increased dramatically which would have impacts on farmland heterogeneity. However, the final diversification plan is always in the farmer’s hands, who may exclude crop choices, and even end up with cereal species monoculture rotations. The tool will not only provide a 5-year crop rotation plan based on the four previous years, but it also estimates shifts in the farm economy at each step of the planning process to support socio-economically feasible outcomes. However, agricultural policies play a major role in governing future changes in agricultural practices and thereby should also support measures that favour diversification and long-term sustainability. The tool is available in 2020, free of charge for all Finnish farmers (∼48.000) on the EconomyDoctor-portal with personal access (however, it is shareable with advisors and other farmers) and the background information is automatically updated annually. The basic idea of the tool can be applied to any country where the national background data are available.
TAGS_1775931_Supplementary_Figures
Download Zip (227.8 KB)Acknowledgements
This work was financed by the Ministry of Agriculture and Forestry and Natural Resources Institute Finland (Luke) as a part of a consortium project entitled Developing an Interactive Tool for Farmers to Facilitate Diversification of Crop Rotations (VILKAS) in collaboration with projects Boosting Integrated Assessment Modelling for Sustainability Analysis (BoostIA), Diversifying Cropping Systems for Climate Smart Agriculture (DivCSA, the Academy of Finland decision no. 316215) and Sustainable Intensification of Crop Production through Land Use Changes (PeltoOptimi).
Disclosure statement
No potential conflict of interest was reported by the author(s).
Additional information
Funding
Notes on contributors
Pirjo Peltonen-Sainio
Pirjo Peltonen-Sainio is a Research Professor at Natural Resources Institute Finland (Luke). She is a crop scientist and agronomist with research focuses on the adaptation of crops and production systems to conditions at northern latitudes and to climate change. Issues of sustainable intensification of production systems, self-sufficiency in Nordic regions and food security, lie behind her work on the influence of environmental, climatic and genetic variation on field crop production and development of farmer support tools.
Lauri Jauhiainen
Lauri Jauhiainen works as a Senior Scientist at Natural Resources Institute Finland (Luke). He is specialized in analyzing long-term, multi-location experiments, farm survey datasets and remote sensing data, e.g., in relation to crop responses, input use, environmental impacts for development of farmer support systems and tools.
Arto Latukka
Arto Latukka is a Senior Scientist at Natural Resources Institute Finland (Luke). He is expert in business accounting and responsible on Farm Accountancy Data Network (FADN) in Finland. He is the person in charge of the Luke’s Economy Doctor internet platform and services of that platform. One of those services is Crop rotation-tool as the most recent farmer support system.
Related Research Data
References
- Capitanescu, F., Marvuglia, A., Navarrete Gutiérrez, T., & Benetto, E. (2017). Multi-stage farm management optimization under environmental and crop rotation constraints. Journal of Cleaner Production, 147, 197–205. https://doi.org/10.1016/j.jclepro.2017.01.076
- Detlefsen, N. K., & Jensen, A. L. (2007). Modelling optimal crop sequences using network flows. Agricultural Systems, 94, 566–572. https://doi.org/10.1016/j.agsy.2007.02.002
- Ditzler, L., Klerkx, L., Chan-Dentoni, J., Posthumus, H., Krupnik, T. J., Ridaura, S. L., Andersson, J. A., Baudron, F., & Groot, J. C. J. (2018). Affordances of agricultural systems analysis tools: A review and framework to enhance tool design and implementation. Agricultural Systems, 164, 20–30. https://doi.org/10.1016/j.agsy.2018.03.006
- Dury, J., Schaller, N., Garcia, F., Reynaud, A., & Bergez, J. (2012). Models to support cropping plan and crop rotation decisions: A review. Agronomy for Sustainable Development, 32, 567–580. https://doi.org/10.1007/s13593-011-0037-x
- Ekroos, J., Kuussaari, M., Tiainen, J., Heliölä, J., Seimola, T., & Helenius, J. (2013). Correlations in species richness between taxa depend on habitat, scale and landscape context. Ecological Indicators, 34, 528–535. https://doi.org/10.1016/j.ecolind.2013.06.015
- Elsgaard, L., Borgesen, C. D., Olesen, J. E., Siebert, S., Ewert, F., Peltonen-Sainio, P., Rotter, R. P., & Skjelvag, A. O. (2012). Shifts in comparative advantages for maize, oat and wheat cropping under climate change in Europe. Food Additives & Contaminants. Part A, Chemistry, Analysis, Control, Exposure & Risk Assessment, 29, 1514–1526. https://doi.org/10.1080/19440049.2012.700953
- Filippi, C., Mansini, R., & Stevanato, E. (2017). Mixed integer linear programming models for optimal crop selection. Computers & Operations Research, 81, 26–39. https://doi.org/10.1016/j.cor.2016.12.004
- Foley, J. A., Ramankutty, N., Brauman, K. A., Cassidy, E. S., Gerber, J. S., Johnston, M., Mueller, N. D., O'Connell, C., Ray, D. K., West, P. C., Balzer, C., Bennett, E. M., Carpenter, S. R., Hill, J., Monfreda, C., Polasky, S., Rockström, J., Sheehan, J., Siebert, S., & Tilman, D. (2011). Solutions for a cultivated planet. Nature, 478, 337–342. https://doi.org/10.1038/nature10452
- Hannukkala, A. O., Rastas, M., Laitinen, P., & Latvala, S. (2016). Rhizoctonia solani injuries in oilseed crops in Finland and impacts of different crop management practices on disease incidence and severity. Ann. Appl. Biol, 169, 257–273. https://doi.org/10.1111/aab.12293
- Heikkinen, J., Ketoja, E., Nuutinen, V., & Regina, K. (2013). Declining trend of carbon in Finnish cropland soils in 1974-2009. Global Change Biol, 19, 1456–1469. https://doi.org/10.1111/gcb.12137
- Herzon, I., Auninš, A., Elts, J., & Preikša, Z. (2008). Intensity of agricultural land-use and farmland birds in the Baltic States. Agriculture Ecosystems & Environment, 125, 93–100. https://doi.org/10.1016/j.agee.2007.11.008
- Huusela-Veistola, E., & Jauhiainen, L. (2006). Expansion of pea cropping increases the risk of pea moth (Cydia nigricana; Lep., Tortricidae) infestation. Journal of Applied Entomology, 130, 142–149. https://doi.org/10.1111/j.1439-0418.2006.01047.x
- Jylhä, K., Laapas, M., Ruosteenoja, K., Arvola, L., Drebs, A., Kersalo, J., Saku, S., Gregow, H., Hannula, H., & Pirinen, P. (2014). Climate variability and trends in the Valkea-Kotinen region, southern Finland: Comparisons between the past, current and projected climates. Boreal Environment Research, 19, 4–30.
- Kahiluoto, H., Kaseva, J., Balek, J., Olesen, J. E., Ruiz-Ramos, M., Gobin, A., Kersebaum, K. C., Takác, J., Ruget, F., Ferrise, R., Bezak, P., Capellades, G., Dibari, C., Mäkinen, H., Nendel, C., Ventrella, D., Rodríguez, A., Bindi, M., & Trnka, M. (2019). Decline in climate resilience of European wheat. Proceedings of the National Academy of Sciences of the U. S. A., 116, 123–128. https://doi.org/10.1073/pnas.1804387115
- Korhonen, P., Palosuo, T., Persson, T., Höglind, M., Jégo, G., Van Oijen, M., Gustavsson, A., Bélanger, G., & Virkajärvi, P. (2018). Modelling grass yields in northern climates – a comparison of three growth models for timothy. Field Crops Research, 224, 37–47. https://doi.org/10.1016/j.fcr.2018.04.014
- Kron, W., Löw, P., & Kundzewicz, Z. W. (2019). Changes in risk of extreme weather events in Europe. Environmental Science & Policy, 100, 74–83. https://doi.org/10.1016/j.envsci.2019.06.007
- Lal, R. (2015). Restoring soil quality to mitigate soil degradation. Sustainability, 7, 5875–5895. https://doi.org/10.3390/su7055875
- Lawes, R., & Renton, M. (2010). The Land Use Sequence Optimiser (LUSO): A theoretical framework for analysing crop sequences in response to nitrogen, disease and weed populations. Crop and Pasture Science, 61, 835–843. https://doi.org/10.1071/CP10026
- Liu, X., Lehtonen, H., Purola, T., Pavlova, Y., Rötter, R., & Palosuo, T. (2016). Dynamic economic modelling of crop rotations with farm management practices under future pest pressure. Agricultural Systems, 144, 65–76. https://doi.org/10.1016/j.agsy.2015.12.003
- Luke’s EconomyDoctor. (2019). Retrieved August 30, 2019, from https://portal.mtt.fi/portal/page/portal/economydoctor.
- Luke’s Statistical Services. (2019). Retrieved August 23, 2019, from https://stat.luke.fi/en/.
- Mäkeläinen, S., Harlio, A., Heikkinen, R. K., Herzon, I., Kuussaari, M., Lepikkö, K., Maier, A., Seimola, T., Tiainen, J., & Arponen, A. (2019). Coincidence of high nature value farmlands with bird and butterfly diversity. Agriculture Ecosystems & Environment, 269, 224–233. https://doi.org/10.1016/j.agee.2018.09.030
- Malik, R. S., Seymour, M., French, R. J., Kirkegaard, J. A., Lawes, R. A., & Liebig, M. A. (2015). Dynamic crop sequencing in western Australian cropping systems. Crop and Pasture Science, 66, 594–609. https://doi.org/10.1071/CP14097
- Myyrä, S., & Pietola, K. (2002). Economic importance of parcel structure on Finnish farms. Agricultural and Food Science in Finland, 11, 163–173. doi: 10.23986/afsci.5722
- Niemeläinen, O., Jauhiainen, L., & Miettinen, E. (2001). Yield profile of tall fescue (Festuca arundinacea) in comparison with meadow fescue (F. pratensis) in Finland. Grass and Forage Science, 56, 249–258. https://doi.org/10.1046/j.1365-2494.2001.00271.x
- Peltonen-Sainio, P., Jauhainen, L., & Hannukkala, A. (2007). Declining rapeseed yields in Finland: How, why and what next? Journal of Agricultural Science, 145, 587–598. https://doi.org/10.1017/S0021859607007381.
- Peltonen-Sainio, P., & Jauhiainen, L. (2019a). Risk of low productivity is dependent on farm characteristics: How to turn poor performance to advantage? Sustainability, 11, 5504. https://doi.org/10.3390/su11195504
- Peltonen-Sainio, P., & Jauhiainen, L. (2019b). Unexploited potential to diversify monotonous crop sequencing at high latitudes. Agricultural Systems, 174, 73–82. https://doi.org/10.1016/j.agsy.2019.04.011
- Peltonen-Sainio, P., Jauhiainen, L., Honkavaara, E., Wittke, S., Karjalainen, M., & Puttonen, E. (2019). Pre-crop values from satellite images for various previous and subsequent crop combinations. Frontiers in Plant Science, 10, 462. https://doi.org/10.3389/fpls.2019.00462
- Peltonen-Sainio, P., Jauhiainen, L., Laurila, H., Sorvali, J., Honkavaara, E., Wittke, S., Karjalainen, M., & Puttonen, E. (2019). Land use optimization tool for sustainable intensification of high-latitude agricultural systems. Land Use Policy, 88, 104104. https://doi.org/10.1016/j.landusepol.2019.104104
- Peltonen-Sainio, P., Jauhiainen, L., & Sorvali, J. (2017). Diversity of high-latitude agricultural landscapes and crop rotations: Increased, decreased or back and forth? Agricultural Systems, 154, 25–33. https://doi.org/10.1016/j.agsy.2017.02.011
- Peltonen-Sainio, P., Jauhiainen, L., Sorvali, J., Laurila, H., & Rajala, A. (2018). Field characteristics driving farm-scale decision-making on land allocation to primary crops in high latitude conditions. Land Use Policy, 71, 49–59. https://doi.org/10.1016/j.landusepol.2017.11.040
- Peltonen-Sainio, P., Salo, T., Jauhiainen, L., Lehtonen, H., & Sievilainen, E. (2015). Static yields and quality issues: Is the agri-environment program the primary driver? Ambio, 44, 544–556. https://doi.org/10.1007/s13280-015-0637-9
- Peltonen-Sainio, P., Sorvali, J., & Kaseva, J. (2020). Winds of change for farmers: Matches and mismatches between experiences, views and the intention to act. Climate Risk Management, 27, 100205. https://doi.org/10.1016/j.crm.2019.100205
- Peltonen-Sainio, P., Venäläinen, A., Mäkelä, H. M., Pirinen, P., Laapas, M., Jauhiainen, L., Kaseva, J., Ojanen, H., Korhonen, P., Huusela-Veistola, E., Jalli, M., Hakala, K., Kaukoranta, T., & Virkajärvi, P. (2016). Harmfulness of weather events and the adaptive capacity of farmers at high latitudes of Europe. Climate Research, 67, 221–240. https://doi.org/10.3354/cr01378
- Purola, T., Lehtonen, H., Liu, X., Tao, F., & Palosuo, T. (2018). Production of cereals in northern marginal areas: An integrated assessment of climate change impacts at the farm level. Agricultural Systems, 162, 191–204. https://doi.org/10.1016/j.agsy.2018.01.018
- Renton, M., Lawes, R., Metcalf, T., & Robertson, M. (2015). Considering long-term ecological effects on future land-use options when making tactical break-crop decisions in cropping systems. Crop and Pasture Science, 66, 610–621. https://doi.org/10.1071/CP14135
- Rockström, J., Steffen, W., Noone, K., Persson, Å, Stuart, I. C., Lambin, E., Lenton, T. M., Scheffer, M., Folke, C., Schellnhuber, H. J., Nykvist, B., de Wit, C. A., Hughes, T., Van, d. L., Rodhe, H., Sörlin, S., Snyder, P. K., Costanza, R., Svedin, U., & Falkenmark, M. (2009). Planetary boundaries: Exploring the safe operating space for humanity. Ecology and Society, 14, 32. https://doi.org/10.5751/ES-03180-140232
- Ruosteenoja, K., Räisänen, J., Venäläinen, A., & Kämäräinen, M. (2016). Projections for the duration and degree days of the thermal growing season in Europe derived from CMIP5 model output. International Journal of Climatology, 36, 3039–3055. https://doi.org/10.1002/joc.4535
- Ruosteenoja, K., Räisänen, J., Venäläinen, A., Kämäräinen, M., & Pirinen, P. (2016). Thermal growing season in a warming climate. TERRA, 128, 3–15.
- Schils, R., Olesen, J. E., Kersebaum, K.-, Rijk, B., Oberforster, M., Kalyada, V., Khitrykau, M., Gobin, A., Kirchev, H., Manolova, V., Manolov, I., Trnka, M., Hlavinka, P., Palosuo, T., Peltonen-Sainio, P., Jauhiainen, L., Lorgeou, J., Marrou, H., Danalatos, N., … van Ittersum, M. (2018). Cereal yield gaps across Europe. European Journal of Agronomy, 101, 109–120. https://doi.org/10.1016/j.eja.2018.09.003
- Stoate, C., Báldi, A., Beja, P., Boatman, N. D., Herzon, I., van Doorn, A., de Snoo, G. R., Rakosy, L., & Ramwell, C. (2009). Ecological impacts of early 21st century agricultural change in Europe – a review. Journal of Environmental Management, 91, 22–46. https://doi.org/10.1016/j.jenvman.2009.07.005
- Toivonen, M., Herzon, I., & Kuussaari, M. (2015). Differing effects of fallow type and landscape structure on the occurrence of plants, pollinators and birds on environmental fallows in Finland. Biological Conservation, 181, 36–43. https://doi.org/10.1016/j.biocon.2014.10.034