
ABSTRACT
Multiple lines of evidence call for the use of locally-relevant strategies to guide and support sustainable agricultural intensification while improving development and conservation outcomes. The goal of this study was to identify the ecosystem services from natural and agricultural systems to achieve this aim in the Barotse Floodplain of Zambia. Our methodology utilized a gender-sensitive ecosystem services approach, whereby local knowledge from women and men was harnessed to understand which services and their sources are important. In addition, we identified the various constraints and options people encounter for developing sustainable and nutritious agriculture while achieving conservation outcomes. The results of our study indicate that the floodplain provides a broad range of ecosystem services, which are important for securing local livelihoods and wellbeing. The forests in the uplands and the grasslands in the plains are the primary sources of the 17 provisioning and regulating ecosystem services assessed. Nonetheless, both are often converted to agriculture due to their high soil fertility. We identified opportunities and challenges for sustainable agricultural intensification and development in areas with lower conservation concerns. We discussed the constraints and limitations for promoting sustainable and inclusive agriculture in those areas.
1. Introduction
Agricultural development and intensification remain the primary strategies to attain a wide variety of development outcomes in many geographic regions of the world, including Africa (e.g. Alliance for a Green Revolution in Africa – AGRA, Citation2016). Overly generic and simplistic ‘one option fits all’ policies that promote agricultural development and intensification, however, can have a weak impact on improving nutrition (Carletto et al., Citation2017; Herforth & Ahmed, Citation2015), food security (Anderman et al., Citation2014) and poverty reduction (Jayne & Rashid, Citation2013). Evidence points to such policies eroding biodiversity and negatively impacting on ecosystems (Godfray & Garnett, Citation2014; Rockström et al., Citation2009; Steffen et al., Citation2015; TEEB, Citation2015) and human health and well-being (Díaz et al., Citation2006; Remans et al., Citation2014; TEEB, Citation2015).
Research indicates how some of the gaps for guiding sustainable and inclusive agricultural development can be filled by: 1) emphasizing nutritional and agricultural diversity (rather than simply closing yield gaps) for food and nutrition security (McKenzie & Williams, Citation2015); 2) highlighting the benefits or ecosystem services delivered by natural resources essential for ecosystem functioning (TEEB, Citation2015) and for the well-being of the people who depend on them (Suich et al., Citation2015); and 3) recognizing and incorporating local knowledge and context-dependent constraints for agriculture (Snyder & Cullen, Citation2014; TEEB, Citation2015; Taylor, Citation2014).
An ecosystem services approach can capture how local stakeholders (including those who are often marginalized) understand, perceive, use and benefit from multiple ecosystem services from both natural and agricultural systems (DeClerck et al., Citation2016; TEEB, Citation2015). Applying an ecosystem services lens thus facilitates placing local people’s interests at the core of sustainable development (DeClerck et al., Citation2016) and supports the identification of compatible interventions within their ecological and social contexts (Snyder & Cullen, Citation2014). Common applications of this approach include assessing the potential contribution of agricultural land (Kremen & Miles, Citation2012; Tsiafouli et al., Citation2017), the commodity value of the services provided (Groot et al., Citation2012; Ribaudo et al., Citation2010); the impact of changes in ecosystem services provision on poverty alleviation and well-being (Howe et al., Citation2014; Suich et al., Citation2015), or the potential trade-off on ecosystem service provision under land-use conversion to agriculture or protected area (Wells et al., Citation2018). Nonetheless, the role of the ecosystem services approach in guiding sustainable agricultural intensification remains unexplored, and more specifically, the contribution of this approach to integrate nutritional and agricultural diversity, ecosystem services derived from both natural and managed land while harnessing local knowledge is lacking.
Our study aimed to identify opportunities for novel, locally-relevant, and sustainable agricultural options to achieve joint development and conservation outcomes through an ecosystem services approach. We chose to apply a gender-sensitive ecosystem services approach, placing particular emphasis on the value of women’s and men’s local knowledge. Our study site was located in the Barotse Floodplain in Zambia, an area with high biodiversity conservation value and where agricultural development interventions are currently underway. Two research questions were explored to help identify potential options for sustainable agricultural development in the floodplain: 1) Which ecosystem services, and their sources (natural and agricultural systems) are important for local women and men? and 2) What are the constraints faced by and opportunities for local women and men in developing sustainable and nutritious agriculture?
2. Materials and methods
2.1. Study area
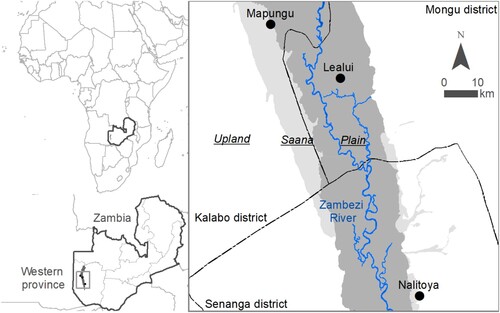
We selected three landscapes around permanent communities located in three districts in the Western Province, Zambia, namely Mongu (Lealui Community), Kalabo (Mapungu Community), and Senanga (Nalitoya Community). The study area is embedded in the Barotse Floodplain, which is a culturally and biologically diverse wetland with an approximate area of 6,365 km2. It is a designated Ramsar site, a Key Biodiversity Area (KBA) and a nominated UNESCO Cultural Landscape. The three communities are located along (south–north) and across (west–east) the floodplain covering a broad range of landscape contexts and ecosystem services within the floodplain ().
Figure 1. Mapungu, Lealui and Nalitoya communities located along the Barotse Floodplain in Western Province, Zambia. Upland (white), Saana (light grey), and Plain (dark grey) are the three main sections in which local knowledge divides the Floodplain. Winkel Tripel projection.
The area for agriculture production in the Western Province represents around 8% of the total area allocated to agriculture in Zambia (Zambia CountrySTAT). The country is expanding the area for agriculture by around 16,409 ha on average per year since 1961, a similar pattern in the African continent with an overall area expansion of 3,000,000 ha per year in the same period (FAOSTAT). The Western Province, particularly the Barotse Floodplain, experiences seasonal precipitation, flood-driven hydrological patterns (longitudinal and transversal) and complex micro-topography. The complex micro-topography delimits eco-types that are land units with well-differentiated vegetation and exposure to either episodic droughts or floods (Del Rio et al., Citation2018; Prins, Citation1980; Wolski, Citation1998). The region has two main seasons (wet and dry) comprised of two overlapping periods. The wet season has a rainy period (October/November to April, long-term avg. precipitation 135.1 mm month−1) and a flooded period (February to April). The dry season (long-term avg. precipitation 8.3 mm month−1) includes a dry cold period (May to July, long-term avg. temperature 19.4 °C month−1), and dry hot period (August to September, long-term avg. temperature 25.4 °C month−1) (Cai et al., Citation2016; Flint, Citation2008; Hijmans et al., Citation2005).
Access to the different eco-types for agriculture or other benefits varies depending on the community location along and within the floodplain (Baidu-Forson et al., Citation2014). Past research has documented some of these eco-types (Baidu-Forson et al., Citation2014; Baidu-Forson et al., Citation2015; Del Rio et al., Citation2018; IUCN, Citation2003; Kajoba, Citation2008; Prins, Citation1980). However, information on the provided ecosystem services is lacking.
2.2. Stakeholders, sample selection and project context
Our study sought to identify how ecosystem services are used during the dry and wet season by women and men living in permanent villages in the floodplain. In this region, people migrate from the plain to the upland following the unregulated Upper Zambezi river’s natural flow (Tweddle, Citation2010). The main economic activities are dependent on seasonal rains that drive an annual flood pulse (Abbott et al., Citation2015; King et al., Citation2003). For instance, people in and around the floodplain have diversified livelihoods such as farming, fishing, cattle grazing for fodder, commercializing timber and products from non-timber and aquatic plants (Cole et al., Citation2015; Rajaratnam et al., Citation2015). Despite the livelihoods diversity, the Western Province has one of the highest poverty rates in the country (Central Statistical Office - CSO, Citation2012), the lowest agricultural productivity (Flint, Citation2008) and experiences a four- to five-month ‘hungry’ season with limited food access (Baidu-Forson et al., Citation2014; Castine et al., Citation2013; Pasqualino et al., Citation2015; Rajaratnam et al., Citation2015).
Our research was embedded in the CGIAR Research Program on Aquatic Agricultural Systems (CRP AAS) that espoused the use of gender-aware approaches (see Cole et al., Citation2014; Douthwaite et al., Citation2017). We collected sex-disaggregated data across all the activities aimed at understanding the extent of ecosystem services knowledge and use by women and men.
2.3. Ecosystem services assessment and inventory
Overall, we evaluated 17 ecosystem services jointly discussed by and selected before the activity with community facilitators and traditional leaders. The selected ecosystem services included nine provisioning, seven regulating and one cultural type aiming to cover the wide use and benefits that women and men obtain from the natural and managed eco-types in the floodplain (). We integrated four complementary activities designed to: a) delimit the areas in and around each community used for the three most important provisioning ecosystem services (fishing, cultivating crops, and cattle grazing) for livelihoods; b) characterize the vegetation and location of the present eco-types around each community; c) identify which eco-types women and men use or access for ecosystem services; and d) characterize crops and limitations to agriculture production in the eco-types used for agricultural purposes. These activities began in July 2014 and were conducted on rotation in the three study communities over the course of two months through focus group discussions and field visits. We used participatory methodologies and actively engaged with partners such as the Ministry of Agriculture and the Barotse Royal Establishment (traditional authority governing Western Province, Zambia) throughout all four activities. We returned in April 2015 and hosted one focus group discussion in each community with women and men together to discuss, validate and complement the information provided during the first round of activities concerning the eco-types’ descriptions, the services they provide and the listed crops in each cultivated eco-type.
Table 1. Ecosystem services assessed per category.
2.3.1. Participatory ecosystem services mapping – delimiting areas accessed for livelihoods: fishing, cultivating crops, and cattle grazing
We conducted participatory ecosystem services mapping exercises in each of the three communities to assess how the areas in and around each community are used for the most important provisioning ecosystem services for local livelihoods. We used a poster-sized (1.07 × 1.07 m) Landsat image (June 12, 2014; 1:70,000 scale) covering a 37 km radius around each community. We conducted meetings with community leaders to share and discuss the research questions and methodologies, followed by three mapping activities with 70 community members and seven traditional leaders (see ). Participants voluntarily joined the mapping activities between July 7–15, 2014, after an open invitation sent one week earlier within each community. Three extension officers and seven community facilitators also joined the three activities. Community facilitators are residents identified as crucial contact people to assist with various research activities under the CRP AAS.
Table 2. Participants involved in the participatory mapping cultivated eco-types characterization and ecosystem services assessment in Mapungu, Lealui, and Nalitoya.
Only one representative per household was included in the mapping activities to avoid double counting of familial cultivated areas. We used different layers of transparent plastic film overlain on the Landsat images and asked participants to identify familiar landscape features (e.g. rivers, roads, ponds) indicating the exact location of their community. Once all group members finished and agreed on the location of reference points, we asked them to identify their fishing, cattle grazing and cultivated areas directly on the image. We verified that map distances (e.g. from the community centre to an identifiable reference point, such as a pond) corresponded to pedestrian travel times by using a participants-based estimation of 4.5 km hr−1 walking speed.
We analyzed the points on the map to identify landscape patterns, differentiating by sex, community, and by each provisioning ecosystem service (fishing, cultivating, or cattle grazing). We calculated the geographic distance between the georeferenced and digitized point allocated by each participant and the community centre (ESRI, Citation2016), assuming that every participant lives in or around the centre of the clustered and often small communities (e.g. the largest community area, Lealui, is around 0.2 km2). We assessed landscape patterns by calculating the standard deviational (1SD) ellipse and quantifying the central tendency, dispersion, and directional trends per activity and by sex (ESRI, Citation2016). We tested mean distance differences with an analysis of variance (ANOVA) and Tukey's ‘Honest Significant Difference’ multiple comparisons of means and 95% of category confidence level (stats package, R Core Team, Citation2016).
2.3.2. Plot sampling – characterizing eco-type vegetation and location
The objective of this activity was to characterize the vegetation, eco-types, and their location across the landscape relative to the annual flood pulse cycle and to support the participatory ecosystem services assessment. Between July 23 and August 16, 2014, we surveyed 91 plots of 10 x10 m located within a 6 km radius of each community. The flooded areas challenged the random sampling, and therefore, we limited the sampling to areas flooded with water to a height of less than 50 cm. We visited sites with an extension officer from the Ministry of Agriculture and Livestock and a farmer (selected by the community) to ensure local knowledge was incorporated. We photographed and located each plot with a Monterra GPS and recorded field information using the doForms app (www.doforms.com). Recorded information included the eco-type name (based on local knowledge and names), geographic coordinates, and land cover (i.e. bare ground area and vegetation). We used this information to classify eco-types as ‘cultivated’ (if used for cultivating activities), ‘native vegetation’ such as grasslands, forests or woodland (not used for cultivation) and ‘aquatic’ (water-related). The plot data were used to create a complete list of the eco-type present around each community for the following activities and to create a 30 m resolution eco-type map with Landsat 8 Enhanced Thematic Mapper (TM) with an overall classification accuracy of 81% (Del Rio et al., Citation2018).
2.3.3. Ecosystem services assessment – identifying eco-types used or accessed
We recorded 17 ecosystem services jointly discussed by and selected before the activity with community facilitators and traditional leaders. To facilitate explaining each service during the activity, we asked about provisioning services as ‘where do you go to get … ?’ and regulating and cultural services as ‘which eco-types are important for or to … ?’ (). On August 13–19, 2014, we conducted three ecosystem services assessments with 31, 26, and 20 participants from Mapungu, Lealui, and Nalitoya, respectively who also joined voluntarily the discussion groups ().
We used coded cards with a unique identifier assigned to each participant (name and participant’s sex), with a question related to each ecosystem service (in English and Silozi, the local language) and a symbol indicating either the dry or wet season to assess the timing of service delivery. As such, we provided each participant with 34 coded cards and asked them to place these cards on the eco-type from which they receive the service in question. Placards distributed in the meeting area represented each eco-type identified during plot sampling and participatory mapping activities, including cultivated, native vegetation, and aquatic eco-types ().
Table 3. Eco-type description complemented and validated by participants in 2015.
We asked all participants to place the coded cards sequentially starting with provisioning services (except cultivated crops), followed by cultivated crops, and finally regulating and cultural services. Participants followed the same sequence for both dry and wet seasons. We provided ‘field’ coded cards to assess cultivated crops separately, which facilitated data collection on the number of fields that women and men cultivate each season and on the most commonly used eco-types for cropping activities. We provided additional coded cards with ecosystem services to those who assigned two or more sources to a particular ecosystem service. We pre-tested the activity to ensure clarity in the local context, and three facilitators provided constant support to participants during the activity. We excluded firewood and charcoal, ornamental, pollination, pest control, and soil erosion control during Mapungu ecosystem services assessment due to time constraints. We distributed 1,736 coded cards, and participants requested an additional 256 cards (1,992 in total) to assess 17 ecosystem services (except cultivated crops). Participants requested 330 field-coded cards in total to assess cultivated crops.
2.3.4. Cultivated eco-type characterization – characterizing limitations, and opportunities
Women and men in each community characterized the eco-types used for agricultural purposes including planted crops, perceived flood regime, drought regime, soil fertility, soil moisture, distance to water for manual irrigation, and planting season. We held this participatory activity the same day as the ecosystem service assessment with 31, 18, and 20 participants from Mapungu, Lealui, and Nalitoya, respectively, between August 13–19, 2014 (). We used response frequency across the six focus groups to assess each cultivated eco-type’s perceived fertility, soil moisture, and proximity to water bodies for manual irrigation.
We classified the listed cultivated crops into 11 plant-based food groups used for assessing dietary diversity (Kennedy et al., Citation2013). Furthermore, we identified neglected and underutilized species (NUS), which are often overlooked in agricultural intensification but have proven potential for enhancing nutrition and livelihoods (Padulosi et al., Citation2011). Some examples of these NUS include amaranth (Amaranthus spp.), African cabbage (Cleome gynandra) or African eggplant (Solanum aethiopicum). We followed the NUS list compiled by Delêtre et al., (Citation2012).
We applied the non-parametric Kruskal–Wallis and Dunn’s test to assess post hoc differences between combinations of sex, season, eco-type and community for data collected in 2.3.3 and 2.3.4. For all the analyses, we used R software (Dunn’s test package; Dinno, Citation2017) and considered statistical significance at P-value < 0.05.
3. Results
Lozi knowledge divided the floodplain into three sections: (1) plain, (2) Saana – transition zone and (3) upland area (). Participants often accessed 19 eco-types within the three sections and around the communities’ landscape classified as cultivated (ten), native vegetation (six), and aquatic (four) (). The following results focus on five native vegetation types since the clustered woodland (Libuta) was added after a communities’ feedback meeting held in 2015 ().
3.1. Delimiting areas accessed for livelihoods: fishing, cultivating crops, and cattle grazing
The maximum distance participants travel for fishing, cultivating, and cattle grazing is 15.6 km (). We found significant differences in distances travelled among participants from the three communities (df = 2, P-value=0.04) and among ecosystem services for livelihoods (df = 2, P-value=0.00). For example, lowland participants (Lealui) reported travelling the longest distances for cropping activities (eight kilometres), whereas, upland participants (Mapungu and Nalitoya) reported travelling three and two kilometres less than those in Lealui, respectively ().
Figure 2. Mean geographic distance (standard error – SE and number of points – n) from the community centre to the areas used by women and men for cropping, fishing, and cattle grazing activities. Ellipses indicate the 1st standard deviation and p-adjusted obtained with post hoc Tukey’s Honest Significant mean difference.
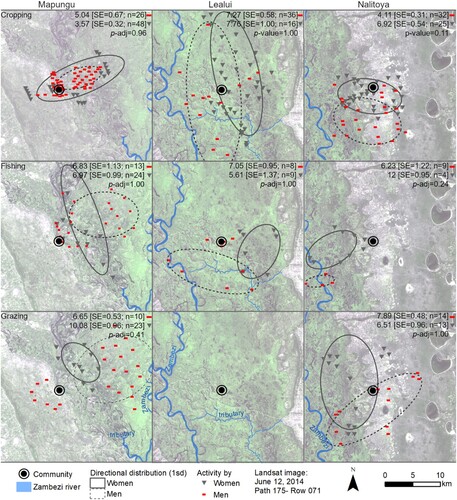
In general, women participants tend to travel 1.4 km longer and 2.9 km shorter distances than men participants in Mapungu and Nalitoya, respectively. In Lealui, sex-differences were 0.4 km (), with an overall average distance statistically non-significant (df = 1, P-value=0.21) between women and men across communities and activities. The location for fishing activities differs for women and men, however. Women across communities indicated visiting areas further away from the main river and used shallower areas for catching small fish. Men, on the contrary, indicated areas closer to the main river or big branches to fish large riverine species in deeper waters ().
3.2. Ecosystem services assessment – characterizing and identifying eco-types used or accessed
Natural vegetation and aquatic eco-types provide the bulk of the ecosystem services across the three communities with an overall average of six and four ecosystem services provided, respectively, by each eco-type group. The importance of each group type tends to vary across communities, season and sex, although our results suggest non-statistical differences for seasons and sex (Dunn’s test P-value >0.05). Lealui is one exception where women reported significantly more ecosystem services than men (Dunn’s test, Z statistic [Men – Women] = −1.72, P-value = 0.04) (). We also found that in Mapungu (upland – western side) aquatic eco-types provide more than the other group types, whereas in Nalitoya (upland – east side) natural vegetation types provide more than the other group types. In the lowland, Lealui, natural vegetation provides slightly more ecosystem services than the aquatic group type with non-statistical differences (). Overall, cultivated eco-types provided the lowest number of ecosystem services other than cultivated crops ().
Table 4. Average number (and SE standard error) of ecosystem services provided (out of the 17 assessed except cultivated crops) by eco-types during the dry and wet season according to women (W) and men (M). Eco-types are grouped by aquatic (A), cultivated (C) and Native vegetation (N). Pairwise comparisons located on the right. Significant P-values in italics.
Among the natural vegetation eco-types, the upland forests were indicated as the primary source of almost half of the ecosystem services assessed by participants who allocated > 30% of the cards to this eco-type group (). The flooded grasslands were also important for participants, mostly for regulating services (). The two most important native vegetation eco-types (upland forests and flooded grasslands) also provided other ecosystem services, only to a lesser degree (15–30% cards assigned) (). Participants indicated that Papyrus marsh is visited to obtain ornamental plants whereas other ecosystem services were provided to a lesser extent by eco-types such as Reed marsh (i.e. wildlife habitat) and lowland forest (i.e. materials for agriculture and construction) ().
Figure 3. Percentage of allocated cards across the ten cultivated, five native vegetation (Libuta is excluded here since it was added in 2015) and four aquatic eco-types as the source of each ecosystem service. Participants who were unsure about the sources of the ecosystem service or the ecosystem service per se withheld the cards for a particular eco-type. The numbers in parentheses after each ecosystem service indicate the number of additional cards requested by participants to indicate two or more sources. Data labels are displayed for percentages above 15%. * Ecosystem services not assessed in Mapungu due to time constraints, then percentage values are only for Nalitoya and Lealui. See for eco-type/icon description.
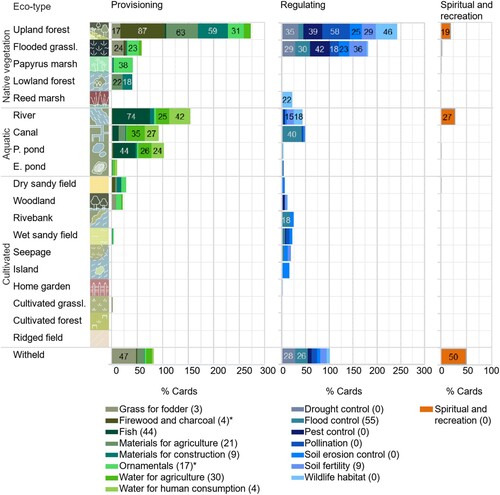
Aquatic eco-types (except ephemeral ponds) were considered important for providing water-related ecosystem services (e.g. fish, water for agriculture and human consumption, and flood control). The river also provided, to a lesser extent, other non-water related ecosystem services such as wildlife habitat, soil fertility, and spiritual and recreation ().
The river (aquatic) and the upland forest (natural vegetation) are the two main sources of spiritual and recreational ecosystem services (). Almost all women participants and 50% of men participants in Lealui visit the river for spiritual and recreational purposes (). On the contrary, all women in Nalitoya visit the upland forest and men visited both the river and the upland forests during spiritual and recreational time.
Few participants indicated using or considering important cultivated eco-types for ecosystem services beyond cultivated crops. For example, 18% of the cards indicated flood control is provided by the riverbank eco-type, the only cultivated eco-types with >15% of the cards assigned ().
Ecosystem services such as spiritual and recreation, grass for fodder, drought control, and flood control had the largest number of withheld cards (above 26%; ). Participants withheld grass for fodder cards due to their lack of cattle or herding activities as indicated during the activity and in line with the mapping results (), whereas withheld cards for the other ecosystem services was due to participants’ lack of certainty about the ecosystem services or its source. The ecosystem service with the largest potential divergence about the importance of each eco-type was flood control. Eight eco-types had less than 5% of the cards allocated, and participants requested the largest number of additional cards (55) for this service (). Likewise, in Lealui, men withheld around 50% of the cards for the eight regulating and cultural services, as they were unsure where to place them (). Participants from Mapungu withheld an eco-type to spiritual and recreational purposes (), highlighting the different notions of recreation and spiritual values between women and men and across the floodplain.
3.3. Cultivated eco-type characterization – characterizing limitations, and opportunities
3.3.1. What cultivated eco-types are most commonly used per season and by whom?
Productive agriculture in the Floodplain is likely challenged by the distances travelled for cropping () and by the number of fields planted (2–4 fields on average) by each farmer. For example, participants in Lealui and Nalitoya tend to plant the same number of fields across seasons, but women cultivate on average 1.5 times more fields than men (a). On the contrary, women, and men participants in Mapungu reported cultivating the same number of fields with an average of five fields during the wet and one field during the dry season (a). Results also indicate that participants’ field eco-types tend to vary across communities, seasons, and, in some cases, by sex. For example, ridged fields and seepage were cultivated eco-types present only in the upland communities, Mapungu and Nalitoya, respectively (b). Nonetheless, differences among the number and cultivated eco-types across seasons (χ2=3.69; df = 1, P-value=0.06), between women and men (χ2=0.01; df = 1, P-value=0.94) and across communities (χ2=4.3; df = 2, P-value=0.12) were statistically non-significant.
Figure 4. a) Average number of fields planted by women and men, and during the dry (sun) and wet (drop) season in each and across all three Communities. b) Percentage of field cards assigned to each cultivated eco-type by women and men from Mapungu, Lealui, Nalitoya and across all three Communities indicating each participant’s cultivated fields during the dry (sun) and wet (drop) season. Percentages above 100% indicate that participants have two or more fields on the same eco-type. See for eco-type/icon description.
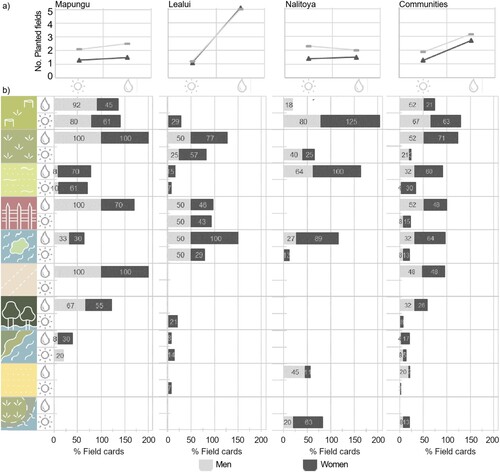
The only eco-type cultivated during both seasons by women and men from Mapungu is the cultivated forests, although women (>30%) also seem to use wet sandy fields for cultivating crops during both seasons and use the Riverbanks mainly during the wet season. During the wet season cultivated eco-type availability is greater, with five out of the ten cultivated eco-types used by >30% of participants from Mapungu (b).
In Lealui, three cultivated eco-types (cultivated grasslands, home gardens, islands) seem to be the most commonly cultivated ones during both seasons among women and men participants’ fields (>25%). Nonetheless, a small proportion of women from this community also mentioned cultivating different eco-types during both seasons (i.e. wet sandy fields, riverbanks) and some eco-types exclusively during the dry season (cultivated forests, woodlands, dry sandy fields) (b).
In Nalitoya, very few participants reported having fields on the same eco-type during both seasons. The fields of more than half of the women and men participants were located on wet sandy fields during the wet season and cultivated forest during the dry season (b). Women and men from Nalitoya seem to cultivate different eco-types. For example, women’s fields were commonly on seepage (dry season) and islands (wet season) whereas men’s fields were on dry sandy fields (wet season), cultivated forest (wet season) and cultivated grasslands (dry season).
3.3.2. What are the characteristics of the commonly used cultivated eco-types?
Sustainable agriculture in the floodplain is challenged by the characteristics of the most commonly used cultivated eco-types, such as cultivated forest and cultivated grasslands, which are the result of converting natural vegetation eco-types. Perceived soil fertility in the cultivated forest is divided, where fertile cultivated forest likely refers to recently converted land while low fertile cultivated forest refers to land cultivated for some years. Cultivated grasslands, on the other hand, are perceived as fertile to very fertile, close to the water, and to have high to moderate soil moisture (a-c). The limitations to agriculture production in these two cultivated eco-types are linked to low soil moisture, limited water accessibility for manual irrigation in the cultivated forest (b-c) and the high flood risk in cultivated grasslands (∼7 months flooding period) (e).
Figure 5. Characterization of cultivated eco-types according to women and men participants from Mapungu (western upland), Lealui (Plain) and Nalitoya (eastern upland). a-c) indicates the agreement among gender-specific focus groups about soil fertility, soil moisture and eco-type proximity to water for manual irrigation; d-e) indicates perceived flood and drought duration in each community and by gender; h) indicates the total number of crops and food groups planted across communities in each eco-type.
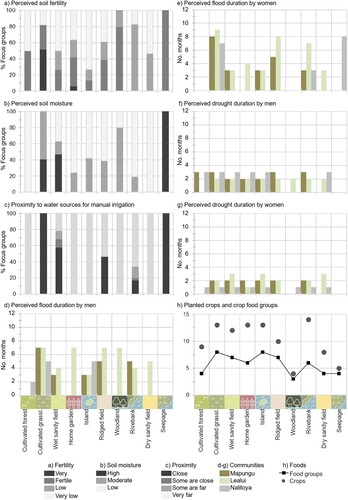
Other available and commonly cultivated eco-types (i.e. wet sandy fields, home gardens, islands) challenge crop productivity due to the low soil fertility, soil moisture and limited accessibility to water sources for manual irrigation (a-c). Cultivating in these eco-types requires careful timing since they are flooded from three to seven months out of the year, except for home gardens in the upland areas where it never floods (d-g).
The least commonly cultivated eco-types across the floodplain (ridged fields, woodlands, riverbanks, dry sandy fields, and seepage) were characterized by participants with low to very low soil fertility, moderate to low soil moisture and limited access to water for manual irrigation, except for woodland and seepage, which have fertile soils according to participants. The least commonly cultivated eco-types are exposed to floods from three up to eight months out of the year except for dry sandy fields that flood only in the plain according to most of the participants. Participants perceived that drought duration varies between one to three months out of the year along the floodplain and regardless of the cultivated eco-type and its location (f-g).
We found divergent perceptions on exposure to floods and floods duration between women and men, particularly in the upland communities. For example, men from Nalitoya mentioned that cultivated forest floods during August through to November, which corresponds to the end of the dry season (d-e).
3.3.3. Are cultivated eco-types providing nutritious crops?
Participants indicated cultivating 25 crops, which can be grouped into nine out of the 11 plant-based food groups defined by the dietary diversity guidelines (Kennedy et al., Citation2013). Maize (cereal) is the most common crop cultivated in nine eco-types across communities and by women and men participants (). Participants listed 13 extra crops during 2015 discussions for a total of 38 crops, 17 neglected and underutilized species (NUS) and nine food groups excluding oils and fats, and spices and condiments (Appendix 1).
Figure 6. Crops planted across the ten cultivated eco-types during the sex-specific (women-♀; men-♂) focus groups characterizing each cultivated eco-type. Food groups includes dark green leafy vegetables (![]()
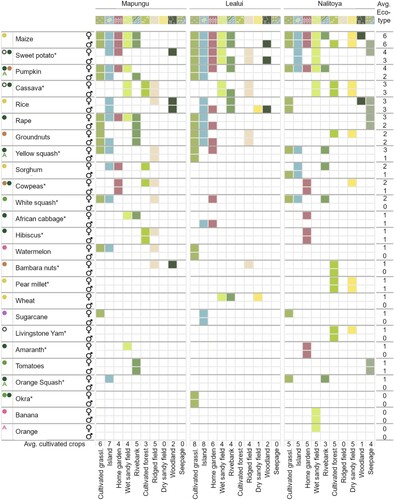
We found the highest number of planted crops contributing to six up to eight food groups in the high flood risk (cultivated grasslands) and elevated areas with low to moderate flood exposure (i.e. wet sandy fields, home gardens, islands, and ridged fields) cultivated eco-types ( h, and 6). Less commonly cultivated eco-types (and perceived as fertile) such as seepage (Nalitoya) and woodlands had the lowest number of planted crops including bambara groundnuts, maize, rice and sweet potato ( h and 6).
Women participants (mainly from upland communities) listed to plant more crops than men participants, including additional food groups and neglected and underutilized species (NUS). For example, in Mapungu, women listed ten additional crops (four NUS), which added three food groups (fruits, other vegetables, and sweets). Similarly, women in Nalitoya listed eight additional crops (one NUS), which added three food groups (sweets, vitamin A-rich fruits and vegetables and tubers). Whereas in the plain (Lealui), women only listed two different crops (including one NUS) and men listed one different crop ().
4. Discussion
The Barotse Floodplain is at an early stage of following the conventional agricultural development pathway to increase food security through intensified, external input-dependent and conventional mono-cropping systems with cash crops such as hybrid maize and rice (e.g. IFDC, Citation2013). In particular, the country’s maize-centric policies supporting input subsidies and direct market support had a marginal contribution to reducing food security and poverty and, negatively affect crop diversification (Mofya-Mukuka & Hichaambwa, Citation2018). Hence, how agricultural transformation and development occur matters for the floodplain's ecosystem sustainability and the local and downstream beneficiaries. Here we discuss locally-relevant challenges and options to sustainable agricultural development for jointly achieving development and conservation outcomes.
4.1. Eco-types for livelihoods, well-being, and conservation requires an orchestrated landscape planning
Participants face the trade-off of using natural vegetation eco-types (e.g. upland forest and flooded grasslands) for obtaining multiple ecosystem services or converting those to agriculture due to the rich soils. The low soil fertility of the Kalahari sands throughout the floodplain is improved by the deposition and accumulation of organic matter, either through floods or native vegetation. For this reason, shifting cultivation is a common practice in the region with a two to four-year production cycle followed by a fallow period of six years or more, and then, crop production again. However, full forest regeneration would take at least 30 years (Wolski, Citation1998). In the mid-Zambezi, similar practices led to changes in tree species composition and diversity with negative impacts on biodiversity (Tambara et al., Citation2012a, Citation2012b) and unknown impacts on ecosystem services provision.
Grassland conversion to agriculture compromises other important contributions such as a) primary food source for livestock after floods recede (Baidu-Forson et al., Citation2014; Flint, Citation2008), b) key habitat area for wildlife in the plain and c) nutrient-rich sources for fish spawning after floods recede and nutrients are deposited (Flint, Citation2008). For instance, grasslands conversion could worsen current declines in catch rates, fish diversity, and population sizes experienced throughout the floodplain (IUCN, Citation2003; Tweddle, Citation2010; Tweddle et al., Citation2014), as well as further cascading and limiting the provision of other ecosystem services from aquatic eco-types such as fishing activities, water for human consumption and, recreation and spiritual purposes. Besides, promoting agriculture in the grasslands would expose farmers to larger crop failure risks since the flood onset in the plain is becoming harder to predict due to more erratic precipitations according to meteorological data (Flint, Citation2008), local perception (Rajaratnam et al., Citation2015) and remote sensing time series analysis (Cai et al., Citation2016).
Despite the reduction on ecosystem services provision and benefits, the rate of native vegetation eco-type conversion is increasing due to large-scale road construction (Laurance et al., Citation2015), national agricultural investments (IFDC, Citation2013), climate change (Gaughan & Waylen, Citation2012) and migration (Flint, Citation2008). These factors are jointly challenging the capacities of traditional authority and local government to continue stewarding the biodiversity and ecosystem services in the Barotse Floodplain, the second largest wetland in Zambia (Cai et al., Citation2016).
The intertwined drivers of change and the complex trade-offs between ecosystem services demand looking beyond ‘agriculture’ and ‘conservation’ as two separate challenges. Several local, national, and international stakeholders are directly or indirectly shaping the future sustainable use of the Barotse Floodplain, for example, international conservation figures (IBA/KBA, Ramsar, Cultural Landscape by UNESCO), regional alliances for development (e.g. AGRA), governmental sectors (e.g. agriculture and nutrition) and the Barotseland Royal Establishment. Given that the overall interest is a sustainable, resilient, and productive floodplain then a joint and orchestrated coordination among stakeholders for fostering interventions is required to increasing the synergies while softening the trade-offs amongst multiple ecosystem services at the landscape level (Fiedler et al., Citation2008). All stakeholders’ agendas could be better articulated by integrating the traditional place-based knowledge for jointly planning a sustainable future of the Barotse Floodplain for livelihoods, well-being, and conservation.
4.2. Targeted agroecological intensification and crop diversity for year-round production and nutrition security
Agricultural development in landscapes with such high eco-type diversity is doomed to fail if ‘one size fits all’ type of solutions are pursued (Snyder & Cullen, Citation2014; TEEB, Citation2015). Expanding agriculture across the whole floodplain will cascade in unintended negative impacts for local people and wildlife (mammals, birds, and amphibians) in the floodplain, downstream dependent ecosystems such as the Caprivi Strip (Pricope, Citation2013) and economic sectors such as hydropower (Beilfuss, Citation2012).
Meanwhile, nutrition and food security all-year-round remains a top priority in this region with a long and intense ‘hungry’ season (see Rajaratnam et al., Citation2015). Eco-types providing a lower number of ecosystem services and exposed to moderate to low flooding risk according to local perception offer great potential for agriculture development if constraints are addressed. Some of the identified constraints in the region include timely access to low-cost, high-quality, and locally-adapted seeds or planting material, equipment, and early warning systems (Baidu-Forson et al., Citation2014). For example, early or late planting in eco-types with a narrow window (e.g. seven months) for planting and growing will likely lead to crop failure.
Likewise, eco-types available for cropping activities during the flooding season (except upland forest) could produce nutritious food during the ‘hungry’ season with potentially low impact on ecosystem services provisioning (e.g. wet sandy fields). Nevertheless, soil fertility and limited water sources for manual irrigation also constrain sustainable agricultural development in those eco-types. Addressing soil fertility conventionally through heavily subsidized input programmes (e.g. that supply inorganic fertilizers) could lead to run-off and leaching instead of the desired fertilizer gradual nutrient release due to the low or null attention to fertilizer efficiency in poor and acidic soils (Jayne & Rashid, Citation2013; Sheahan & Barrett, Citation2017), which is the case in the Barotse Floodplain. Similarly, the over-allocation of water resources for irrigation in a region with more frequent and extreme drought events could compromise the resilience of the floodplain (Chikoore & Jury, Citation2010; Colloff & Baldwin, Citation2010; Gaughan & Waylen, Citation2012).
Local people already perceive crop diversity as a strategy to mitigate the recurring flood, drought, and market access risks (Dierksmeier et al., Citation2015). Likewise, the Zambian government recognizes the role of crop diversification in achieving food security, improving nutrition status and mitigating risk although on the ground interventions remain maize-centric (Mofya-Mukuka & Hichaambwa, Citation2018). It is necessary to explain why maize remains the most commonly planted crop across cultivated eco-types in the floodplain, although other crops and crop varieties are also currently being cultivated (e.g. Baidu-Forson et al., Citation2015). We found that planted crops and varieties include at least 17 neglected and underutilized species (NUS) and cover nine out of the 11 plant-based food groups defined by the dietary diversity guidelines. However, the optimal combination of local crop species and varieties in multiple cropping systems for year-round and long-term production is missing. Further innovation and field test are required for identifying viable multiple cropping systems for each eco-type, season and that responds to the context of both women and men in each community.
Therefore, efforts for restoring and maintaining ecological processes through agroecological intensification seem a better fit for the floodplain context (e.g. Duru et al., Citation2015a, Citation2015b). In particular, strategies such as multiple cropping or conservation agriculture can maintain and improve the provision of ecosystem services such as food production, soil fertility, and soil moisture (Gaba et al., Citation2014; Nicol et al., Citation2015; Umar et al., Citation2012). Agroforestry, also uncommon in the floodplain, could improve food and nutrition security (Kiptot et al., Citation2014) and reduce the pressure on the remnant forest by providing services such firewood, wild fruits, fodder and soil fertility (Akinnifesi et al., Citation2006).
4.3. Women and men use and understand the floodplain similarly but differently: implications for sustainable agriculture
Our results suggest that the differences in how women and men use and understand the floodplain are overall statistically non-significant (potentially linked to the small sample size). Nonetheless, some specific and identified differences are relevant for developing strategies or programmes to support sustainable agriculture development that are gender-sensitive. For example, women and men access the same eco-types for provisioning ecosystem services although they tend to access them in different parts of the landscape, resulting in a considerable disparity between the two groups and implications for income generation and nutrition (Cole et al., Citation2014, Citation2015; Rajaratnam et al., Citation2015). One such example is particularly marked in fishing activities. Distances to fishing resources are similar, yet each group accesses different products (e.g. small vs. large fish, by women and men, respectively – see also Cole et al., Citation2015). Likewise, crops (including diverse NUS) and fields cultivated by women potentially complement household diets with essential nutrients such as vitamin A. Ignoring the importance of women’s crops on household nutrition security and focusing exclusively on cash crops could exacerbate intra-household power dynamics and lead to increased food insecurity (Vargas Hill & Vigneri, Citation2011).
Other specific aspects that could challenge the adoption of sustainable agricultural practices in this region includes the 1) reduced labour availability during the dry season particularly experienced by women in the upland, and 2) the distances covered by farmers to carry out activities and to monitor the multiple planted and scattered fields. Labour scarcity is likely stronger in the upland communities since men are more prone to dry season migration for fishing, confirmed by womens’ more accurate knowledge about eco-type drought patterns than their male counterparts. The population density in the plain increases fourfold during the dry season (wet: <5; dry: 21 people per km2) due to seasonal human migration related to fishing, subsistence farming and cattle grazing (Cole et al., Citation2018; Mweemba et al., Citation2012). Diversifying livelihoods by planting various fields on different eco-types is a common strategy in the study area to reduce the risk of food insecurity due to drought or floods. Nonetheless, this strategy renders constant management and monitoring of crop growth difficult given the distances that farmers need to travel among fields and activities (e.g. fishing and cropping areas).
For instance, the dynamic floodplain requires improved access to appropriate low-cost labour-saving technologies (e.g. through access to oxen and ploughs), while considering the potential labour demand that alternative practices such as conservation agriculture can pose to farmers (e.g. Andersson et al., Citation2015; Umar et al., Citation2012). This is particularly relevant for women since, in the Western Province, the percentage of female-headed households is greater than the national average (CSO, Citation2012; see also Cole et al., Citation2015). For instance, careful attention is required as the evidence suggests that female-headed households tend to have greater difficulty in adopting practices and crops that require more resources (e.g. cattle for manure, or money for agricultural inputs or labour) (Ndiritu et al., Citation2014).
4.4. Study considerations
Participants’ explanations to show their understanding of the nexus between ecosystem services and eco-types were particularly clear for provisioning services, but less so for regulating services, which is common in the ecosystem services research grounded in participatory work (e.g. Jones et al., Citation2019; Wells et al., Citation2018). Some regulating services remain difficult to grasp, despite the discussions held during the participatory activities. For example, canal, Riverbank, and grasslands are the primary eco-types listed by participants as the main source for flood control, although other eight eco-types had less than 5% of the cards allocated, and participants requested the largest amount of additional cards for this service, suggesting divergences among participants about the role of other eco-types providing this particular service. Another example includes the indication by 19 participants from Nalitoya that the upland forest provides water for agriculture. Rather than water per se, participants referred to soil moisture as indicated by the larger number of fields planted in the cultivated forest during the dry season. Interestingly, participants’ rationale for justifying the key role of upland forest for pollination, drought control, and soil fertility, is based on local observations and knowledge such as ‘trees suction water’, ‘leaves and branches return to the soil’, or ‘there are good and bad animals and insects for agriculture and humans that live in the Mushitu [upland forest]’. The proposed methodology can be further refined to capture the direct link between ecosystem services and wellbeing as proposed by Jones et al. (Citation2019).
5. Conclusion
We identified a wide range of ecosystem services provided by the Barotse Floodplain and its various eco-types that are important for local people’s livelihoods and well-being. Expanding agriculture in the most commonly cultivated eco-types implies converting forest and grasslands, which currently provide the bulk of the ecosystem services assessed. We found eight cultivated eco-types that are less important for ecosystem services provision, according to study participants. The alternative cultivated eco-types offer great potential for sustainable and inclusive agricultural development if constraints such as low soil fertility, low soil moisture, and limited access to water for manual irrigation are addressed. In the context of the dynamic Barotse Floodplain, efforts fostering sustainable development through agriculture should also consider the challenges farmers face such as long travel distances to their fields, the gender differences in use and knowledge of the floodplain and limited labour availability, particularly during the dry season. Besides, tapping into the use of local crop diversity through multiple cropping systems, could lead to a sustainable floodplain that provides nutritious food and other multiple ecosystem services year-round.
The ecosystem services approach emphasizing local knowledge, and agricultural diversity is, to our knowledge, rarely used for guiding sustainable agricultural development. The proposed methodology responds to the multiple lines of evidence calling for novel and locally-relevant strategies that guide sustainable and inclusive agricultural development for jointly improving food security, nutrition, environmental function and conservation.
Acknowledgments
This work was possible thanks to the support from: Zambian Ministry of Agriculture and Livestock particularly: Jaba Kabesanu and Sibeso Mulele; Community Extension Officers: Ruth Choongwe, Adrian Mususuka, Bornface Minganja. Participants / Field visits: Susiku Nusiku, Mayumbelo Linanda, Kelvin Musiula, Mumeka Lubinda, Savanjy Mulemwa. Community facilitators, participants from Nalitoya, Sifuna, Liangati, Lealui, and Mapungu, and AAS Barotse Hub team. We are grateful to Verena Nowak for providing inputs on the food group information. Our research is funded by multiple sources, including the CGIAR Research Programs on Water, Land and Ecosystems - WLE; Aquatic Agricultural Systems - AAS; and Agriculture for Nutrition and Health – A4NH. Special thanks are extended to Olga Spellman (Bioversity International) and Daniella Blake for their complete revision and editing of the manuscript, and to other reviewers who provided comments and suggestions that significantly improved the manuscript. We are grateful to the graph designer, Nebai Hernandez, for creating the icons and contributing to improve data presentation and interpretation.
Disclosure statement
No potential conflict of interest was reported by the author(s).
Additional information
Funding
Notes on contributors
Natalia Estrada-Carmona
Dr. Natalia Estrada-Carmona is an Associate Scientist with The Alliance of Bioversity International and the International Center for Tropical Agriculture (CIAT). Her research focuses on estimating, through modeling and participatory approaches, agrobiodiversity's contribution to multifunctional and sustainable farms and landscapes. Natalia is a co-lead of the flagship on Enhancing Sustainability across agricultural systems of the CGIAR research program on Water, Land, and Ecosystems (WLE). She believes that agriculture can play a pivotal role on achieving sustainability goals, but only through multidisciplinary and systems research that potential will be untapped. Natalia has contributed to projects in Latin America and the Caribbean (Costa Rica, Cuba, and Colombia), Africa (Zambia and Burkina Faso) and Asia (Viet Nam). She has a Ph.D. in natural resources management from the University of Idaho, US and CATIE and holds a MSc on environmental socioeconomics from CATIE, Costa Rica.
Simon Attwood
Dr. Simon Attwood is the Director of Land Conservation in the Department of Environment, NEOM, and an Honorary Research Fellow at the Alliance of Bioversity and CIAT. He is committed to maintaining and increasing biodiversity in multifunctional landscapes, generating and harnessing the many benefits that functioning ecosystems provide free of charge, and bringing increased awareness to both the plight and the colossal benefits of nature to a wide audience. He is particularly interested in how to increase and improve food production quantity, quality and diversity through the judicious conservation and use of biodiversity in agricultural landscapes. He is fortunate enough to have undertaken this work in some stunning parts of the world, including Australia, SE Asia, southern Africa and the Red Sea coast.
Steven M. Cole
Dr. Steven M. Cole is a Senior Scientist and Gender Research Coordinator for the International Institute of Tropical Agriculture. He obtained his PhD in Biological Anthropology from the University of Arizona. He also holds a MSc degree in Agricultural and Resource Economics and a BSc in Health and Nutrition. His research employs mixed methods and approaches to better understand social and gender dynamics in rural, agricultural contexts. His latest research involves designing and piloting transformative approaches to overcome gender inequalities in different agricultural development outcomes. He led the social science research for World Fish in Zambia from 2013 to 2019, integrating gender and other social science perspectives in aquaculture, small-scale fisheries, value chains and nutrition research.
Roseline Remans
Dr. Roseline Remans is a Senior Scientist with The Alliance of Bioversity International and the International Center for Tropical Agriculture (CIAT). Her research focuses on measuring and managing biodiversity in food systems for healthier diets, better livelihoods and environmental sustainability. Her approach is cross sectoral, linking agriculture, nutrition, and environment, and with public and private sector applications in Sub-Sahara Africa, Asia, Europe and the US. Roseline is a co-principal investigator of the Agrobiodiversity Index; a co-lead of the Consortium for Improving Agricultural Livelihoods in Central Africa (CIALCA), and a co-lead of the flagship on Enhancing Sustainability across agricultural systems of the CGIAR research program on Water, Land, and Ecosystems (WLE). She is also a contributor to the Food Lab Accelerator on Food, Agrobiodiversity, Clarity and Transparency (FACT). Before joining the Alliance, Remans was a Marie Curie fellow and research scientist at the Earth Institute of Columbia University in New York (2008-2013) and Addis Ababa (2013 -2016). She has a PhD in Biosystems engineering from KULeuven (2007) with field work and applications in Cuba, Mexico and Colombia.
Fabrice DeClerck
Dr. Fabrice DeClerck is the Science Director of EAT and a Senior Scientist at the Alliance of Bioversity and CIAT. He is passionate about biodiversity and food and firmly believes that biodiversity is the one natural resource we need to use more of. The lack of diversity in food, is a fundamental lack of imagination. He believes we need bold biodiversity targets that spare at least half of nature globally from agriculture, to deeply embedding biodiversity in regenerative agriculture, and richly increasing the diversity of foods on our plate as a celebration of nature, culture, and health. He considers himself extremely privileged to have worked with and learnt from farmers and food system actors from across the global. He is convinced that diverse food is our best bet at a healthy, regenerative, and just society living within environmental limits.
References
- Abbott, J. G., Hay, C. J., Naesje, T. F., Tweddle, D., & van der Waal, D. C. W. (2015). Rain and copper: The evolution of a fish marketing channel in a rapidly changing region of Southern Africa. Journal of Southern African Studies, 41(1), 430–430. https://doi.org/10.1080/03057070.2015.1028256
- AGRA. (2016). Africa Agriculture Status Report 2016 Progress towards Agricultural Transformation in Africa, Africa Agriculture Status Report 2016. AGRA Growing Africa’s Agriculture. http://reliefweb.int/sites/reliefweb.int/files/resources/assr.pdf.
- Akinnifesi, F. K., Kwesiga, F., Mhango, J., Chilanga, T., Mkonda, A., Kadzere, I., Mithofer, D., Sileshi, G., Ramadhani, T., & Dhliwayo, P. (2006). Towards the development of Miombo Fruit trees as commercial tree crops in Southern Africa. Forests, Trees and Livelihoods, 16(1), 103–121. https://doi.org/10.1080/14728028.2006.9752548
- Anderman, T. L., Remans, R., Wood, S. A., DeRosa, K., & DeFries, R. S. (2014). Synergies and tradeoffs between cash crop production and food security: A case study in rural Ghana. Food Security, 6(4), 541–554. https://doi.org/10.1007/s12571-014-0360-6
- Andersson, J. A., Misiko, M., Farnworth, C. R., Badstue, L., & Stirling, C. M. (2015). Gender and conservation agriculture in east and Southern Africa : towards a research agenda. International Journal of Agricultural Sustainability, 14, 142–165. https://doi.org/10.1080/14735903.2015.1065602
- Baidu-Forson, J. J., Chanamwe, S., Muyaule, C., Mulanda, A., Ndiyoi, M., & Ward, A. (2015). Capturing views of men, women and youth on agricultural biodiversity resources consumed in Barotseland, Zambia. (Working Paper: AAS-2015-17). Penang, Malaysia: CGIAR Research Program on Aquatic Agricultural Systems. http://pubs.iclarm.net/resource_centre/AAS-2015-17.pdf
- Baidu-Forson, J. J., Phiri, N., Ngu’ni, D., Mulele, S., Simianga, S., Situmo, J., Ndiyoi, M., Wahl, C., Gambone, F., Mulanda, A., & Syatwinda, G. (2014). Assessment of agrobiodiversity resources in the Borotse flood plain, Zambia (No. AAS-2014-12). Penang, Malaysia.
- Beilfuss, R. (2012). A Risky Climate for Southern African Hydro: Assessing hydrological risks and consequences for Zambezi River basin dams. CA, US.
- Cai, X., Tamiru, A., Magidi, J., & Mapedza, E. (2016). Living with floods e household perception and satellite observations in the Barotse floodplain, Zambia. Physics and Chemistry of the Earth, 1–9. https://doi.org/10.1016/j.pce.2016.10.011
- Carletto, C., Corral, P., & Guelfi, A. (2017). Agricultural commercialization and nutrition revisited : Empirical evidence from three African countries. Food Policy, 67, 106–118. https://doi.org/10.1016/j.foodpol.2016.09.020
- Castine, S. A., Senaratna Sellamuttu, S., Cohen, P., Chandrabalan, D., & Phillips, M. (2013). Increasing productivity and improving livelihoods in aquatic agricultural systems : a review of interventions (No. AAS-2013-30). CGIAR Research Program on Aquatic Agricultural Systems.
- Central Statistical Office -CSO. (2012). 2010 census of population and housing: Population summary report. Lusaka, Zambia: Central Statistical Office. https://www.zamstats.gov.zm/index.php/publications/category/14-2010.
- Chikoore, H., & Jury, M. R. (2010). Intraseasonal variability of satellite-derived rainfall and vegetation over Southern Africa. Earth Interactions, 14(3). https://doi.org/10.1175/2010EI267.1
- Cole, S. M., McDougall, C., Kaminski, A. M., Kefi, A. S., Chilala, A., & Chisule, G. (2018). Postharvest fish losses and unequal gender relations: Rivers of the social-ecological trap in the Barotse floodplain fishery, Zambia. Ecology and Society, 23(2), 18. https://doi.org/10.5751/ES-09950-230218
- Cole, S. M., Puskur, R., Rajaratnam, S., & Zulu, F. (2015). Exploring the intricate relationship between poverty, gender inequality and rural masculinity: A case study from an aquatic agricultural system in Zambia. Acta Biologica Cracoviensia Series Botanica, 52, 154–170. https://doi.org/10.2478/v10182-010-0026-4
- Cole, S. M., van Koppen, B., Puskur, R., Estrada Carmona, N., DeClerck, F., Baidu-Forson, J. J., Remans, R., Mapedza, E., Longley, C., Muyaule, C., & Zulu, F. (2014). Collaborative effort to operationalize the gender transformative approach in the Bartose floodplain (No. AAS-2014-38). CGIAR Research Program on Aquatic Agricultural Systems.
- Colloff, M., & Baldwin, D. (2010). Resilience of floodplain ecosystems in a semi-arid environment. Resilience of Floodplain Ecosystems in a Semi-Arid Environment, 32, 305–314. https://doi.org/10.1071/RJ10015.
- DeClerck, F. A. J., Jones, S. K., Attwood, S., Bossio, D., Girvetz, E., Enfors, E., Fremier, A. K., Gordon, L. J., Kizito, F., Noriega, I. L., Matthews, N., Mccartney, M., Meacham, M., Noble, A., Quintero, M., Remans, R., Soppe, R., Willemen, L., Wood, S. L. R., & Zhang, W. (2016). Agricultural ecosystems and their services : the vanguard of sustainability ? Current Opinion in Environmental Sustainability, 23, 92–99. https://doi.org/10.1016/j.cosust.2016.11.016
- Delêtre, M., Gaisberger, H., & Arnaud, E. (2012). Agrobiodiversity in perspectives. A review of questions, tools, concepts and methodologies in preparation of SEP2D. https://doi.org/10.13140/RG.2.1.1467.5680.
- Del Rio, T., Groot, J. C. J., DeClerck, F. A. J., & Estrada-Carmona, N. (2018). Integrating local knowledge and remote sensing for eco-type classification map in the Bartose, floodplain, Zambia. Data in Brief, 19, 2297–2304. doi:https://doi.org/10.1016/j.dib.2018.07.009
- Díaz, S., Fargione, J., Chapin IIIF. S., & Tilman, D. (2006). Biodiversity loss threatens human well-being. PLoS Biology, 4(8), 1300–1305. https://doi.org/10.1371/journal.pbio.0040277
- Dierksmeier, B., Cole, S. M., & Shwu Jiau, T. (2015). Focal community profiles for Barotse Hub, Zambia (No. AAS-2015-06). CGIAR Research Program on Aquatic Agricultural Systems. https://AAS-2015-06.
- Dinno, A. (2017). dunn.test: Dunn's Test of Multiple Comparisons Using Rank Sums. R package version 1.3.4. https://CRAN.R-project.org/package=dunn.test.
- Douthwaite, B., Apgar, J. M., Schwarz, A.-M., Attwood, S., Senaratna Sellamuttu, S., & Clayton, T. (2017). A new professionalism for agricultural research for development. International Journal of Agricultural Sustainability, 15, 238–252. https://doi.org/10.1080/14735903.2017.1314754
- Duru, M., Therond, O., & Fares, M. (2015b). Designing agroecological transitions; A review. Agronomy for Sustainable Development, 35, 1237–1257. https://doi.org/10.1007/s13593-015-0318-x
- Duru, M., Therond, O., Martin, G., Martin-Clouaire, R., Marie-Angelina, M., Justes, E., Etienne-Pascal, J., Aubertot, J. N., Savary, S., Bergez, J. E., & Sarthou, J.-P. (2015a). How to implement biodiversity-based agriculture to enhance ecosystem services: A review. Agronomy for Sustainable Development, 35, 1259–1281. https://doi.org/10.1007/s13593-015-0306-1
- ESRI. (2016). ArcGIS Desktop: Release 10.4. Environmental Systems Research Institute.
- Fiedler, A. K., Landis, D. A., & Wratten, S. D. (2008). Maximizing ecosystem services from conservation biological control: The role of habitat management. Biological Control, 45(2), 254–271. https://doi.org/10.1016/j.biocontrol.2007.12.009
- Flint, L. S. (2008). Socio-Ecological Vulnerability and Resilience in an Arena of Rapid Environmental Change : Community Adaptation to Climate Variability in the Upper Zambezi Floodplain (No. 2008–4). Social-Ecological Resilience. Dakar; Senegal.
- Gaba, S., Fried, G., Kazakou, E., Chauvel, B., & Navas, M. L. (2014). Agroecological weed control using a functional approach: A review of cropping systems diversity. Agronomy for Sustainable Development, 34(1), 103–119. https://doi.org/10.1007/s13593-013-0166-5
- Gaughan, A. E., & Waylen, P. R. (2012). Spatial and temporal precipitation variability in the Okavango–kwando–Zambezi catchment, Southern Africa. Journal of Arid Environments, 82, 19–30. https://doi.org/10.1016/j.jaridenv.2012.02.007
- Godfray, C. H. J., & Garnett, T. (2014). Food security and sustainable intensification. Philosophical Transactions of the Royal Society, 369, 6–11. https://doi.org/10.1098/rstb.2012.0273.
- Groot, R. D., Brander, L., Ploeg, S. V. D., Costanza, R., Bernard, F., Braat, L., Christie, M., Crossman, N., Ghermandi, A., Hein, L., & Hussain, S. (2012). Global estimates of the value of ecosystems and their services in monetary units. Ecosystem Services, 1(1), 50–61. https://doi.org/10.1016/j.ecoser.2012.07.005
- Herforth, A., & Ahmed, S. (2015). The food environment, its effects on dietary consumption, and potential for measurement within agriculture-nutrition interventions. Food Security, 7(3), 505–520. https://doi.org/10.1007/s12571-015-0455-8
- Hijmans, R. J., Cameron, S. E., Parra, J. L., Jones, G., & Jarvis, A. (2005). Very high resolution interpolated climate surfaces for global land areas. International Journal of Climatology, 25(15), 1965–1978. https://doi.org/10.1002/joc.1276
- Howe, C., Suich, H., Vira, B., & Mace, G. M. (2014). Creating win-wins from trade-offs ? Ecosystem services for human well-being : A meta-analysis of ecosystem service trade-offs and synergies in the real world. Global Environmental Change, 28, 263–275. https://doi.org/10.1016/j.gloenvcha.2014.07.005
- IFDC. (2013). Zambia fertilizer assessment. IFDC and African Fertilizer and Agribusiness Partnership AFAP. https://africafertilizer.org/wp-content/uploads/2017/04/Zambia-Fertilizer-Assessment.pdf.
- IUCN. (2003). Barotse Floodplain Zambia: Local economic dependence on wetland resources.
- Jayne, T. S., & Rashid, S. (2013). Input subsidy programs in Sub-Saharan Africa : A synthesis of recent evidence. Agric. Econ, 44, 1–16. https://doi.org/10.1111/agec.12073.
- Jones, S. K., Boundaogo, M., DeClerck, F. A., Estrada-Carmona, N., Mirumachi, N., & Mulligan, M. (2019). Insights into the importance of ecosystem services to human well-being in reservoir landscapes. Ecosystem Services, 39, 100987. https://doi.org/10.1016/j.ecoser.2019.100987
- Kajoba, G. M. (2008). Vulnerability and resilience of rural society in Zambia : From the view point of land tenure and food security (No. 2008–3). Social-Ecological Resilience Series.
- Kennedy, G., Ballard, T., & Dop, M. C. (2013). Guidelines for measuring household and individual dietary diversity. Rome: Nutrition and Consumer Protection Division, Food and Agriculture Organization of the United Nations. http://www.fao.org/3/a-i1983e.pdf.
- King, A. J., Humphries, P., & Lake, P. S. (2003). Fish recruitment on floodplains: The roles of patterns of flooding and life history characteristics. Canadian Journal of Fisheries and Aquatic Sciences, 60(7), 773–786. https://doi.org/10.1139/f03-057
- Kiptot, E., Franzel, S., & Degrande, A. (2014). Gender, agroforestry and food security in Africa. Current Opinion in Environmental Sustainability, 6, 104–109. https://doi.org/10.1016/j.cosust.2013.10.019
- Kremen, C., & Miles, A. (2012). Ecosystem services in biologically diversified versus conventional farming systems: Benefits, externalities, and trade-offs. Ecology and Society, 17(4), 40. https://doi.org/10.5751/ES-05035-170440
- Laurance, W. F., Sloan, S., Weng, L., & Sayer, J. A. (2015). Estimating the environmental costs of Africa’s massive “development corridors.”. Current Biology, 25(24), 3202–3208. https://doi.org/10.1016/j.cub.2015.10.046
- McKenzie, F. C., & Williams, J. (2015). Sustainable food production: Constraints, challenges and choices by 2050. Food Security, 7(2), 221–233. https://doi.org/10.1007/s12571-015-0441-1
- Mofya-Mukuka, R., & Hichaambwa, M. (2018). Livelihood effects of crop diversification: A panel data analysis of rural farm households in Zambia. Food Security, 10(6), 1449–1462. https://doi.org/10.1007/s12571-018-0872-6
- Mweemba, H., Banda, F., Siamudaala, V. M., Munyeme, M., Kasanga, C. J., & Hamududu, B. (2012). The effect of seasonal variation on anthrax epidemiology in the upper Zambezi floodplain of western Zambia. Journal of Veterinary Science, 13(3), 293–298. doi:http://doi.org/10.4142/jvs.2012.13.3.293
- Ndiritu, S. W., Kassie, M., & Shiferaw, B. (2014). Are there systematic gender differences in the adoption of sustainable agricultural intensification practices? Evidence from Kenya. Food Policy, 49, 117–127. https://doi.org/10.1016/j.foodpol.2014.06.010
- Nicol, A., Langan, S., Victor, M., & Gonsalves, J. (Eds.) (2015). Water-Smart Agriculture in East Africa. CGIAR Research Program on Water, Land and Ecosystems (WLE), Colombo, Sri Lanka: International Water Management Institute (IWMI). https://doi.org/10.5337/2015.203
- Padulosi, S., Bergamini, N., & Lawrence, T. (2011). On-farm conservation of neglected and underutilized species: status, trends and novel approaches to cope with climate change, in: Proceedings of the International Conference Friedrichsdorf.
- Pasqualino, M., Kennedy, G., & Nowak, V. (2015). Seasonal food availability bartose floodplain system. CGIAR Research Program on Aquatic Agricultural Systems.
- Pricope, N. G. (2013). Variable-source flood pulsing in a semi-arid transboundary watershed: The Chobe river, Botswana and Namibia. Environmental Monitoring and Assessment, 185(2), 1883–1906. https://doi.org/10.1007/s10661-012-2675-0
- Prins, G. (1980). The hidden Hippopotamus: Reappraisal in African history: The early colonial experience in Western Zambia (African Studies). Cambridge University Press.
- Rajaratnam, S., Cole, S. M., Fox, K. M., Dierksmeier, B., Ranjitha, P., Zulu, F., Shwu Jiau, T., & Situmo, J. (2015). Social and gender analysis report: Barotse floodplain, Western Province, Zambia (No. AAS-2015-18). CGIAR Research Program on Aquatic Agricultural Systems. doi:AAS-2015-18.
- R Core Team. (2016). R: A language and environment for statistical computing. Release 3.3.0. R Foundation for Statistical Computing. https://www.R-project.org/.
- Remans, R., Wood, S. A., Saha, N., Lee, T., & Defries, R. S. (2014). Measuring nutritional diversity of national food supplies. Global Food Security, 3(3–4), 174–182. https://doi.org/10.1016/j.gfs.2014.07.001
- Ribaudo, M., Greene, C., Hansen, L., & Hellerstein, D. (2010). Ecosystem services from agriculture: Steps for expanding markets. Ecological Economics, 69(11), 2085–2092. https://doi.org/10.1016/j.ecolecon.2010.02.004
- Rockström, J., Steffen, W. L., Noone, K., Persson, Å, Chapin Iii, F. S., Rockstrom, J., Steffen, W. L., Noone, K., Persson, A., Chapin, F. S., Lambin, E., Lenton, T. M., Scheffer, M., Folke, C., Schellnhuber, H. J., Nykvist, B., De Wit, C. A., Hughes, T., Van Der Leeuw, S., … Foley, J. (2009). A safe operating space for humanity. Nature, 461(7263), 472–475. https://doi.org/10.1038/461472a
- Sheahan, M., & Barrett, C. B. (2017). Ten striking facts about agricultural input use in Sub-Saharan Africa. Food Policy, 67, 12–25. https://doi.org/10.1016/j.foodpol.2016.09.010
- Snyder, K. A., & Cullen, B. (2014). Implications of sustainable agricultural intensification for family farming in Africa : Anthropological perspectives. Anthropol. Notebooks, 20, 9–29. http://www.drustvo-antropologov.si/AN/PDF/2014_3/Anthropological_Notebooks_XX_3_Snyder.pdf.
- Steffen, W., Richardson, K., Rockström, J., Cornell, S. E., Fetzer, I., Bennett, E. M., Biggs, R., Carpenter, S. R., de Vries, W., de Wit, C. A., Folke, C., Gerten, D., Heinke, J., Mace, G. M., Persson, L. M., Ramanathan, V., Reyers, B., & Sörlin, S. (2015). Planetary boundaries: Guiding human development on a changing planet. Science, 347(6223), 1–15. https://doi.org/10.1126/science.1259855
- Suich, H., Howe, C., & Mace, G. (2015). Ecosystem services and poverty alleviation: A review of the empirical links. Ecosystem Services, 12, 137–147. https://doi.org/10.1016/j.ecoser.2015.02.005
- Tambara, E., Murwira, A., & Kativu, S. (2012a). From natural woodlands to cultivated land : diversity of fruit-feeding butterflies and beetles in the mid-Zambezi. African Journal of Ecology, 51(2), 263–269. https://doi.org/10.1111/aje.12034
- Tambara, E., Murwira, A., Kativu, S., & Torquebiau, E. (2012b). Farming does not necessarily conflict with tree diversity in the mid-Zambezi valley, Zimbabwe. Agroforestry Systems, 84(2), 299–309. https://doi.org/10.1007/s10457-011-9467-3
- Taylor, B. (2014). Who wants to give forever? Giving meaning To sustainability in development. Journal of International Development, 26(8), 1181–1196. https://doi.org/10.1002/jid.3033
- TEEB. (2015). TEEB for agriculture & food: An interim report. Geneva, Switzerland: United Nations Environment Programme. http://img.teebweb.org/wp-content/uploads/2015/12/TEEBAgFood_Interim_Report_2015_web.pdf.
- Tsiafouli, M. A., Drakou, E. G., Orgiazzi, A., Hedlund, K., & Ritz, K. (2017). Editorial: Optimizing the delivery of multiple ecosystem goods and services in agricultural systems. Frontiers in Ecology and Evolution, 5(August), 1–4. https://doi.org/10.3389/fevo.2017.00097
- Tweddle, D. (2010). Overview of the Zambezi river system: Its history, fish fauna, fisheries, and conservation. Aquatic Ecosystem Health & Management, 13(3), 224–240. https://doi.org/10.1080/14634988.2010.507035
- Tweddle, D., Cowx, I. G., Weyl, O. L. F., & Peel, R. A. (2014). Challenges in fisheries management in the Zambezi, one of the great rivers of Africa. Fisheries Management and Ecology, 22, 99–111. https://doi.org/10.1111/fme.12107
- Umar, B. B., Aune, J. B., Johnsen, F. H., & Lungu, I. O. (2012). Are smallholder Zambian farmers economists? A dual-analysis of farmers’ expenditure in conservation and conventional agriculture systems. Journal of Sustainable Agriculture, 36(8), 908–929. https://doi.org/10.1080/10440046.2012.661700
- Vargas Hill, R., & Vigneri, M. (2011). Mainstreaming gender sensitivity in cash crops market supply chains (ESA Working Paper No. 11-08). Agricultural Development Economics Division. Food and Agriculture Organization of the United Nations. http://www.fao.org/3/a-am313e.pdf.
- Wells, G. J., Stuart, N., Furley, P. A., & Ryan, C. M. (2018). Ecosystem service analysis in marginal agricultural lands: A case study in Belize. Ecosystem Services, 32, 70–77. https://doi.org/10.1016/j.ecoser.2018.06.002
- Wolski, P. (1998). Remote sensing, land use and hydrotopes in Western Province, Zambia. Elements of a groundwater study. Physics and Chemistry of the Earth, 23(4), 479–484. https://doi.org/10.1016/S0079-1946(98)00058-5