
 ?Mathematical formulae have been encoded as MathML and are displayed in this HTML version using MathJax in order to improve their display. Uncheck the box to turn MathJax off. This feature requires Javascript. Click on a formula to zoom.
ABSTRACT
Protecting and building soil carbon has become a global policy priority, and novel agronomic fertilization practices may contribute to soil protection and climate-smart agriculture. The application of microbial inoculants (biofertilizers) is considered beneficial for soil and climate -smart agriculture. Therefore, an exhaustive meta-analysis of biofertilization studies was carried out worldwide to quantify the benefits of microbial inoculants on SOC concentration. Based on 59 studies and 267 observations, was found that biofertilizers significantly increased SOC concentration by an average of 0.44 g C kg−1 soil. All biofertilizer types were estimated to contribute positively to SOC (0.18–0.70 g C kg−1soil), but only cyanobacteria, mixtures of organisms, mycorrhizal fungi, and nitrogen fixers were statistically significant. In terms of crop type, results were significant and positive for cereals, fruits, legumes and root/tuber crops (0.44–0.82 g C kg−1soil). A significant positive linear relationship was observed between crop yield and SOC changes, supporting the notion that greater productivity helps explain SOC increases, accounting for 7% of the dataset variability. This study provides the first evidence from a global assessment that biofertilizer use is associated with an augmented terrestrial agricultural organic carbon sink contributing to soil protection and food security where climate-smart solutions are sought.
1. Introduction
Soil organic carbon (SOC) is the largest carbon stock in the terrestrial ecosystem, estimated at approximately 1550 Pg (Lal, Citation2008). Land-use changes together with the intensification of agriculture have contributed greatly to carbon loss from soils and transfer of between 130 and 190 Pg C of this carbon into the atmospheric pool as carbon dioxide (CO2), thereby contributing to greenhouse gas emissions (Sanderman et al., Citation2017). This mineralization of carbon has occurred since the biological stability and persistence of SOC is influenced by the physical management (e.g. tillage or fertilization type) or due to alterations of the chemical structure of organic matter (OM) resulting in the chemical oxidation of organic carbon (Krull et al., Citation2003). Apart from the relevance of this soil carbon in terms of greenhouse gas emissions and global warming, the worldwide depletion of SOC in topsoils has been identified as a major threat in proper resource management (FAO and ITPS, Citation2015). Climate-smart agriculture and the related concept of climate-smart soils hold that agricultural impacts on climate should be reduced while simultaneously providing carbon sequestration value (Paustian et al., Citation2016). SOC is one of the most widely recognized soil quality parameters determining soil health (Chander et al., Citation1997; FAO, Citation2021), and adopting management practices intended to increase the amount of carbon stored in soils is tied to the sustainability of those productive systems and is aligned with the Sustainable Development Goals of the United Nations (Lal, Citation2016).
In the interest of restoring or maintaining soil-mediated ecosystem services, alternative practices can be recommended to help preserve soil carbon and soil fertility (FAO, Citation2021). Along these lines, a new paradigm is quickly gaining force in fertilization and crop production science, in which yield response can be enhanced through the application of microbial inoculants (Rose et al., Citation2014; Ye et al., Citation2020). These microbial inoculants, also known as biofertilizers, can be defined as a substance containing living microorganisms with beneficial properties for plant growth (Mącik et al., Citation2020). A wide range of microorganisms are commonly used as biofertilizers, including bacteria, fungi and cyanobacteria; contains a summary of the most important biofertilizer groups, categorized by functional role in plant growth promotion. Microbial products are already in use in some countries and are expected to become more in demand in the future (Aloo et al., Citation2022), whereas most used biofertilizers are those which intervene in the plant-available supply of nitrogen and phosphorus (Thomas & Singh, Citation2019). Also, biofertilizers may be a part of a climate-smart strategy since there is significant evidence that biofertilizers mitigate abiotic plant stress (Berruti et al., Citation2016; Chekwube Enebe & Oluranti Babalola, Citation2018). However, biofertilization is a relatively novel practice based on plant-microbe interactions that are only beginning to be understood (Mitter et al., Citation2021). Beginning in at least the 1980s, interest in biofertilizers has increased and is now in an exponential growth phase (based on publication numbers in the scientific literature; Figure S1), indicating a need to initiate research on how the practice impacts key soil quality parameters, including an improved understanding of how these products influence SOC stocks. Some authors have already proposed that the application of microorganisms to soil can help maintain or increase the content of organic matter and, therefore, the amount of organic carbon, resulting in an increase of soil fertility (Dębska et al., Citation2016). While a number of meta-analyses have addressed biofertilizer effects on plant production (e.g. Li et al., Citation2022; Schütz et al., Citation2018), no such studies have been carried out focusing on SOC.
Table 1. Classification of biofertilizers and their functions.
In this study, we aimed to provide the first global analysis of the relationship between SOC accumulation and biofertilizer application using a quantitative meta-analysis approach. Considering the high potential complexity in disentangling numerous variables, our goals were to: (i) compile a database and carry out a thorough literature review of biofertilizers and soil carbon, identifying potential mechanisms for testing, (ii) ascertain the effect that biofertilizers may have on SOC accrual in arable crops, (iii) understand the importance of key explanatory variables including biofertilizer type, crop type, fertilization, study length, climate zone, soil type, and study type, and (iv) characterize the explanatory power of mechanisms likely driving SOC changes (specifically, yield response of test crops).
2. Materials and methods
2.1. Data sources and collection
We conducted an exhaustive systematic literature search in September 2022 using the ISI Web of Science and Scopus databases. The search aimed to identify any experimental, primary source study applying biofertilizer to the soil, in which soil organic carbon concentrations were reported (g C kg−1 or %). In order to make the search as inclusive as possible, we used different synonyms for organic carbon (N = 7) and biofertilizers (N = 2). Title, keywords, and abstracts were found using the full search string: (‘Soil organic carbon’ OR ‘organic C’ OR ‘carbon sequestration’ OR ‘Soil organic C’ OR ‘SOC’ OR ‘OC’) AND (‘biofertili*’ OR ‘bio-fertili*’). We used Boolean ‘OR’ operators to be as inclusive as possible within-subject searches and used ‘AND’ to connect subjects. The use of a wildcard character (asterisk ‘*’) returned results for any group of characters (including no character), allowing us to detect papers with different word spellings such as ‘bio-fertiliser’ or ‘bio-fertilizer’. We also tested replacing the ‘biofertilizer’ term(s) with the terms ‘bioeffector’ and ‘bio-effector’, but this search yielded no additional results. This initial search yielded 302 papers from Web of Science and 123 from Scopus. After removing the duplicate papers, 316 papers remained for the selection process. In the case that relevant references were found by other means (e.g. cited in other works) they were only further considered if accessible through the WOS database. The general screening process and the flow of selecting relevant literature are presented in Appendix A of the Supplementary Material. The title and the abstract of each publication were rigorously screened when the study met specific criteria. To be included in the first screening, it was required that studies: (a) properly applied biofertilizer terminology, (b) reported values of total soil organic carbon (expressed as g C kg−1soil or %), (c) were written in English language, and (d) provided statistical data (mean of SOC concentration, standard deviations, or standard errors). After reading all abstracts, 135 papers were selected and rigorously assessed. During this detailed assessment, 76 additional papers were excluded for motives related to experimental design and data reporting, which included (a) the experimental design was not replicated, (b) statistical analyses or mean and error values were not provided or (c) experiments did not include a control treatment. Overall, a total of 59 publications from 23 different countries remained for the inclusion in the meta-analysis, including 267 unique pairwise comparisons (see the list of references in Table S5). It is emphasized that these 267 comparisons thus include all separate experimental contrasts included in the selected studies (some studies including just one or few contrasts, more complex designs including many), in each case contrasting a unique biofertilizer treatment with its corresponding control.
Data were extracted from all selected papers and compiled a database. When the data were only available in graph format, means and errors were extracted using Plot Digitizer Version 2.6.6 (see http://plotdigitizer.Sourceforge.net). Soil properties, site factors, study length and any other relevant study information were recorded (i.e. organic matter, soil pH, soil electrical conductivity, soil texture, soil taxon). No studies with non-soil substrates were included. Despite being recorded, soil characteristics were not included in the quantitative analysis because they were not uniformly reported among studies and, for many studies, some information was missing. Since in experimental studies, the capacity to detect changes in SOC increases with time and in order to reduce analytical complexity, only the last year of observations were included in the analysis of multi-year field trials, whereas average study length was 2.2 years. For each observation, we recorded SOC concentrations for the treatment (with biofertilizer) and for its respective experimental control (without biofertilizer). For 39 studies that reported SOC concentration as a percentage, SOC concentrations were converted to g C kg−1soil. Throughout this manuscript, measurements and estimations expressed as g C kg−1 refer always to soil organic carbon concentrations in soil on a dry weight basis.
Additionally, to get an estimation of the potential increase in SOC storage using biofertilizers, the SOC stock was calculated. For this purpose, only field trial studies were considered. Using the Harmonized World Soil Database (HWSD v2.0; FAO and IIASA, Citation2023), and the given geographical coordinates provided for each study, bulk density and volumetric coarse fragment content were extracted for the 0–20 cm depth layer (for a technical description of the methodologies used for the generation of these estimated values, see FAO and IIASA, Citation2023). SOC stock (Mg C ha−1 year−1) for each pairwise comparison was calculated based on the LEAP guidelines (FAO, Citation2019), and divided by study length to arrive at an estimation of ΔSOC stock per year (EquationEquation 1(1)
(1) ):
(1)
(1) where OC, organic carbon concentration, was expressed as g C kg−1 soil (fine earth fraction), BD (g cm−3) is the bulk density of the fine earth fraction, vG is the volume of coarse fragments (%), and t is the study length in years. When quantifying changes in SOC, it is a common practice to define a specific sampling depth that captures the main carbon dynamics. In established protocols such as the IPCC guidelines (IPCC, Citation2006; also see Lefèvre et al., Citation2017) it is recommended to restrict the evaluation of SOC changes to a depth of 30 cm. This depth is considered representative of the uppermost soil horizon, where changes occur at a greater rate and the most important process related to carbon cycling occur. Since in the HWSD depths are provided in 20 cm intervals, we chose the 0–20 cm layer.
2.2. Explanatory variables
Seven categorical co-variables were recorded for each individual observation. These were (1) biofertilizer type, (2) crop type, (3) fertilization regime, (4) study length, (5) climate zone, (6) study type and (7) soil type . These variables were recorded from the complete set of literature and available for all 267 comparisons. Regarding biofertilizer type, the microbial inoculants were categorized and classified based on their functional and/or taxonomic groups and their role in plant growth promotion, resulting in seven categories: arbuscular mycorrhizal fungi (AMF), cyanobacteria, P solubilizers, N fixers, microalgae, plant growth-promoting rhizobacteria (PGPR), other bacteria and combined inoculation with different inoculant mixture (Table S1). A crop type category was associated with each observation, according to the six main categories proposed by the Food and Agricultural Organization of the United Nations (FAO, Citation2005): cereals, fodder crops, vegetables, legumes, fruit, roots/tubers, or other crops (Table S2). Fertilization was classified into four categories according to the fertilization regime applied in each contrast: none, mineral, organic (e.g. compost, farmyard manure, green manure, among others) and mineral plus organic (i.e. treatments with both positive and negative fertilization controls or different fertilization arrangements; Table S3). Additionally, we recorded the biofertilizer application method and its applied concentration. The total treatment (contrast) of applying biofertilizers was through soil application (217) seed inoculation (37), root inoculation (9) and pre-mixing of the biofertilizer substance with an organic amendment or solid support such as compost (5). However, the common practice in most studies was done with direct application to soil. For this reason, we did not consider this parameter in the analysis. In order to account for the high spatial and temporal variability of SOC, study length was classified into three main categories: short-term studies (less than one year), medium-term studies (studies between one and four years), and long-term studies (four years or longer). Climate zones were classified according to the world map of the IPCC (IPCC, Citation2006). From each study we extracted the specific experimental site location based on either its exact name or on the geographic coordinates provided in the manuscript (see counts in Table S3). Regarding the study type, we distinguished between three main categories: laboratory conditions, greenhouse, and field (see counts in Table S3). All three study types were included, on one hand due to the relative novelty of research on the topic, and also due to the relevance of biofertilization for horticultural applications or specialty crops etc. not grown in field conditions. Soil type was classified to the level of Reference Group according to the HWSD. The classification was carried out using the same method as for the climate zone, based on the exact geographic coordinates for study locations provided in the manuscript (see counts in Table S3).
Measures of crop yield are important indicators to illustrate crop productivity and provide a sign of soil fertility. For this reason, for each observation in the database we also gathered results from crop harvest from 48 of the 58 studies, expressed in different units: tons per hectare (18), grain yield (9), other approximations associated with yield (e.g. plant height; 11), dry weight (8) and fresh weight (2). Given the importance of plant productivity in regulating soil carbon stocks we calculated a relative yield response for each pairwise comparison (EquationEquation 2(2)
(2) ):
(2)
(2)
2.3. Effect size
In meta-analysis, effect size is the value reflecting the magnitude of a treatment effect in comparison to a reference treatment (Borenstein et al., Citation2009), and in practice requires the conversion of each pair of treatment and control observations from primary studies into a common measure, the effect size, allowing comparisons between two groups. We calculated the mean difference (MD) as a measure of effect size (e.g. as in Gross & Glaser, Citation2021). This approach has the advantage that the results are expressed in the same units and there is no need to calculate weighted or standardized measures to deal with reporting measures which cannot be related directly to the response variable. In summary, the use of mean difference was the most suitable effect size for our study due to its simplicity and interpretability. MD was calculated for each observation as in EquationEquation (3)(3)
(3) :
(3)
(3) where X1 and X2 refer to the mean concentration of soil organic carbon (g C kg−1soil) of the treatment and the control (respectively). Assuming that the standard deviation (SD) of the two populations was the same, the error was calculated as (EquationEquation 4
(4)
(4) ):
(4)
(4) where n1 and S1, n2 and S2 represent the sample size and the standard deviation of the treatment and the control respectively.
In our database, most of the studies did not report measures of variances, and consequently, the variance was not available for 227 of the 268 observations. In some studies (N = 4 with 13 observations) that included the measure of variability but did not specify the variance measure, we assumed it to be a standard error (Rubin et al., Citation2017). The standard error was transformed to standard deviation applying the following formula (EquationEquation 5(5)
(5) ):
(5)
(5) For those studies that did not provided variances (N = 45 with 210 observations) we calculated the average coefficient of variation (CV) within the dataset, so that these studies may be included in the global analysis. Their standard deviation was estimated by multiplying the mean for each observation by the average of CV (Rubin et al., Citation2017). In addition, the 95% confidence interval (CI) was calculated as follows:
where MD is the effect size calculated as mentioned above, and SD is the standard error. For the purposes of this study, MD is termed ΔSOC (change in SOC concentrations).
2.4. Statistical analysis
A random-effect model including ΔSOC as the response variable and without covariables was used to calculate the overall effect of biofertilizers on ΔSOC across the 59 studies and 267 pairwise comparisons using the metafor package in R (Viechtbauer, Citation2010). Under this model, study identity was included as a nested random term to consider the dependency of several effect sizes simultaneously (Waring et al., Citation2015). The amount of heterogeneity (i.e. τ2) was estimated using maximum-likelihood estimation (Hardy & Thompson, Citation1996), the Q-test for heterogeneity (Cochran, Citation1954) and the I2 statistic (Higgins & Thompson, Citation2002) were calculated. The mean effect size was considered significant when the 95% confidence interval of the mean difference did not overlap zero. In addition, prediction intervals were calculated to evaluate the dispersion range of true effect sizes (Riley et al., Citation2011). Also, Cook’s distance was used to remove outliers and the assumption of normality of the effect sizes and the model residuals were visually verified using histograms. Additionally, three methods to evaluate publication bias in our results were applied. Publication bias exists because research with statistically significant results is more likely to be submitted and published than work with null or nonsignificant results (Fragkos et al., Citation2014). First, we generated funnel plots of effect size against standard error to detect visually unbalanced distributions. Second, Egger’s regression test was used to quantify asymmetry in the funnel plot. Third, we calculated Rosenthal’s fail-safe numbers, which indicates the number of studies with zero effect required in the database to change the significance of a result from significant to non-significant (Rosenthal, Citation1979). If this number is sufficiently high (> 5n + 10, where n is the number of measurements) the results can be considered robust and reliable regarding the publication bias (Du et al., Citation2020; Toth & Pavia, Citation2007).
To explore the causes of variability in the response variable we generated additional mixed-effect models including predictors. We created separate models per each of the seven categorical predictor variables (biofertilizer type, crop type, fertilization regime, climate zone, soil type, study type, and study length) and for one continuous predictor variable (relative yield response). A Wald-type test (QM) was applied to each model, to test the significance of the model coefficient in meta-regression models (Viechtbauer et al., Citation2015). For each model, a pseudo-coefficient of determination (R2) as the proportion of the variance explained by the model with categorical predictors over the model without predictors was calculated (Harrer et al., Citation2021). Following the generation of the categorical models, post-hoc Tukey tests were performed to identify significant differences between categorical levels. This was done with the ghlt function of the multcomp package, with no test adjustment specified. Outliers in all the mixed-effect models using Cook’s distance were removed.
In order to evaluate the relationship between ΔSOC and the relative yield response, a meta-regression model was constructed as described above. As some studies reporting multiple SOC measurements and biofertilizer treatments only provided an averaged crop yield value, for this analysis, an average ΔSOC for the multiple observations was calculated. Additionally, it was necessary to exclude some studies that did not provide crop data (N= 59). Consequently, the number of observations included in this model was 141.
3. Results
3.1. Profile of collected primary studies and dataset
Study length within the dataset had a mean of 2.2 years, a median of 1.5 years, and a complete range of 0.1–10 years; soil sampling depth had a mean of 0.18 m, a median of 0.16 m, and a range of 0.05–0.30 m. Concerning the biofertilizer types within the dataset, those with greatest representation in the dataset were PGPR (considered in 24% of studies), followed by nitrogen-fixing bacteria (23%) and mixtures of different organism types (see Table S1 for greater detail for other organism groups). Concerning crop type, common crops included cereals, vegetables, and legumes, but also various specialized crops such as ornamental flowers or sugarcane (see Table S2). Regarding study length, a large proportion of the dataset (47%) comprised of studies with a length of one to four years, while 23% of the studies had a duration of four years or more. The remaining 30% of the data set consisted of short studies of less than one year (see Table S3). Regarding climate zone, a large faction of the studies (37%) was carried out in tropical dry climates, followed by tropical wet (16%) with notably few studies reported for zones with warm temperate moist and cool temperate moist climates (Table S3). The climate zone profile of the gathered studies was highly similar to that of other meta-analyses on biofertilizers done by Schütz et al. (Citation2018). Most studies were carried out in the field (74%), with smaller-scale greenhouse and laboratory studies of comparable representation (12% and 14%, respectively). Finally, concerning fertilization regime, 41% of studies included negative controls (experiments in which the reference controls and treatments received no fertilization), 18% used a mineral fertilization group, 23% used an organic fertilization group, and 15% used a mineral-organic fertilization group.
Despite the fact that data on the amount of biofertilizer applied had been complied, this was not analysed because it was usually provided in terms of units (e.g. kg product kg−1 soil, kg ha−1, mL m−2, etc.) and details on organism densities (i.e. colony-forming units) were sparsely reported. Nonetheless, we found that the application rate of biofertilizers products, when it was the only fertilizer, ranged from 1 to 20 kg ha−1. When biofertilizers were applied along with other fertilizers (e.g. compost, mineral fertilizer, vermicompost and raw manure), the range was from 0.4 to 12 kg ha−1.
3.2. Mechanisms of biofertilizer promotion of SOC
Some potential mechanisms of biofertilizer promotion of SOC storage have been identified during the literature review process ():
Increased terrestrial carbon fixation and indirect SOC inputs: the mechanism of indirect soil carbon accrual (as opposed to direct inputs-e.g. manure) has classically been recognized as a result of practices such as fertilization or irrigation, which increase crop productivity (Stewart et al., Citation2008). This associated increased primary productivity and carbon fixation leads to higher carbon inputs to soil though senescence and litter inputs, decomposition, root turnover, among others. When biofertilizers are applied to soil or as seed inoculants, they may promote plant growth through several mechanisms (Sinha et al., Citation2010). For instance, through the photosynthesis process, plants assimilate carbon dioxide (carbon sequestration). And this carbon resides in plant tissue and is then added to the soil as litter when plants die and decompose by the combined actions of soil fauna and microorganisms.
Application of soil-dwelling autotrophic microorganisms: microbial or cyanobacteria biofertilizers contribute significantly to the biogeochemical cycles of carbon, nitrogen and oxygen (DeRuyter & Fromme, Citation2007; Karl et al., Citation2002; Pathak et al., Citation2018). Autotrophic soil-dwelling microorganisms fix carbon dioxide and, therefore, increase the amount of carbon entering the soil crust and, consequently, soil microbial biomass (Marks et al., Citation2019). At the same time, 25% of carbon fixed by cyanobacteria is synthesized to exopolysaccharides (EPS) (Nisha et al., Citation2007), which play an important role in soil aggregation (MalamIssa et al., Citation2001).
Increased SOC stabilization rates: it has been proposed that microorganisms applied as biofertilizer may alter the proportions and quantities of labile and recalcitrant carbon in soil. For instance, one study using an experimental approach measured levels of dissolved organic matter and so-called humic substances, which led to the interpretation that the applied microorganisms could have played a role in the activation of transformation and polymerization processes of low molecular-weight compounds to macromolecular compounds (Dębska et al., Citation2016). However, contemporary evidence and the renewed view of SOC stabilization have largely de-emphasized the historical view that chemical properties of organic matter explain its persistence in the environment (Schmidt et al., Citation2011). Thus, a possible reinterpretation of such results may be the increased stabilization of carbon e.g. through the accumulation of microbial necromass via increased plant below-ground inputs (e.g. Bradford et al., Citation2013; Miltner et al., Citation2012), which may also be tied to increases in microbial carbon use efficiency (see Tao et al., Citation2023).
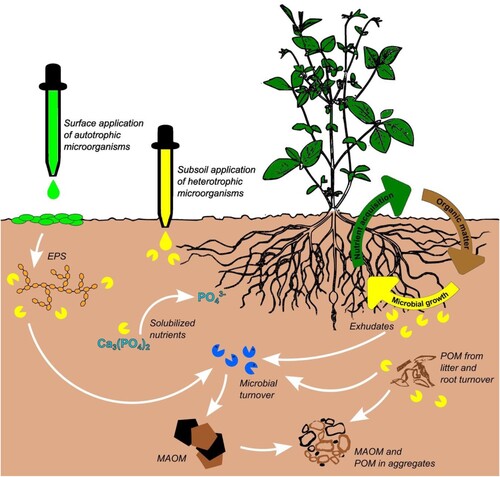
Figure 1. Potential mechanisms by which biofertilizers promote SOC accrual.
Notes: Biofertilizers act directly and indirectly in the promotion of soil SOC accrual, either through turnover of microbial biomass, secretion of organic extracellular polymeric substances (EPS), or by reinforcing plant growth through solubilization of nutrients, associations, hormonal changes, etc. (greater discussion of these found in Kholssi et al., Citation2022). Note that in some cases these processes are complementary and can result in positive feedbacks. In the figure, biofertilizers are depicted to enter the soil-plant system either by superficial application of photosynthetic microorganism biofertilizers (i.e. microalgae or cyanobacteria), or through the subsoil application of other microorganism preparations comprising the other biofertilizer types. Subsoil application may be though inoculation of organic amendments, direct application, liquid dilutions, etc. MOAM: mineral-associated organic matter. POM: particulate organic matter.
3.3. General effect of biofertilizer application on ΔSOC
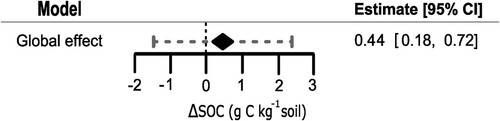
The random effect model without predictors indicated that use of biofertilizers resulted in an average increase of 0.44 g C kg−1soil (dry matter basis, hence forth simply g C kg−1; 95% CI:0.18 to 0.70; ; Table S4), rejecting the null hypothesis, whereas the average mean difference differed significantly from zero (z = 3.3, p < 0.01), and the corresponding prediction interval was −1.48 to 2.37 g C kg−1. For this model, the component for within-group (nested) variance was much smaller than study-level variance (estimated at 0.16 and 0.79 g C kg−1, respectively). We confirmed that the random modelling approach was warranted (Q-test; p < 0.001) and the observed heterogeneity was due to the true effects and not the sampling error (I2 = 99%). Regarding publication bias, the resulting funnel plot (Figure S3) did not display any symptoms of asymmetries, and Egger’s regression was not significant (p = 0.73). As a second test for publication bias, Rosenthal’s fail-safe number was calculated to be 240,395 papers. With these characteristics, we conclude that the dataset did not present risks of publication bias.
Figure 2. Global effect of biofertilization on SOC concentrations.
Notes: Model development included the removing 18 outliers. The diamond represents the overall effect estimate after combing all studies. The mid-point of the diamond represents the average response, and the width the confidence interval. In addition, the dotted line denotes the lower and upper bound of the prediction interval.
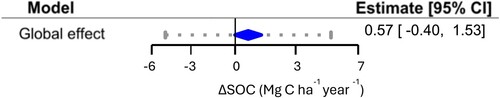
We also elaborated a global model for SOC stocks based on estimated values of bulk density and soil depth based on the HWSD. The model estimated a positive ΔSOC stock of 0.56 Mg C ha−1 year−1 (CI: −0.40 to 1.53), although this estimate was not statistically significant (z = 1.14, p = 0.25) (; Table S4), whereas for this model the prediction interval was estimated as −5.50 to 6.60. For this model, the component for within-group (nested) variance was much smaller than study-level variance (estimated at 0.99 and 8.4 Mg C ha−1 year−1, respectively). We confirmed that the random modelling approach was warranted (Q-test; p < 0.0001) and the observed heterogeneity was due to the true effects and not the sampling error (I2 = 97%). Regarding publication bias, the funnel plot did not show any sign of asymmetry, and this was confirmed for the Egger’s test (p = 0.66). Moreover, Rosenthal’s fail-safe number was estimated as 51,731 papers, and as such the results can be considered reliable and not due to study bias.
Figure 3. Global effect of biofertilizer application on SOC stocks.
Notes: Model considering only the studies based on field trials and after removing 10 outliers. Interpretation as in .
3.4. Biofertilizer type
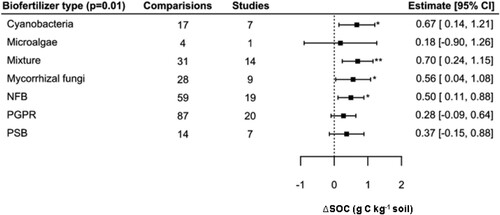
Regarding the influence of biofertilizer type, the Wald type test result (QM = 19.70, p < 0.01) showed that there were significant differences between biofertilizer types (Table S4) but the overall variance explained by the model was low (pseudo R2 = 0.05). Our findings show that all biofertilizers were associated with positive ΔSOC effects, with values ranging between 0.18 and 0.67 g C kg−1 (), but only cyanobacteria, mixtures of organisms, mycorrhizal fungi, and nitrogen fixers had a significant effect. The Tukey post-hoc test for this model showed that there were no significant differences between groups.
Figure 4. Effect of biofertilizer type on SOC concentration.
Notes: Model developed following removal of 15 outliers. The number of comparisons and studies is indicated in each line. The square and bars represent the mean and the lower and upper bounds of the 95% confidence interval (CI). Bars that do not cross the vertical line differed significantly from zero (*p < 0.05, **p < 0.01).
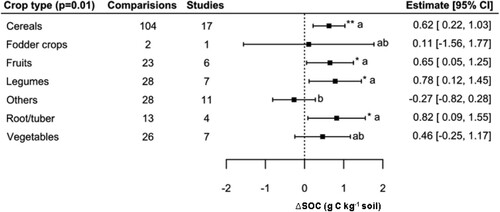
3.5. Crop type
The effect of the crop type on the mixed-effects model was significant (QM = 19.70, p < 0.01), whereas cereals, legumes, fruits and root/tuber had a significant positive effect with an ΔSOC, estimated at 0.62, 0.78, 0.65 and 0.82 g C kg−1 respectively (; Table S4). Based on this model, it was seen that crop type was able to explain 27% of the model variance (psuedo-R2). In post-hoc analysis, the subcategory other crops had the lowest estimate (−0.27 g C kg−1soil), and this grouping was found to be statistically different from legumes, fruits, cereals, and root/tuber, but not from fodder crops and vegetables, which had mean estimates of 0.11 and 0.46 g C kg−1, respectively.
Figure 5. Effect of crop type on SOC concentration.
Notes: Model developed following removal of seven outliers. Interpretation as in .
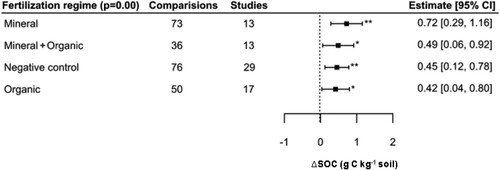
3.6. Fertilization regime
Fertilization groupings were estimated to be significantly different from zero (QM = 14.10, p < 0.01), and the estimates for each of the four subgroupings were both positive and significant, ranging from 0.42 to 0.71 g C kg−1 (; Table S4). The R2 of the model was negligible (pseudo-R2 = 0.01), and in post-hoc testing there were no differences between these fertilizer treatment groups.
Figure 6. Influence of fertilization regime on SOC concentration.
Notes: Model developed following removal of fifteen outliers. Interpretation as in .
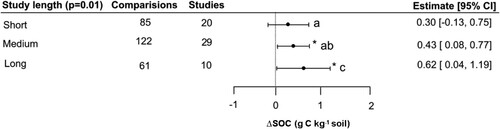
3.7. Study length
The variable study length was found to be statistically significant (QM = 10.16, p < 0.05), whereas there was a positive effect across all study lengths (; Table S4). Despite the positive effect, the overall explanatory power of the model was low (pseudo-R2 = 0.00). Significant differences were observed among the different study lengths (<1 year, 1–4 years, > 4 years), whereas long-term studies (more than four years) exhibited the highest increases in SOC (0.62 g C kg−1), while medium-term and short-term studies showed comparatively lower increases of 0.43 and 0.38 g C kg−1, respectively. It is important to mention that both medium-term and long-term studies were well represented, with N = 29 and N = 10, respectively. Since the post-hoc testing confirmed the significant differences between these subgroups, it was confirmed that SOC gains did depend on time of treatment with biofertilizers.
Figure 7. Effect of the study length on SOC concentration.
Notes: Model developed following removal of six outliers. Interpretation as in .
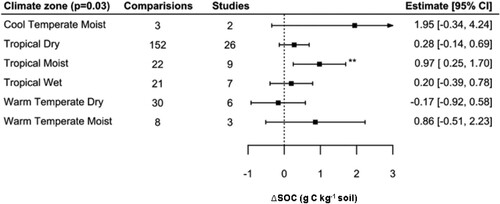
3.8. Climate zone and soil type
Climate region was a significant predictor (QM = 13.35, p < 0.05), but only tropical moist climates had significant and positive effects on ΔSOC, estimated at 0.97 g C kg−1 (; Table S4). This predictor explained 20% of the variance (pseudo-R2 = 0.20) in comparison with the overall random effect model without predictors. No effect was found for tropical dry climates, nor for warm temperate dry climates, despite the fact that these groups were well represented (N = 151 and N = 30 observations, respectively). Cool temperate moist and warm temperate moist climates had the largest error estimates (SE = 1.77 and 0.55 g C kg−1, respectively) owing to low study number (2 and 3 studies respectively), which indicates there is a lack of studies in these regions. In post-hoc analysis, no climate zones were found to differ significantly.
Figure 8. Effect of climate zone type on SOC concentration.
Notes: Model developed following removal of six outliers. Interpretation as in .
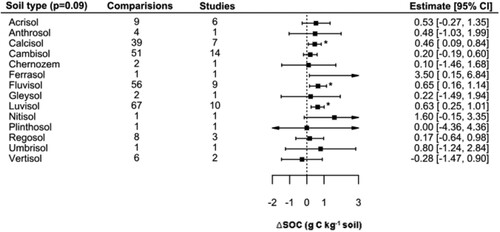
The effect of the soil type on the mixed-effects model was not significant based on the omnibus test (QM = 22.12, p = 0.09), indicating that as a whole the model was not deemed to be significant, however this does not exclude the possibility that individual coefficients were signficiant, which was in fact the case for some soil types (continued below; ; Table S4). Desipite this fact, it was seen that soil type was able to explain 10% of the data variance (psuedo-R2). Calcisols, Fluvisols, and Luvisols were estimated to have positive increases significantly different from zero, of between 0.4 and 0.6 g C kg−1, whereas it must be taken into account that these soil types comprised a large share of the observations (162/248). The other soil types still mainly had positive estimated increases (in the range of 0.17 to 3.50 g C kg−1), whereas only the estimate for Vertisols was negative (−0.28 g C kg−1, based on 2 studies and 6 observations). The Tukey post-hoc test revealed no significant differences between subcategories.
Figure 10. Effect of soil type on SOC concentration.
Notes: Reference soil groups have been extracted from the Harmonized World Soil Database (HWSD v2). Models elaborated following the removal of five outliers. Interpretation as in .
3.9. Study type
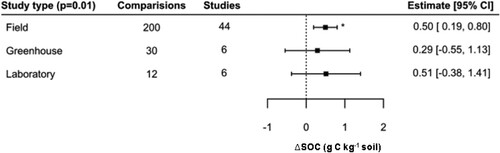
Regarding experimental conditions, the mixed-effects model was significant (QM = 12.86, p < 0.01). Also, it was found that studies under field conditions showed a significant increase of 0.50 g C kg−1 (; Table S4), whereas the estimations for greenhouse and laboratory studies were positive but non-significant. A large proportion of studies in the database were based on trials of biofertilizers under field conditions (200 of 242 pairwise comparisons), and the error for this grouping was small (SE = 0.16 g C kg−1) in comparison to studies undertaken in in greenhouses (N = 30, SE = 0.29) or in the laboratory (N = 12, SE = 0.46). The Tukey post-hoc test revealed no significant differences between subcategories (i.e. field, greenhouse, laboratory).
Figure 9. Effect of study type on SOC concentration.
Notes: Model developed following removal of seven outliers. Interpretation as in .
3.10. Relationship between yield response and ΔSOC
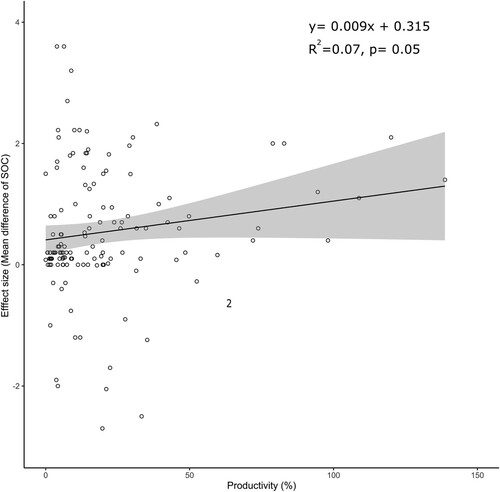
This model showed a week but significant linear correlation between the effect ΔSOC and yield response (; Wald test QM = −10.13, p < 0.01). Specifically, a one-unit increase in yield response (in %) corresponded to an increase of 0.009 g C kg−1 (95% CI: 0.001, 0.015). However, the overall variance explained by the model was low (pseudo-R2 = 0.07). To better understand the relationship between these two variables, more long-term data are required to comprehend carbon dynamics.
Figure 11. Relationship between effect size (mean difference of SOC concentration) and change in productivity (%).
Notes: The line represents the prediction and shading is the 95% confidence interval (CI). The reported pseudo-R2 value represents the proportion of variance explained in the model and the p-value is the result of the Wald test.
4. Discussion
The global model based on primary experimental reports has provided evidence that biofertilizer use is associated with increases in SOC concentrations, estimated at an average of 0.44 g C kg−1 soil or approximately 0.4p1000 (), a convincing indication that biofertilization can be relevant to ΔSOC in agricultural systems, and (keeping in mind the distribution of study lengths) even those which adopt such fertilization schemes in the short to medium term. While this model based on reported results is most reliable, we also gathered estimated data (HWSD) on bulk densities (assuming a standard depth layer) in order to carry out an estimation of changes in SOC stocks, since this is the endpoint which is most relevant to global recarbonization policies. This model indicated that ΔSOC stock was positive (0.57 Mg C ha−1 yr−1), but the model was not significant, with the confidence interval overlapping a 0 effect size change. Here, it is important to keep in mind the model limitations leading from the assumptions made; information on bulk density was not frequently reported in our dataset, and sampling depth also varied greatly among the studies, whereas such limitations have been encountered in works with similar objectives (e.g. FAO and ITPS, Citation2021). In the future, as the literature on biofertilizer use grows, achieving a larger dataset with actual measurements of bulk densities and standardized soil depths should be an objective.
To complement the above information, we additionally carried out the exercise of calculating SOC stocks for the individual studies within our dataset which were data-permitting: Youssef and Farag (Citation2021) tested the effects of two biofertilizers on quinoa production, with and without organic fertilization. In the two-year study, the treatment without farmyard manure (FYM) significantly increased SOC concentrations from 0–30 cm from 7.2 g C kg−1 soil (control) to 21.0 g C kg−1 soil for a liquid biofertilizer, and 22.6 g C kg−1 soil for an effective microorganism biofertilizer, whereas these concentrations correspond to 30.5 t C ha−1 year−1, and 34.1 t C ha−1 year−1, respectively, a surprising result. On the other hand, in the same study with farmyard manure fertilization, the same biofertilizer applications led to SOC losses (as compared to the FYM control) of 12.2 and 11.0 t C ha−1 year−1, respectively. Yadav et al. (Citation2015) carried out an agronomic study with a complex design of 13 treatments, allowing for six contrasts with biofertilizer application. Of these, one treatment resulted in SOC stock losses in the 0–25 cm sampling depth (−3.4 t C ha−1 year−1) and in the remaining five treatments SOC stocks increased, ranging from 0.34 to 5.1 t C ha−1 year−1. In three other studies for which this information was available, one corresponded to a laboratory incubation study, and in the other two no effects on SOC were found.
4.1. Influence of biofertilizer type
The mixed model developed for biofertilizer type predictor has shown that those associated with positive significant effects were cyanobacteria, nitrogen-fixing bacteria, mycorrhizal fungi, and the use of different combinations of inoculation (). The higher SOC increases were associated with combinations of organisms (0.70 g C kg−1), and many common biofertilizers use are a combination of two functional traits: nitrogen fixing and phosphorus solubilizing (Reddy et al., Citation2021). These results are in conformity with Schütz et al. (Citation2018), who conducted a global meta-analysis to quantify the benefits of biofertilizers from 171 studies and concluded that biofertilizers with those two functional traits – N fixation and P solubilization – were the most effective inoculants on enhancing yield impact. The aim of co-inoculation is to enhance nutrient availability in soils proving nitrogen, phosphorous, potassium and other plant nutrients to the crop without any chemical input to soil leading to improvement of plant growth and increase in crop yield (Kumar et al., Citation2022). Considering these traits separately, our results indicate that P solubilization biofertilizers (e.g. Pseudomonas spp. and Thiobacillus spp.) had no significant effect on SOC while symbiotic nitrogen fixation (e.g. Azobacter spp. and Rhizobium spp.) had a significant effect. Lu et al. (Citation2011) found in their meta-analysis that carbon pools in both aboveground and belowground plant biomass significantly increased under N addition, resulting in increased fresh organic carbon input through plant litterfall and roots to soil. For instance, Augusto et al. (Citation2013) who performed a meta-analysis based on symbiotic nitrogen fixation by phosphorus availability with 68 references, found that increasing P supply resulted in increased plant biomass, plant P content and N fixation.
Mycorrhizal fungi biofertilizers were associated with SOC increases (0.56 g C kg−1), whereas the benefits of these organisms for soil health and crop productivity is well understood (Begum et al., Citation2019). Indeed, mycorrhizal fungi are effective agents for improving carbon sequestration because it has been demonstrated that mycorrhizal roots create a sink demand of carbon, whereas this carbon demand is provided by the host plant through photosynthesis (Fall et al., Citation2022). In addition, mycorrhizal fungi can represent between 20% and 80% of soil microbial biomass and contain 15% organic carbon (Fall et al., Citation2022; Kabir et al., Citation1997; Leake et al., Citation2004). Furthermore, previous research has shown that simultaneous inoculation with mycorrhizal fungi improves use of insoluble P forms and stimulates plant development better than inoculation with either P microbes or chemical P alone (Müller, Citation2021).
The results showed that cyanobacteria also promoted SOC increases, supporting the mechanism proposed in Section 3.2. These organisms are efficient in fixing CO2 and converting this energy into biomass (Zhang et al., Citation2017) and atmospheric nitrogen into biologically useful and reactive species, which contribute to plant growth and indirect carbon fixation (Popa et al., Citation2007). In addition, cyanobacteria provide a favourable microhabitat for soil biota and their extracellular secretions mostly composed of exopolysaccharides (EPSs) which act as gluing agents binding soil particles, promoting the formation of soil aggregates thus increasing soil stability and fertility (Chamizo et al., Citation2018). While microalgae are able to colonize soil surfaces, promote carbon accumulation and soil aggregate stability through similar mechanisms to those of cyanobacteria (e.g. release of EPSs), these did not have a significant effect in the model, possibly due to the few numbers of observations included in the database (N = 4). Also, PGPR, which did not have a significant effect on ΔSOC in our models, are known to promote plant growth indirectly, by either facilitating resource acquisition (nitrogen, phosphorus, and essential minerals) or by controlling plant hormone levels or the development of pathogens’ biocontrol agents. While PGPR were the most well-represented grouping from our database (87 observations in the final model), it is possible the lack of significant effects for this grouping may owe to the broadness of the category, which includes a wide diversity of taxonomical and functional species.
4.2. Influence of crop type
Crop type proved to be the categorical variable which had the greatest range of response. Accordingly, it was also the categorical variable that explained the greatest amount of variability of ΔSOC (27% of the variance). Importantly, crop type includes crucial plant physiological characteristics such as root turnover rates, biomass composition (including contents of lipids, proteins, carbohydrates, lignin, celluloses, etc.), or nutritional composition and stoichiometries, but also encapsulates crucial differences in farm management such as soil management, rotations, and management of residues, all of which can have profound influences on SOC stocks and changes over time. Oldfield et al. (Citation2019) found in their meta-analysis that the larg est gains in yield occur between SOC concentrations of 0.1% and 2.0%, and our results show that the estimates for all the categories are in this range (). Schütz et al. (Citation2018) found positive responses of yield to biofertilization for all crop types. In our study, only other crops and fodder crops showed a negative impact in terms of SOC increase, possibly owing to disparate composition and low observation numbers within these groups. For instance, other crops included a diverse set of crops including aromatic crops, oilseed crops, sugarcane, and other specialty crops, while fodder crops included only two observations (Table S2). Legumes had one of the largest estimates (0.78 g C kg−1). Soils fixing more N due to the nitrogen-fixing symbiotic association with plants may have greater SOC because N increases crop yields, which can increase the return of plant residues into the soil and potentially build SOC (Powlson et al., Citation2011), this being related to one of the mechanisms identified during the literature review process (section 3.2 above).
4.3. Influence of fertilization
By coding experimental fertilization regime into the database observations, we aimed to deduce how biofertilization may interact with different fertilization practices in terms of ΔSOC. We expected that the relative rate of SOC change promoted by biofertilization could be influenced by interactions with management such as fertilization. For instance, a recent meta-analysis by Gross and Glaser (Citation2021) found that, beyond the gains from direct manure applications, SOC was also increased by additional chemical fertilization, which they attributed to increased root growth and crop residues. Also, Han et al. (Citation2016) found that chemical fertilizers with manure applications could raise topsoil organic carbon in average by 3.5 g C kg−1 over 22 years.
In general, there were no great differences between different fertilization practices, though those including mineral fertilization had the largest estimates (). This is in agreement with Gross and Glaser (Citation2021) who obtained similar results, attributing it to mineral fertilizers’ stimulation of below- and aboveground plant growth, thereby promoting ΔSOC. Although the aerial part is removed after harvest, increased root growth and crop residue have a positive effect on ΔSOC content compared to unfertilized treatments (Lu et al., Citation2011). For instance, Han et al. (Citation2016), who performed a meta-analysis based on subject to different fertilizer managements (1741 pairwise comparisons) found increases in topsoil SOC of 0.9–2.3 g C kg−1 when only chemical fertilizer is applied. It is also notable that the effects of increased ΔSOC were detectable and similar under organic fertilization and using chemical fertilization with organic manures (0.42 and 0.49 g C kg−1 respectively).
4.4. Influence of study length
Study length proved to be a relevant predictor for SOC changes, whereas the differences followed the expected trend of greater SOC accrual with time. This aligns with the concept of SOC turnover rates and the time required for changes in soil microbial communities and nutrient cycling processes to occur (Six et al., Citation2002). Long-term studies allow for the accumulation of organic matter, the establishment of beneficial microbial populations, and the development of stable soil aggregates, all of which contribute to enhanced SOC levels (Lehmann et al., Citation2015; Luo et al., Citation2010). For instance, a meta-analysis conducted by Johnson et al. (Citation2019), they found that longer-term studies consistently reported higher increases in SOC compared to shorter-term studies, and this must be taken into account. Our study number was reasonably balanced between study lengths (20, 29 and 10 studies for short, medium and long, respectively). It is notable short study lengths had positive estimates of SOC accrual, as did medium-term studies. Though differences in SOC contents are more easily detected in long-term studies (and particularly for field studies), fertilization experiments do detect increases in SOC contents on a short scale and using different experimental set-ups. For instance, Gong et al. (Citation2012) in a short-term pot experiment with maize cultivation, detected increases in SOC contents after only three months. A recent meta-analysis on fertilizer reduction found that short term (1–2 years, based on 147 paired comparisons) reductions in N fertilization reduced soil organic carbon concentrations by an estimated 3.8% (Li et al., Citation2022).
4.5. Influence of climate zone and soil type
The analysis based on climatic zone showed that significant (and positive) effects on ΔSOC were associated only with topical moist climates. Notably, dry climates had non-significant estimates of ΔSOC. These results would suggest that water availability was an important factor for predicting ΔSOC with biofertilizer application. For instance, this may be due to the persistence and proliferation of the microbiological products applied, or limits on the primary productivity of the test crops or autotrophic organisms (i.e. cyanobacteria biofertilizers).
It is important to keep in mind that the studies consulted measured ΔSOC in the short or medium term, and the results do not correspond to SOC storage potential. Non-tropical soils are typically more enriched in C than tropical soils and have a higher natural accumulation due to lower decomposition rates (Lal, Citation2004), but it is also the case that tropical low-SOC soils have a larger potential for SOC accumulation due to changes in management (West & Six, Citation2007). Within our dataset, the levels of organic matter based on climate zone follow the expected patterns: Tropical dry, moist, and wet soils had average initial SOC concentrations of 7.7, 8.3, and 12.4 g C kg−1, respectively, while warm temperate dry, warm temperate moist, and cool temperate moist soils had average initial SOC concentrations of 11.6, 12.9, and 14.9 g C kg−1, respectively. A significant proportion of the studies included in the database were conducted in regions characterized by tropical climates soils with low SOC levels due to pedoclimatic conditions. In addition, land management and activities such as intensive agriculture, deforestation, and urbanization have been documented to have substantial impacts on SOC contents and human-induced soil degradation in tropical regions, thus providing more incentives for the development of technologies and fertilization practices which protect soil health (Batjes, Citation1996; Jones et al., Citation2003; Lal, Citation2004; Wang et al., Citation2006).
While our analysis suggests that water availability had a larger impact on ΔSOC than temperature, more data would be required for cool temperate moist and warm temperature moist zones (which had only three and nine studies, respectively). Climate zone is a coarse grouping, and more precise results might be found with the inclusion of actual field conditions and meteorological data, where data availability represents a significant hurdle. While our results indicate that biofertilization is more relevant to ΔSOC under conditions of greater water availability, there is significant evidence that biofertilizers mitigate abiotic plant stress, including drought conditions (Berruti et al., Citation2016; Chekwube Enebe & Oluranti Babalola, Citation2018). An analysis of studies testing PGPR and imposing experimental drought conditions on plant growth found that shoot biomass and reproductive yield were consistently greater under drought conditions (Rubin et al., Citation2017).
Similar as to what has occurred with study type or biofertilizer type etc. above, the soil type model showed that most soil types were associated with positive increases in SOC, whereas the estimates were similar to that generated by the global model. The results were also mostly driven by the soil types which were most populous and best represented in the database, and these were the soil types which were significant. Again, this is an indication that biofertilizer can likely be an appropriate strategy for nutrient management and recarbonization in highly varying edaphic contexts. It is evident that more data is needed from underpopulated soil types.
4.6. Influence of study type
Positive ΔSOC estimates were found within all study types, though the response was only significant for the field study grouping which comprised 82% of observations. Considering the challenges in detecting soil carbon changes in field research due to the timeframes involved and the high variability of field conditions, it is thus notable that the compiled database has yielded conclusive results. Study type also determines the relevance of the findings since it incorporates regional characteristics such as meteorologic conditions. Many of the referenced studies tended to replicate or mimic the actual agricultural practices of the zone or system in consideration, including fertilization practices, rotations, etc. and in this case, plants are also harvested at reproductive maturity (Rubin et al., Citation2017).
4.7. Crop yield and SOC
It is expected that biofertilizers promote crop yield (Singh et al., Citation2020), and crop productivity is associated with gains in soil organic carbon (see mechanisms section 3.2). We found a statistically significant positive relationship between yield response and SOC in our model. However, this model only explained about 7% of the total data variance. This low explanatory power may be partly caused by the conversion of crop outputs into a yield response (see methods). During dataset compilation crop productivities were included, though among the consulted works productivity was reported in different units, including total biomass weight, marketable portion weight (e.g. fruit or grain), or market value expressed in monetary units, and it was necessary to standardize this information by calculating yield response as the relative change for the marketable crop output (an approach used by other authors, e.g. Li et al., Citation2022 ).
5. Conclusions
Soil organic carbon is one of the most fundamental predictors of soil health because it plays a key role for soil quality by soil improving physicochemical and biological properties. Therefore, developing -sustainable management of SOM is a major concern for agriculture, land preservation and climate change mitigation. While the carbon markets (voluntary or incentivized) are gaining strength in policies (e.g. in European development programmes, associated with studies such as Mcdonald et al., Citation2021), new fertilizing products and strategies such as biofertilization must be assessed for their full ecosystem impacts and relevance to global nutrient cycling. Our study demonstrates that the application of biofertilizers is associated with positive impacts on SOC at an average of 0.44 g C kg−1. When considering explanatory co-variables, some variability around this average was found, but when exploring categorical variables this was only notable for crop types. These results are relevant for sustainability assessments, proper carbon accounting in agricultural systems, and more generally an improved understanding of how agricultural management affects biogeochemical cycles in the terrestrial agricultural carbon sink which is highly dynamic under human management. In the future, more data is needed from temperate zones, and additional details such as soil biodiversity and environmental conditions must be considered. Additionally, research efforts are still required to understand which organism groups or species are the most appropriate for any given crop or land management techniques.
Supplemental Material_IJAS_revised.docx
Download MS Word (165.9 KB)Disclosure statement
No potential conflict of interest was reported by the author(s).
Data availability statement
The data that support the findings of this study are available from the corresponding author upon reasonable request.
Additional information
Funding
References
- Aloo, B. N., Tripathi, V., Makumba, B. A., & Mbega, E. R. (2022). Plant growth-promoting rhizobacterial biofertilizers for crop production: The past, present, and future. Frontiers in Plant Science, 13, 1–15. https://doi.org/10.3389/FPLS.2022.1002448
- Ansari, R. A., & Mahmood, I. (2017). Optimization of organic and bio-organic fertilizers on soil properties and growth of pigeon pea. Scientia Horticulturae, 226, 1–9.
- Augusto, L., Delerue, F., Gallet-Budynek, A., & Achat, D. L. (2013). Global assessment of limitation to symbiotic nitrogen fixation by phosphorus availability in terrestrial ecosystems using a meta-analysis approach. Global Biogeochemical Cycles, 27(3), 804–815. https://doi.org/10.1002/GBC.20069
- Batjes, N. H. (1996). Total carbon and nitrogen in the soils of the world. European Journal of Soil Science, 47(2), 151–163. https://doi.org/10.1111/j.1365-2389.1996.tb01386.x
- Begum, N., Qin, C., Ahanger, M. A., Raza, S., Khan, M. I., Ashraf, M., Ahmed, N., & Zhang, L. (2019). Role of arbuscular mycorrhizal fungi in plant growth regulation: Implications in abiotic stress tolerance. Frontiers in Plant Science, 10, 1068. https://doi.org/10.3389/FPLS.2019.01068
- Berruti, A., Lumini, E., Balestrini, R., & Bianciotto, V. (2016). Arbuscular mycorrhizal fungi as natural biofertilizers: Let’s benefit from past successes. Frontiers in Microbiology, 6, 1559. https://doi.org/10.3389/fmicb.2015.01559
- Borenstein, M., Hedges, L. V., Higgins, J. P. T., & Rothstein, H. R. (2009). Introduction to meta-analysis (1st ed.). John Wiley & Sons. https://doi.org/10.1002/9780470743386.
- Bradford, M. A., Keiser, A. D., Davies, C. A., Mersmann, C. A., & Strickland, M. S. (2013). Empirical evidence that soil carbon formation from plant inputs is positively related to microbial growth. Biogeochemistry, 113(1–3), 271–281. https://doi.org/10.1007/s10533-012-9822-0
- Chamizo, S., Mugnai, G., Rossi, F., Certini, G., & De Philippis, R. (2018). Cyanobacteria inoculation improves soil stability and fertility on different textured soils: Gaining insights for applicability in soil restoration. Frontiers in Environmental Science, 6, 49. https://doi.org/10.3389/fenvs.2018.00049
- Chander, K., Goyal, S., Mundra, M. C., & Kapoor, K. K. (1997). Organic matter, microbial biomass and enzyme activity of soils under different crop rotations in the tropics. Biology and Fertility of Soils, 24(3), 306–310. https://doi.org/10.1007/S003740050248
- Chekwube Enebe, M., & Oluranti Babalola, O. (2018). The influence of plant growth-promoting rhizobacteria in plant tolerance to abiotic stress: A survival strategy. Applied Microbiology and Biotechnology, 102(18), 7821–7835. https://doi.org/10.1007/s00253-018-9214-z
- Cochran, W. G. (1954). The combination of estimates from different experiments. Biometrics, 10(1), 101–129. https://doi.org/10.2307/3001666
- Dębska, B., Długosz, J., Piotrowska-Długosz, A., & Banach-Szott, M. (2016). The impact of a bio-fertilizer on the soil organic matter status and carbon sequestration – results from a field-scale study. Journal of Soils and Sediments, 16(10), 2335–2343. https://doi.org/10.1007/S11368-016-1430-5
- DeRuyter, Y. S., & Fromme, P. (2007). The molecular structure of the photosynthetic apparatus. In Antonia Herrero & Enrique Flores (Eds.), Aquatic photosynthesis (pp. 201–236). Princeton University Press. https://doi.org/10.1515/9781400849727.201
- Du, Y., Cui, B., Zhang, Q., Wang, Z., Sun, J., & Niu, W. (2020). Effects of manure fertilizer on crop yield and soil properties in China: A meta-analysis. CATENA, 193, Article 104617. https://doi.org/10.1016/j.catena.2020.104617
- Dutta, P., Biswas, S., & Kundu, S. (2014). Effect of organic manures and biofertilizers on production of organic litchi. Journal of Eco-friendly Agriculture, 6(1), 13–15.
- Fall, A. F., Nakabonge, G., Ssekandi, J., Founoune-Mboup, H., Apori, S. O., Ndiaye, A., Badji, A., & Ngom, K. (2022). Roles of arbuscular mycorrhizal fungi on soil fertility: Contribution in the improvement of physical, chemical, and biological properties of the soil. Frontiers in Fungal Biology, 3, 3. https://doi.org/10.3389/FFUNB.2022.723892
- FAO. (2005). The state of food and agriculture. Agricultural trade and poverty: Can trade work for the poor? Food and Agriculture Organization of the United Nations.
- FAO. (2019). Measuring and modelling soil carbon stocks and stock changes in livestock production systems: Guidelines for assessment (Version 1). Livestock Environmental Assessment and Performance (LEAP) Partnership.
- FAO. (2021). Recarbonizing global soils – a technical manual of recommended management practices (Volumes 1–6). Food and Agriculture Organization of the United Nations.
- FAO and IIASA. (2023). Harmonized world soil database version 2.0. https://doi.org/10.4060/cc3823en
- FAO and ITPS. (2015). Status of the world’s soil resources (SWSR) – main report. Food and Agriculture Organization of the United Nations and Intergovernmental Technical Panel on Soils.
- FAO and ITPS. (2021). Recarbonizing global soils – a technical manual of recommended sustainable soil, management. Volume 4: Cropland, grassland, integrated systems and farming approaches – case studies. FAO. https://doi.org/10.4060/cb6598en.
- Fragkos, K. C., Tsagris, M., & Frangos, C. C. (2014). Publication bias in meta-analysis: Confidence intervals for Rosenthal’s fail-safe number. International Scholarly Research Notices, 2014, 1–17. https://doi.org/10.1155/2014/825383
- Gong, W., Yan, X., & Wang, J. (2012). The effect of chemical fertilizer on soil organic carbon renewal and CO2 emission – a pot experiment with maize. Plant and Soil, 353(1–2), 85–94. https://doi.org/10.1007/s11104-011-1011-8
- Gross, A., & Glaser, B. (2021). Meta-analysis on how manure application changes soil organic carbon storage. Scientific Reports, 11(1), 1–13. https://doi.org/10.1038/s41598-021-82739-7
- Han, P., Zhang, W., Wang, G., Sun, W., & Huang, Y. (2016). Changes in soil organic carbon in croplands subjected to fertilizer management: A global meta-analysis. Scientific Reports, 6(1), 1–13. https://doi.org/10.1038/srep27199
- Hardy, R. J., & Thompson, S. G. (1996). A likelihood approach to meta-analysis with random effects. Statistics in Medicine, 15(6), 619–629. https://doi.org/10.1002/(SICI)1097-0258(19960330)15:6<619::AID-SIM188>3.0.CO;2-A
- Harrer, M., Cuijpers, P., Furukawa, T. A., & Ebert, D. D. (2021). Doing meta-analysis with R: A hands-on guide. Chapman and Hall. https://doi.org/10.1201/9781003107347
- Higgins, J. P. T., & Thompson, S. G. (2002). Quantifying heterogeneity in a meta-analysis. Statistics in Medicine, 21(11), 1539–1558. https://doi.org/10.1002/SIM.1186
- Hosseinzadeh, M. H., Ghalavand, A., Boojar, M. M.-A., Modarres-Sanavy, S. A. M., & Mokhtassi-Bidgoli, A. (2021). Application of manure and biofertilizer to improve soil properties and increase grain yield, essential oil and ω3 of purslane (Portulaca oleracea L.) under drought stress. Soil and Tillage Research, 205, 104633. http://dx.doi.org/10.1016/j.still.2020.104633
- IPCC. (2006). Guidelines for national greenhouse gas inventories (Volumes 1–6). IGES.
- Johnson, J. M., Allmaras, R. R., Reicosky, D. C., & Sauer, T. J. (2019). Intra-annual changes in soil organic carbon across a 100-year chronosequence of manure and fertilizer applications. Soil Science Society of America, 83(1), 87–97.
- Jones, R., Hiederer, R., Rusco, E., Loveland, P., & Montanarella, L. (2003). The map of organic carbon in topsoils in Europe.
- Kabir, Z., O’halloran, I. P., Fyles, J. W., & Hamel, C. (1997). Seasonal changes of arbuscular mycorrhizal root colonization. Plant and Soil, 192(2), 285–293. https://doi.org/10.1023/A:1004205828485
- Karl, D., Michaels, A., Bergman, B., Capone, D., Carpenter, E., Letelier, R., Lipschultz, F., Paerl, H., Sigman, D., & Stal, L. (2002). Dinitrogen fixation in the world’s oceans. Biogeochemistry, 57–58(1), 47–98. https://doi.org/10.1023/A:1015798105851
- Kholssi, R., Lougraimzi, H., Grina, F., Lorentz, J. F., Silva, I., Castaño-Sánchez, O., & Marks, E. A. N. (2022). Green agriculture: A review of the application of micro- and macroalgae and their impact on crop production on soil quality. Journal of Soil Science and Plant Nutrition, 22(4), 4627–4641. https://doi.org/10.1007/s42729-022-00944-3
- Krull, E. S., Baldock, J. A., & Skjemstad, J. O. (2003). Importance of mechanisms and processes of the stabilisation of soil organic matter for modelling carbon turnover. Functional Plant Biology, 30(2), 207–222. https://doi.org/10.1071/FP02085
- Kumar, S., Diksha, Sindhu, S. S., & Kumar, R. (2022). Biofertilizers: An ecofriendly technology for nutrient recycling and environmental sustainability. Current Research in Microbial Sciences, 3, Article 100094. https://doi.org/10.1016/J.CRMICR.2021.100094
- Lal, R. (2004). Soil carbon sequestration impacts on global climate change and food security. Science, 304(5677), 1623–1627. https://doi.org/10.1126/science.1097396
- Lal, R. (2008). Carbon sequestration. Philosophical Transactions of the Royal Society B: Biological Sciences, 363(1492), 815–830. https://doi.org/10.1098/rstb.2007.2185
- Lal, R. (2016). Soil health and carbon management. Food and Energy Security, 5(4), 212–222. https://doi.org/10.1002/FES3.96
- Leake, J., Johnson, D., Donnelly, D., Muckle, G., Boddy, L., & Read, D. (2004). Networks of power and influence: The role of mycorrhizal mycelium in controlling plant communities and agroecosytem functioning. Canadian Journal of Botany, 82(8), 1016–1045. https://doi.org/10.1139/b04-060
- Lefèvre, C., Rekik, F., Alcantara, V., & Vargas, R. (2017). Soil organic carbon: The hidden potential (L. Wiese, V. Alcantara, R. Baritz & R. Vargas, Eds., pp. 1–99). Food and Agriculture Organization of the United Nations.
- Lehmann, J., Rillig, M. C., Thies, J., Masiello, C. A., Hockaday, W. C., & Crowley, D. (2015). Biochar effects on soil biota – a review. Soil Biology and Biochemistry, 43(9), 1812–1836. https://doi.org/10.1016/j.soilbio.2011.04.022
- Li, H., Qiu, Y., Yao, T., Ma, Y., Zhang, H., & Yang, X. (2020). Effects of PGPR microbial inoculants on the growth and soil properties of Avena sativa, Medicago sativa, and Cucumis sativus seedlings. Soil and Tillage Research, 199, 104577. http://dx.doi.org/10.1016/j.still.2020.104577
- Li, J., Van Gerrewey, T., & Geelen, D. (2022). A meta-analysis of biostimulant yield effectiveness in field trials. Frontiers in Plant Science, 13, 1–13. https://doi.org/10.3389/fpls.2022.836702
- Liu, Q., Meng, X., Li, M., Raza, W., Liu, D., & Shen, Q. (2020). The growth promotion of peppers (Capsicum annuum L.) by Trichoderma guizhouense NJAU4742-based Biological Organic Fertilizer: Possible role of increasing nutrient availabilities. Microorganisms, 8, 1296.
- Lu, M., Zhou, X., Luo, Y., Yang, Y., Fang, C., Chen, J., & Li, B. (2011). Minor stimulation of soil carbon storage by nitrogen addition: A meta-analysis. Agriculture, Ecosystems and Environment, 140(1–2), 234–244. https://doi.org/10.1016/j.agee.2010.12.010
- Luo, Z., Wang, E., & Sun, O. J. (2010). Can no-tillage stimulate carbon sequestration in agricultural soils? A meta-analysis of paired experiments. Agriculture, Ecosystems & Environment, 139(1–2), 224–231. https://doi.org/10.1016/j.agee.2010.08.006
- Mącik, M., Gryta, A., & Frąc, M. (2020). Biofertilizers in agriculture: An overview on concepts, strategies and effects on soil microorganisms. Advances in Agronomy, 162, 31–87. https://doi.org/10.1016/bs.agron.2020.02.001
- MalamIssa, O., Le Bissonnais, Y., Défarge, C., & Trichet, J. (2001). Role of a cyanobacterial cover on structural stability of sandy soils in the Sahelian part of western Niger. Geoderma, 101(3–4), 15–30. https://doi.org/10.1016/S0016-7061(00)00093-8
- Marks, E. A. N., Montero, O., & Rad, C. (2019). The biostimulating effects of viable microalgal cells applied to a calcareous soil: Increases in bacterial biomass, phosphorus scavenging, and precipitation of carbonates. Science of the Total Environment, 692, 784–790. https://doi.org/10.1016/j.scitotenv.2019.07.289
- Mcdonald, H., Frelih-Larsen, A., Lóránt, A., Duin, L., Andersen, S. P., Costa, G., & Bradley, H. (2021). Carbon farming making agriculture fit for 2030. Policy Department for Economic, Scientific and Quality of Life Policies Directorate-General for Internal Policies.
- Miltner, A., Bombach, P., Schmidt-Brücken, B., & Kästner, M. (2012). SOM genesis: Microbial biomass as a significant source. Biogeochemistry, 111(1–3), 41–55. https://doi.org/10.1007/s10533-011-9658-z
- Mitter, E. K., Tosi, M., Obregón, D., Dunfield, K. E., & Germida, J. J. (2021). Rethinking crop nutrition in times of modern microbiology: Innovative biofertilizer technologies. Frontiers in Sustainable Food Systems, 5, 29. https://doi.org/10.3389/fsufs.2021.606815
- Müller, L. M. (2021). Underground connections: Arbuscular mycorrhizal fungi influence on interspecific plant-plant interactions. Plant Physiology, 187(3), 1270–1272. https://doi.org/10.1093/PLPHYS/KIAB397
- Murugan, R., & Chitraputhirapillai, S. (2011). Effects of combined application of biofertilizers with neem cake on soil fertility, grain yield and protein content of black gram (Vigna mungo (L.) Hepper). World Journal of Agricultural Sciences, 7(5), 583–590.
- Nisha, R., Kaushik, A., & Kaushik, C. P. (2007). Effect of indigenous cyanobacterial application on structural stability and productivity of an organically poor semi-arid soil. Geoderma, 138(1–2), 49–56. https://doi.org/10.1016/j.geoderma.2006.10.007
- Oldfield, E. E., Bradford, M. A., & Wood, S. A. (2019). Global meta-analysis of the relationship between soil organic matter and crop yields. SOIL, 5(1), 15–32. https://doi.org/10.5194/SOIL-5-15-2019
- Pathak, T. B., Maskey, M. L., Dahlberg, J. A., Kearns, F., Bali, K. M., & Zaccaria, D. (2018). Climate change trends and impacts on California agriculture: A detailed review. Agronomy, 8(3), 25. https://doi.org/10.3390/AGRONOMY8030025
- Paustian, K., Lehmann, J., Ogle, S., Reay, D., Robertson, G. P., & Smith, P. (2016). Climate-smart soils. Nature, 532(7597), 49–57. https://doi.org/10.1038/nature17174
- Popa, R., Weber, P. K., Pett-Ridge, J., Finzi, J. A., Fallon, S. J., Hutcheon, I. D., Nealson, K. H., & Capone, D. G. (2007). Carbon and nitrogen fixation and metabolite exchange in and between individual cells of Anabaena oscillarioides. The ISME Journal, 1(4), 354–360. https://doi.org/10.1038/ismej.2007.44
- Powlson, D. S., Whitmore, A. P., & Goulding, K. W. T. (2011). Soil carbon sequestration to mitigate climate change: A critical re-examination to identify the true and the false. European Journal of Soil Science, 62(1), 42–55. https://doi.org/10.1111/j.1365-2389.2010.01342.x
- Reddy, K. S., Karthik, R., & Kumar, G. S. (2021). Biofertilizer for crop production and soil fertility. Just Agriculture, 1, 1–5.
- Riley, R. D., Higgins, J. P. T., & Deeks, J. J. (2011). Interpretation of random effects meta-analyses. BMJ, 342(7804), 964–967. https://doi.org/10.1136/BMJ.D549
- Rose, M., Phuong, T., Nhan, D., Cong, P., Hien, N., & Kennedy, I. (2014). Up to 52% N fertilizer replaced by biofertilizer in lowland rice via farmer participatory research. Agronomy for Sustainable Development, 34(4), 857–868. https://doi.org/10.1007/s13593-014
- Rosenthal, R. (1979). The file drawer problem and tolerance for null results. Psychological Bulletin, 86(3), 638–641. https://doi.org/10.1037/0033-2909.86.3.638
- Rubin, R. L., van Groenigen, K. J., & Hungate, B. A. (2017). Plant growth promoting rhizobacteria are more effective under drought: A meta-analysis. Plant and Soil, 416(1–2), 309–323. https://doi.org/10.1007/s11104-017-3199-8
- Sanderman, J., Hengl, T., & Fiske, G. J. (2017). Soil carbon debt of 12,000 years of human land use. Proceedings of the National Academy of Sciences of the United States of America, 114(36), 9575–9580. https://doi.org/10.1073/pnas.1706103114
- Schmidt, M. W. I., Torn, M. S., Abiven, S., Dittmar, T., Guggenberger, G., Janssens, I. A., Kleber, M., Kögel-Knabner, I., Lehmann, J., Manning, D. A. C., Nannipieri, P., Rasse, D. P., Weiner, S., & Trumbore, S. E. (2011). Persistence of soil organic matter as an ecosystem property. Nature, 478(7367), 49–56. https://doi.org/10.1038/nature10386
- Schütz, L., Gattinger, A., Meier, M., Müller, A., Boller, T., Mäder, P., & Mathimaran, N. (2018). Improving crop yield and nutrient use efficiency via biofertilization – a global meta-analysis. Frontiers in Plant Science, 8, 2204. https://doi.org/10.3389/fpls.2017.02204
- Singh, Y. V., & Dhar, D. W. (2011). Changes in soil organic carbon and microbial population under organically managed rice (Oryza sativa)- wheat (Triticum aestivum) - greengram (Vigna radiata) cropping system. Indian Journal of Agricultural Sciences, 81(4), 363–365.
- Singh, S. R., Najar, G. R., & Singh, U. (2007). Productivity and nutrient uptake of soybean (Glycine max) as influenced by bio-inoculants and farmyard manure under rainfed conditions. Indian Journal of Agronomy, 52(4), 325–329.
- Singh, B., Upadhyay, A. K., Al-Tawaha, T. W., Al-Tawaha, A. R., & Sirajuddin, S. N. (2020). Biofertilizer as a tool for soil fertility management in changing climate. IOP Conference Series: Earth and Environmental Science, 492(1), 012158. https://doi.org/10.1088/1755-1315/492/1/012158
- Sinha, R. K., Valani, D., Chauhan, K., & Agarwal, S. (2010). Embarking on a second green revolution for sustainable agriculture by vermiculture biotechnology using earthworms: Reviving the dreams of Sir Charles Darwin. Journal of Agricultural Biotechnology and Sustainable Development, 2(7), 113–128. https://doi.org/10.5897/JABSD.9000017
- Six, J., Conant, R. T., Paul, E. A., & Paustian, K. (2002). Stabilization mechanisms of soil organic matter: Implications for C-saturation of soils. Plant and Soil, 241, 55–176.
- Stewart, C. E., Plante, A. F., Paustian, K., Conant, R. T., & Six, J. (2008). Soil carbon saturation: Linking concept and measurable carbon pools. Soil Science Society of America Journal, 72(2), 379–392. https://doi.org/10.2136/SSSAJ2007.0104
- Tao, F., Huang, Y., Hungate, B. A., Manzoni, S., Frey, S. D., Schmidt, M. W. I., Reichstein, M., Carvalhais, N., Ciais, P., Jiang, L., Lehmann, J., Wang, Y.-P., Houlton, B. Z., Ahrens, B., Mishra, U., Hugelius, G., Hocking, T. D., Lu, X., Shi, Z., … Luo, Y. (2023). Microbial carbon use efficiency promotes global soil carbon storage. Nature, 618(7967), 981–985. https://doi.org/10.1038/s41586-023-06042-3
- Thomas, L., & Singh, I. (2019). Microbial biofertilizers: Types and applications. In B. Giri, R. Prasad, Q. S. Wu, & A. Varma (Eds.), Biofertilizers for sustainable agriculture and environment (pp. 1–19). Springer. https://doi.org/10.1007/978-3-030-18933-4_1
- Toth, G. B., & Pavia, H. (2007). Induced herbivore resistance in seaweeds: A meta-analysis. Journal of Ecology, 95(3), 425–434. https://doi.org/10.1111/J.1365-2745.2007.01224.X
- Viechtbauer, W. (2010). Conducting meta-analyses in R with the metafor package. Journal of Statistical Software, 36(3), 1–48. https://doi.org/10.18637/JSS.V036.I03
- Viechtbauer, W., Smits, L., Kotz, D., Budé, L., Spigt, M., Serroyen, J., & Crutzen, R. (2015). A simple formula for the calculation of sample size in pilot studies. Journal of Clinical Epidemiology, 68(11), 1375. https://doi.org/10.1016/j.jclinepi.2015.04.014
- Wang, X. B., Cai, D. X., Hoogmoed, W. B., Oenema, O., & Perdok, U. D. (2006). Potential effect of conservation tillage on sustainable land use: A review of global long-term studies. Pedosphere, 16(5), 587–595. https://doi.org/10.1016/S1002-0160(06)60092-1
- Waring, B. G., Álvarez-Cansino, L., Barry, K. E., Becklund, K. K., Dale, S., Gei, M. G., Keller, A. B., Lopez, O. R., Markesteijn, L., Mangan, S., Riggs, C. E., Rodríguez-Ronderos, M. E., Max Segnitz, R., Schnitzer, S. A., & Powers, J. S. (2015). Pervasive and strong effects of plants on soil chemistry: A meta-analysis of individual plant ‘Zinke’ effects. Proceedings of the Royal Society B: Biological Sciences, 282(1812), 20151001. https://doi.org/10.1098/RSPB.2015.1001
- West, T. O., & Six, J. (2007). Considering the influence of sequestration duration and carbon saturation on estimates of soil carbon capacity. Climatic Change, 80(1), 25–41. https://doi.org/10.1007/S10584-006-9173-8
- Yadav, S. K., Khokhar, U. U., Sharma, S. D., & Kumar, P. (2015). Response of strawberry to organic versus inorganic fertilizers. Journal of Plant Nutrition, 39(2), 194–203. http://dx.doi.org/10.1080/01904167.2015.1109115
- Yadav, S. K., Singh, Y., Yadav, M. K., Babu, S., & Singh, K. (2013). Effect of organic nitrogen sources on yield, nutrient uptake and soil. Indian Journal of Agricultural Sciences, 83(2), 170–175.
- Ye, L., Zhao, X., Bao, E., Li, J., Zou, Z., & Cao, K. (2020). Bio-organic fertilizer with reduced rates of chemical fertilization improves soil fertility and enhances tomato yield and quality. Scientific Reports, 10(1), 177. https://doi.org/10.1038/S41598-019-56954-2
- Yilmaz, E., & Sönmez, M. (2017). The role of organic/bio-fertilizer amendment on aggregate stability and organic carbon content in different aggregate scales. Soil and Tillage Research, 168, 118–124.
- Youssef, M. A., & Farag, M. I. H. (2021). Co-application of organic manure and bio-fertilizer to improve soil fertility and production of quinoa and proceeding Jew’s Mallow crops. Journal of Soil Science and Plant Nutrition, 21(3), 2472–2488. http://dx.doi.org/10.1007/s42729-021-00538-5
- Zhang, A., Carroll, A. L., & Atsumi, S. (2017). Carbon recycling by cyanobacteria: Improving CO2 fixation through chemical production. FEMS Microbiology Letters, 364(16), 165. https://doi.org/10.1093/femsle/fnx165