
 ?Mathematical formulae have been encoded as MathML and are displayed in this HTML version using MathJax in order to improve their display. Uncheck the box to turn MathJax off. This feature requires Javascript. Click on a formula to zoom.
ABSTRACT
Objectives
To screen programmed cell death (PCD)-related genes in esophageal squamous cell carcinoma (ESCC) based on transcriptomic data and to explore its clinical value.
Methods
Differentially expressed PCD genes (DEPCDGs) were screened from ESCC transcriptome and clinical data in TCGA database. Univariate COX and LASSO COX were performed on prognostically DEPCDGs in ESCC to develop prognostic model. Differences in immune cell infiltration in different RiskScore groups were determined by ssGSEA and CIBERSORT. The role of RiskScore in immunotherapy response was explored using Tumor Immune Dysfunction and Exclusion (TIDE) and IMvigor210 cohorts.
Results
Fourteen DEPCDGs associated with prognosis were tapped in ESCC. These DEPCDGs form a RiskScore with good predictive performance for prognosis. RiskScore demonstrated excellent prediction accuracy in three data sets. The abundance of M2 macrophages and Tregs was higher in the high RiskScore group, and the abundance of M1 macrophages was higher in the low RiskScore group. The RiskScore also showed good immunotherapy sensitivity. RT-qPCR analysis showed that AUP1, BCAP31, DYRK2, TAF9 and UBQLN2 were higher expression in KYSE-150 cells. Knockdown BCAP31 inhibited migration and invasion.
Conclusion
A prognostic risk model can predict prognosis of ESCC and may be a useful biomarker for risk stratification and immunotherapy assessment.
1. Introduction
Esophageal cancer is a common type of cancer, ranking eighth among all forms of cancer, and is the sixth leading cause of cancer-related deaths globally [Citation1,Citation2]. It is primarily made up of two main subtypes: esophageal squamous cell cancer (ESCC) and esophageal adenocarcinoma (EAC). ESCC is the most common type of esophageal cancer worldwide with a higher occurrence in East Asia and Africa. In contrast, EAC is more common in many developed nations [Citation3]. Despite significant progress in managing ESCC through treatments such as surgery, endoscopic resection, chemoradiotherapy, and immunotherapy, this aggressive tumor poses a significant threat to patients due to its heterogeneity [Citation4]. The development of molecular targeting and immunotherapy in recent years has improved the treatment of ESCC, but there are no reliable markers to predict the efficacy of treatment [Citation5–7]. Therefore, the search for indicators that predict the efficacy of ESCC treatment and evaluate the prognosis has been a research hotspot.
Programmed cell death (PCD) is the spontaneous death of organismal cells in response to relevant signaling pathways and is essential for sustaining normal cell cycle and homeostasis in tissues. Malignant, stressed, damaged, or infected cells are lysed and effectively removed via PCD [Citation8]. During tumorigenesis and progression, aberrant regulation of PCD often leads to uncontrolled proliferation and survival of tumor cells, making it an important aspect of tumor pathology. Earlier PCDs identified include apoptosis, autophagy, and necrosis [Citation9]. In recent years, some novel PCD modalities have been gradually unearthed, including ferroptosis [Citation10,Citation11], cuproptosis [Citation12,Citation13]. Ferroptosis and cuproptosis are considered promising in immunotherapy and tumor radiation therapy [Citation14]. It has been shown that tumor cell iron death is involved in the killing of tumor cells by CD8+ T cells. Activated CD8+ T cells secrete IFN-γ during treatment using immune checkpoint blockade with anti-PD-L1 antibody, lowering tumor cells’ intake of cystine by and increasing lipid peroxidation and ferroptosis [Citation15]. Elemental copper can mediate cell death through mitochondria-dependent increased energy metabolism and reactive oxygen species accumulation-induced cytotoxicity [Citation16]. Copper complexes are not only involved in pancreatic cancer cell death [Citation17] but can also promote tumor growth and metastasis in breast cancer [Citation18]. Cuproptosis was found to remodel the tumor microenvironment (TME) and to enhance the therapeutic response to anti-PD-L1 drugs [Citation19]. It is very promising to explore novel therapeutic approaches for cancer species based on PCD mechanisms.
This study analyzed the prognostic features associated with PCD in ESCC based on multi-genomics and to construct a prognostic model. This study hopes to mine markers with clinical application value through systematic data analysis with the target of guiding the personalized treatment of ESCC patients.
2. Materials and methods
2.1. Data processing and analysis
Sequencing data (tumor: 162, normal: 11) of ESCC stored in TCGA source from the University of Cingifornia Sisha Cruz-Xena (UCSC-Xena) database (https://xenabrowser.net/) were downloaded. The expression values of each gene in the data are expressed as log2(FPKM +1). We also obtained survival information, clinical information (clinical stage, alcohol history, T stage, N stage, M stage, cigarettes per day, age, Barrett's esophagus) corresponding to each sample (Table S1). We also obtained single nucleotide variants (SNV) data for the tumor samples, containing the mutation site and mutation type for each gene within each sample.
2.1.1. Differential analysis and functional enrichment analysis
Differential analysis was performed using the limma package (version 3.32.3) [Citation20] to identify differentially expressed genes (DEGs) in tumor samples in TCGA-ESCC, with normal samples as controls [Citation21]. We extracted PCD genes from the Zou et al. [Citation22] study and de-intersected with DEGs to identify differentially expressed PCD genes (DEPCDGs) in ESCC. To determine the function of DEPCDGs, up-regulated DEPCDGs and down-regulated DEPCDGs were uploaded to the DAVID database (https://david.ncifcrf.gov/) [Citation23] for gene ontology enrichment analysis, respectively, and their involvement in the biological process. p value <0.05 for GO terms was considered to be statistically significant.
2.2. Prognostic model of PCD characteristics in ESCC
Univariate COX analysis of DEPCDGs in ESCC was performed to determine prognostic correlates (p < 0.05). Based on the function of glmnet [Citation24], the effect of multicollinearity was removed by LASSO COX analysis to remove the DEPCDGs with high goodness-of-fit. Finally, according to the expression values of the screened DEPCDGs and the COX coefficients, we constructed the RiskScore for predicting the prognosis of ESCC. The formula for RiskScore was as follows.
In TCGA-ESCC, the RiskScore of the tumor samples was evaluated. The samples were grouped into high RiskScore and low RiskScore groups by taking the median RiskScore value. Random sampling was divided into training and validation sets at 6:4 ratio. Kaplan–Meier (K-M) analysis was performed to show the survival region in TCGA-ESCC, training set, validation set. The survivalROC package [Citation25] was used to plot receiver operating characteristic (ROC) curves for the three cohorts. The accuracy of RiskScore in predicting the survival of ESCC patients at 1, 3, and 5 years was assessed by area under the curve (AUC). Additionally, univariate COX and multivariate COX analyses were used to determine the prognostic independence of the RiskScore based on the RiskScore, clinical stage, alcohol history, T stage, N stage, M stage, cigarettes per day, age, and Barrett's esophagus of the samples in TCGA-ESCC. Based on the functionality of the rms package (version 3.4.0) [Citation26], we integrated clinical information and RiskScore to draw nomograms predicting 1-, 3-, and 5-year survival in ESCC patients.
2.3. Correlation analysis between RiskScore and clinical information
To explore the relationship between ESCC clinical characteristics and RiskScore, we sequentially compared the distributions of clinical stage, alcohol history, T stage, N stage, M stage, cigarettes per day, age, and Barrett's esophagus among samples in the high/low RiskScore group.
2.4. Immune infiltration analysis
In the high/low RiskScore group, we calculated the difference in the degree of infiltration of each immune cell. From a previous study [Citation27,Citation28], marker genes of 28 immune cells were collected to perform ssGSEA. Meanwhile, by the CIBERSORT method [Citation29], we assessed the infiltration abundance of 22 immune cells in the TME.
2.5. Immunotherapy sensitivity analysis
TIDE is an indicator that assesses tumor immune dysfunction and exclusion [Citation30]. A higher TIDE score means a greater possibility of immune evasion, which indicates less immunotherapy benefit. We assessed the TIDE score of samples in TCGA-ESCC in the TIDE website (http://tide.dfci.harvard.edu/). Based on the functionality of the IMvigor210CoreBiologies package [Citation31], we downloaded an immunotherapy treatment received by the sequencing data and treatment response information for the IMvigor210 cohort (Table S2). Based on treatment response, patients were defined as partial response (PR), progressive disease (PD), complete response (CR), and stable disease (SD). We also evaluated the survival trend of patients in the high/low risk group in IMvigor210.
2.6. Cell culture and transfection
Dulbecco’s Modified Eagle Medium (DMEM, Solarbio, Catalog no. 11995) was used to culture Het-1A and KYSE-150 cells (American Type Culture Collection, ATCC, Manassas, VA, USA) in a humidified atmosphere at 37°C with 5% CO2. According to the manufacturer’s protocol of lipofectamine 2000 reagent (Invitrogen; Thermo Fisher Scientific), siBCAP31 (GeneChem Company) were used to knock down BCAP31 expression in KYSE-150 cells. siRNAs targeting BCAP31 (si-BCAP31, 5′- GUUGUUAGUUGGUGGCCGU-3′) and siRNA negative control (si-NC, 5′- UUCUCCGAACGUGUCACGU-3′) were synthesized by Shanghai GenePharma (China).
2.7. Quantitative reverse transcription-polymerase chain reaction (qRT-PCR)
TRIzol (Thermo Fisher, USA) reagent was used for the extraction of total RNA from quadriceps femoris of mice, then qRT-PCR was performed on a LightCycler 480 PCR System (Roche, USA) with the use of FastStart Universal SYBR Green Master. The reaction volume (20 μL) included an appropriate water volume,10 μL of PCR mixture, 0.5 μL of forward and reverse primers, and 2 μL of cDNA template. PCR reactions followed by these procedures: pre-degeneration at 95°C for 30 seconds (s), denaturation at 94°C for 15 s, annealing 56°C for 30 s, extension 72°C for 20 s under 45 cycles. Based on the 2−ΔΔCT method, the expression level of genes was calculated and each sample was performed with three repetitions of technique. The primer pairs of target genes were listed in (), in which the GAPDH gene acted as a reference gene.
Table 1. Primers of genes.
2.8. Cell invasion
For the invasion assays, transwell plates were coated with Matrigel (BD Bioscience) and 5 × 10⁴ KYSE-150 cells were seeded onto the coated filter. Medium supplemented with 10% fetal bovine serum was added to the lower chamber. The cells remaining on the insert were removed after 24 h of incubation using cotton swabs. Next, 0.1% crystal violet was used to stain the cells, followed by photographing and cell number counting under a Qimaging Micropublisher 5.0 RTV microscope camera (Olympus).
2.9. Wound healing assay
KYSE-150 cells were seeded on a 6‐well plate. Cell debris was removed by washing the wounded monolayers using phosphate‐buffered solution. The morphological changes of the cells in each well were observed at 0 and 48 h under a microscope after the formation of wounds.
2.10. Statistical analysis
All the statistical analyses were performed in the R language (version 3.6.0) in the current study. Differences in continuous variables and categorical variables between the two groups were compared by the Wilcoxon rank-sum test and chi-square test, respectively. Log-rank test was used to compare differences in survival time between the two groups. Correlations between survival time and genes were assessed by univariate cox regression. In cellular experiments, we used Student’s t-tests to assess differences between treatment and control groups. Statistically significant difference was defined when p value <0.05.
3. Results
3.1. DEPCDGs in ESCC
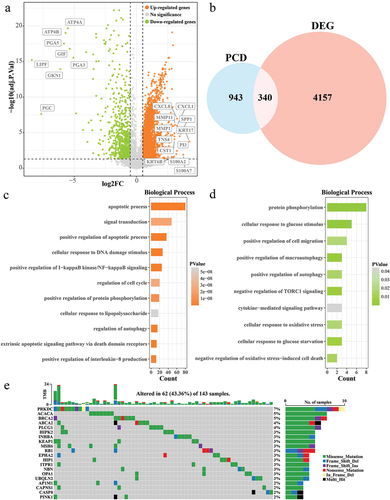
From the tumor samples and normal samples in the TCGA-ESCC cohort, a total of 4497 DEGs (adjust p value <0.05 and |log2FC|>0.5) including3702 up-regulated DEGs and 795 down-regulated DEGs in the tumor samples were screened by performing of tumor samples and normal samples in the TCGA-ESCC cohort (). Taking its intersection with 1283 PCD genes, we extracted 340 DEPCDGs (). We found that the upwardly adjusted DEPCDGs are mainly concentrated in the apoptotic process, signal transduction, positive regulation of I-κB kinase/NF-κB signaling, cellular response to DNA damage stimulus, positive regulation of apoptotic process (). The downwardly adjusted DEPCDGs are mainly concentrated in the positive regulation of cell migration, positive regulation of autophagy, protein phosphorylation, positive regulation of macroautophagy, cellular response to glucose stimulus (). We also observed the mutational landscape of DEPCDGs in ESCC patients. We extracted the top 20 DEPCDGs in terms of mutation frequency and plotted a waterfall plot. We found that PRKDC, ACACA, and BRCA2 had mutation frequencies higher than 5% ().
Figure 1. Biological processes and mutational landscapes involved in DEPCDGs in ESCC. (a) Volcano plot of 4497 DEGs. Orange in the plot is up-regulated DEGs and green is down-regulated DEGs. (b) Wayne diagram of PCD genes and DEGs taking the intersection of 340 DEPCDGs obtained. (c) Upregulation of biological processes in which DEPCDGs are involved. (d) Down-regulation of biological processes involved in DEPCDGs. (e) Waterfall plot showing the mutational landscape of the top 20 DEPCDGs in terms of mutation frequency.
3.2. Prognostic modeling of PCD-related features in ESCC
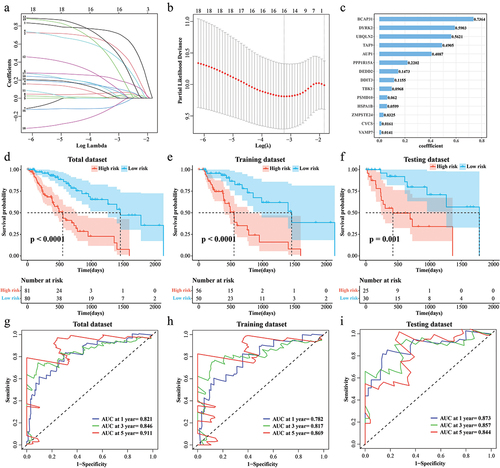
Univariate COX analysis of 340 DEPCDGs was screened and 20 were associated with ESCC prognosis (p < 0.05). LASSO COX analysis identified 14 prognostically DEPCDGs (). BCAP31, DYRK2, UBQLN2, TAF9, AUP1, PPP1R15A, DEDD2, DDIT3, TBK1, PSMD10, HSPA1B, ZMPSTE24, CYCS, VAMP7 were screened (). In TCGA-ESCC, based on the median RiskScore value, the sample was clustered into a high RiskScore group and a low RiskScore group. The results of the K-M curves showed that the low RiskScore group exhibited a significant predominant survival profile (p < 0.001) (). Subsequently, according to the ratio of 6:4, the tumor samples in TCGA-ESCC were randomly sampled into training and validation sets. Tumor patients in the high RiskScore group exhibited significant inferior survival in both the two sets (p < 0.05) (). The ROC curves show that RiskScore has an impact on TCGA-ESCC (AUC at 1 year = 0.821, AUC at 3 year = 0.846, AUC at 5 year = 0.911) (), the training set (AUC at 1 year = 0.782, AUC at 3 year = 0.817, AUC at 5 year = 0.869) (), and the validation set (AUC at 1 year = 0.873, AUC at 3 year = 0.857, AUC at 5 year = 0.844) () showed excellent robustness. In addition, to further validate the screened genes, we determined the mRNA expression levels of AUP1, BCAP31, DYRK2, TAF9, and UBQLN2 in KYSE-150 and normal cells, respectively, and found that all of these genes were significantly upregulated in expression (Figure S1(a–e)). Subsequently, BCAP31 as a key gene with high prognostic relevance to ESCC, therefore, we chose this gene for knockdown experiments and found that knockdown of BCAP31 inhibited the migration and invasion of KYSE-150 cells (Figure S1(f–i)).
Figure 2. Prognostic modeling of PCD-related features in ESCC. (a) Trends in the coefficient trajectories of the independent variables in the LASSO COX analysis. (b) Confidence interval for the penalty parameter λ based on 10-fold cross-validation. (c) LASSO COX regression coefficients for prognosis-related DEPCDGs. (d-f) K-M curves for patients in the high/low RiskScore group in TCGA-ESCC, training set, and validation set. (g-i) ROC curves for TCGA-ESCC, training set, and RiskScore in the validation set to predict 1-, 3-, and 5-year patient survival.
3.3. Correlation of RiskScore with clinical phenotypes
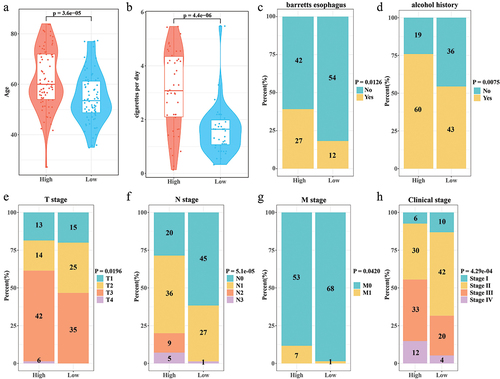
High-RiskScore patients tended to age older and smoked more cigarettes per day (). Compared with low RiskScore group, patients in the high RiskScore group had noticeably more long-term alcohol history and Barrett's esophagus pathology than in the (). Patients with advanced stages (T3+T4, N2+N3, M1, Stage III+Stage IV) were more concentrated in the high RiskScore group (Figure (e–h)).
Figure 3. Correlation of RiskScore with clinical phenotypes. (a) Age distribution of samples in the high/low RiskScore. (b) Distribution of the number of cigarettes smoked per day for samples in the high/low RiskScore. (c) Barretts esophagus pathology for samples in high/low RiskScore. (d) The alcohol history of the samples in the high/low RiskScore. (e-h) T stage, N stage, M stage, Clinical stage distribution of samples in high/low RiskScore.
3.4. Independence of nomogram and RiskScore
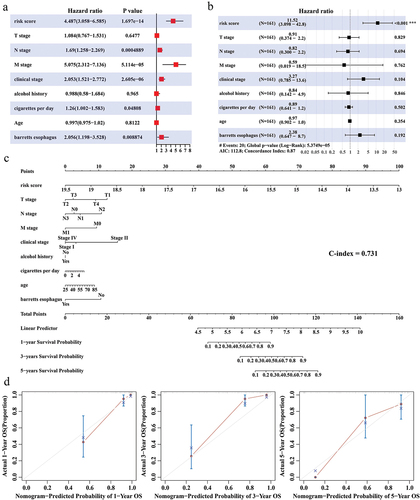
Whether RiskScore can serve as an independent indicator to assess the prognosis of ESCC patients was explored. RiskScore was confirmed as an independent indicator for ESCC prognosis (univariate COX: HR = 4.487, 95% CI = 3.058–6.585, p = 1.697e-14; multivariate COX: HR = 11.52, 95% CI=(3.098–42.8, p < 0.001)) (). Integrating RiskScore, clinical stage, alcohol history, T stage, N stage, M stage, cigarettes per day, age, and Barrett's esophagus, we plotted the predicted 1-, 3-, and 5-year survival of ESCC patients in the nomogram (C-index = 0.731) (). The difference between the overall survival time predicted by the nomogram at 1, 3, and 5 years, respectively, and the actual survival time was not significant (p>0.05) ().
Figure 4. Independence of Nomogram and RiskScore. (a,b) Univariate COX and multivariate COX analyses integrating RiskScore, T stage, N stage, M stage, clinical stage, alcohol history, cigarettes per day, age, and Barrett's esophagus. (c) Nomogram predicting 1-, 3-, and 5-year survival in ESCC patients. (d) Calibration curves for Nomogram prediction of 1-, 3-, and 5-year survival and actual survival in ESCC patients.
3.5. Relationship between immune cell infiltration microenvironment and RiskScore
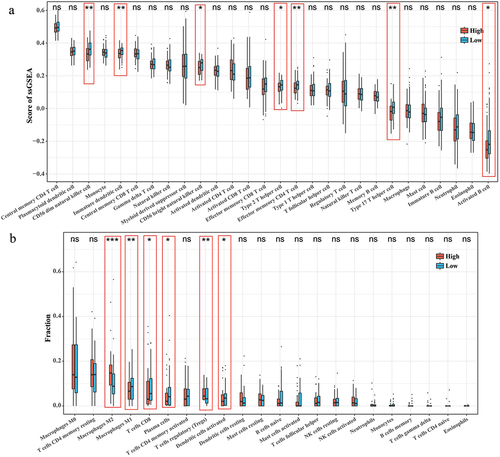
According to the ssGSEA results of 28 immune cell activities, Immature dendritic cell, Type 2 T helper cell, CD56 dim natural killer cell within the high RiskScore group, effector memory CD4 T cell, CD56 bright natural killer cell, Type 17 T helper cell, Activated B cell had significantly lower scores than the low RiskScore group (p < 0.05) (). Based on the CIBERSORT results of the infiltration abundance of 22 immune cells, the infiltration abundance of Macrophages M2, T cells regulatory (Tregs) was noticeably higher in the high RiskScore group. On the contrary, compared with the low RiskScore group, high RiskScore group had significantly less infiltration (p < 0.05) abundance of Macrophages M1, Plasma cells, T cells CD8, and Dendritic cells activated (). The above data demonstrated that the immune microenvironment within the high RiskScore group was more suppressed.
Figure 5. Correlation between RiskScore and immune cell infiltration microenvironment. (a) ssGSEA results for 28 immune cell activity scores in the high/low RiskScore group. (b) CIBERSORT results for the abundance of 22 immune cell infiltrates in the high/low RiskScore group.
3.6. Relationship between immunotherapy and RiskScore
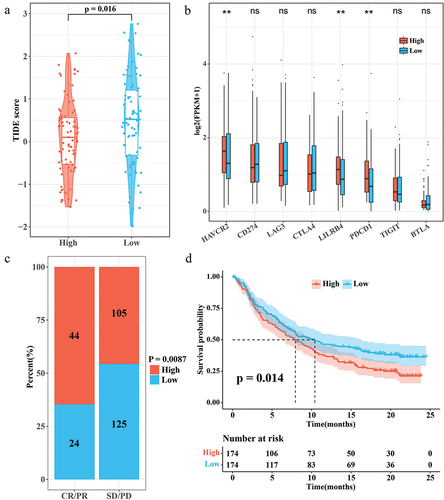
According to the results of TIDE score, patients in the low RiskScore group showed a higher TIDE score (). This suggests that ESCC patients with high RiskScore may be more suitable for immunotherapy. HAVCR2, LILRB4, and PDCD1 showed a trend toward higher expression in the high RiskScore group (). In the immunotherapy cohort IMvigor210, the proportion of patients with high RiskScore was higher in the CR/PR group (). Interestingly, in IMvigor210, patients with low RiskScore showed a significant survival advantage (p < 0.05) (). These results suggest that patients with a high RiskScore may be better suited for immunotherapy. RiskScore can also be used as a prognostic indicator for prognostic assessment inside the IMvigor210 dataset.
Figure 6. Correlation between RiskScore and immunotherapy. (a) TIDE score for the high/low RiskScore group. (b) Expression levels of immune checkpoint genes in the high/low RiskScore group. (c) Proportion of patients with high/low RiskScore in the CR/PR and SD/PD groups in the IMvigor210 cohort. (d) K-M survival curves for the high/low RiskScore group in the IMvigor210 cohort.
4. Discussion
ESCC is a common malignant tumor with a low survival rate, and chemotherapy as well as other methods fail to completely improve the prognosis of patients. Novel biomarkers are urgently required to enhance the survival of ESCC. In this study, DEPCDGs identified in ESCC were largely enriched with positive regulation of signal transduction, I-κB kinase/NF-κB signaling, apoptotic process, and positive regulation of apoptotic process, cellular response to DNA damage stimulus. DNA damage stimulus [Citation32], NF-κB signaling [Citation33] are important regulatory pathways in cancer progression.
In this study, 14 prognostically relevant DEPCDGs were included in the RiskScore, which were BCAP31, DYRK2, UBQLN2, TAF9, AUP1, PPP1R15A, DEDD2, DDIT3, TBK1, PSMD10, HSPA1B, ZMPSTE24, CYCS, and VAMP7. These genes are associated with cancer progression. Expression of BCAP31 is associated with cancer, and silencing BCAP31 expression inhibits emerin function thereby restoring β-catenin protein levels, a phenomenon that deregulates tumor suppression in colorectal cancer cells [Citation34]. DYRK2 regulates the cell cycle of cancer cells and promotes tumor progression by modulating the G1/S transition. In addition, DYRK2 regulates epithelial mesenchymal transition and stemness in cancer cells [Citation35]. UBQLN2 is associated with radiosensitivity in ESCC and is considered a reliable therapeutic target. It was found that silencing UBQLN2 in ESCC activated the p38 MAPK pathway and thus enhanced radiosensitivity [Citation36]. TAF9 is also associated with radiosensitization, and TAF9 enhances the radiation tolerance of enhanced breast cancer cells [Citation37]. AUP1 regulates lipid metabolic responses in renal clear cell carcinoma and induces lipid accumulation in cancer cells accelerating cancer progression [Citation38]. A study by Wang et al. identified PPP1R15A as a promising therapeutic target in tumor immunotherapy by using single-cell data, whereby PPP1R15A counteracted the immune activity of antitumor drugs [Citation39]. DDIT3 regulates gastric cancer cell stemness [Citation40]. TBK1 regulates inflammatory cytokine production and immune system activity in the immune microenvironment by activating NF-κB signaling [Citation41]. PSMD10 was found to promote tumor cell cycle progression [Citation42]. Up-regulation of HSPA1B expression contributes to poor prognosis in colorectal cancer [Citation43]. ZMPSTE24 is a DNA damage response-associated gene, which was found to exhibit concordance in colorectal and gastric cancers with the MSI-H phenotype [Citation44]. CYCS is a pro-apoptotic factor, and CYCS inhibits cellular value-addition and promotes apoptotic responses in tumor cells to inhibit cancer progression [Citation45]. VAMP7 is an important autophagy factor that regulates the immunogenicity of cancer cell death or inflammation [Citation46]. These genes are associated with cancer progression or different PCD modalities, and ESCC prognostic models constructed with these genes are reasonable.
Among the RiskScore subgroups, the infiltration abundance of Macrophages M2, Tregs was high within the high RiskScore group. M2 type macrophages stimulates tumor growth development immunosuppression, promotion of tissue remodeling, metastasis, and neo-angiogenesis. Different stimulants, including IL-4, IL-13, IL-1α and other cytokines, as well as cellular metabolites such as spermine and spermidine, can all activate the polarization of M2 macrophages [Citation47,Citation48]. Tregs play a dual role in tumors, promoting tumor development or inhibiting tumor progression, which correlates with the tumor ecological niche. Tregs exhibit pro-tumorigenic effects when they limit the inflammatory response [Citation49]. In contrast, the infiltration abundance of Macrophage M1 was higher in the low RiskScore group. Macrophage M1 showed anti-tumor activity by up-regulating the expression of pro-inflammatory molecules, such as inducible iNOS, tumor necrosis factor, and IL-1β, which in turn showed anti-tumor activity [Citation50]. The results based on immune infiltration analysis suggest that a pro-tumorigenic environment was exhibited in the high RiskScore group, which could be a potential culprit for their poor prognosis. This phenomenon is also reflected in immunotherapy sensitivity. ESCC patients with high RiskScore may be more suitable for immunotherapy. And the expression levels of HAVCR2, LILRB4, and PDCD1 were higher in the high RiskScore group. The essence of the immune escape phenomenon is that the immune checkpoint genes on the surface of tumor cells inhibit the immune regulation of tumor cells, and the immune cells are restricted from immunotherapy effects [Citation51]. Immunotherapy activates immune cell activity and relieves immune escape in several ways [Citation52]. Based on this phenomenon, we hypothesized that excessive immune checkpoint proteins in the tumor microenvironment of patients in the high RiskScore group may have suppressed immune cell activity. It can be seen that the ESCC prognostic model may be able to assess the immune status of the tumor microenvironment of patients using RiskScore and provide more precise treatment guidance. However, this study still has some limitations. First, this study lacked cellular assays to validate the function of DEPCDGs in RiskScore in ESCC. Second, in order to be able to use the present model in the clinic, the accuracy should be further validated in a multicenter, large-sample cohort subsequently.
5. Conclusion
Overall, this study identifies a prognostic model for PCD characterization in ESCC through comprehensive and integrated data analysis and allows assessment of immune microenvironmental status and immunotherapeutic susceptibility in patients with different RiskScore subgroups. It demonstrated high robustness in the evaluation cohort and is a potentially reliable metric. Our study provides an important basis for future research on clinical treatment and immunotherapy in ESCC.
Abbreviations
| ESCC | = | Esophageal squamous cancer |
| PCD | = | Programmed cell death |
| UCSC-Xena | = | University Of Cingifornia Sisha Cruz-Xena |
| TCGA | = | The cancer genome atlas |
| SNV | = | Single nucleotide variants |
| DEGs | = | Differential expression genes |
| DEPCDGs | = | Differential expression programmed cell death genes |
| LASSO | = | Least absolute shrinkage and selection operator |
| ROC | = | Receiver operating characteristic |
| AUC | = | Area under the curve |
| ssGSEA | = | Single-sample gene set enrichment analysis |
| TIDE | = | Tumor Immune Dysfunction and Exclusion |
| CR | = | Complete response |
| PR | = | Partial response |
| SD | = | Stable disease |
| PD | = | Progressive disease |
Author contributions
All authors contributed to this present work: M Chen, YJ Qi, and HD Chen concepted and designed the research, SH Zhang, YB Du and SG Gao acquired the data, SG Gao, HD Chen analyzed and interpreted data. SG Gao, SH Zhang and M Chen drafted the manuscript, M Chen, HD Chen, YB Du and YJ Qi revised manuscript for important intellectual content. All authors read and approved the manuscript, and to be accountable for all aspects of the work in ensuring that questions related to the accuracy or integrity of any part of the work are appropriately investigated and resolved.
Declaration of interest
The authors have no relevant affiliations or financial involvement with any organization or entity with a financial interest in or financial conflict with the subject matter or materials discussed in the manuscript. This includes employment, consultancies, honoraria, stock ownership or options, expert testimony, grants or patents received or pending, or royalties.
Reviewer disclosures
Peer reviewers on this manuscript have no relevant financial or other relationships to disclose.
Figure S1.jpg
Download JPEG Image (785.2 KB)
Description of supplementary materials.docx
Download MS Word (14.5 KB)Table S2.xlsx
Download MS Excel (6.4 KB)Table S1.xlsx
Download MS Excel (7.1 KB)Data availability statement
The full analysis of raw data is available in the Github (https://github.com/1MinChen/Raw-data-for-article.git).
Supplementary material
Supplemental data for this article can be accessed online at https://doi.org/10.1080/14737140.2024.2377184.
Additional information
Funding
References
- Wang Y, Cheng J, Xie D, et al. NS1-binding protein radiosensitizes esophageal squamous cell carcinoma by transcriptionally suppressing c-Myc. Cancer Commun (Lond). 2018 Jun 5;38(1):33. doi: 10.1186/s40880-018-0307-y
- Zhan J, Wang W, Tang Y, et al. Development of a prognostic signature for esophageal cancer based on a novel 7-DNA damage repair genes signature. Biocell. 2022;46(12):2601–2613. doi: 10.32604/biocell.2022.021300
- de Gouw D, Klarenbeek BR, Driessen M, et al. Detecting pathological complete response in esophageal cancer after neoadjuvant therapy based on imaging techniques: a diagnostic systematic review and meta-analysis. J Thorac Oncol. 2019 Jul;14(7):1156–1171. doi: 10.1016/j.jtho.2019.04.004
- Rogers JE, Sewastjanow-Silva M, Waters RE, et al. Esophageal cancer: emerging therapeutics. Expert Opin Ther Targets. 2022 Feb;26(2):107–117. doi: 10.1080/14728222.2022.2036718
- Jordan T, Mastnak DM, Palamar N, et al. Nutritional therapy for patients with esophageal cancer. Nutr Cancer. 2018 Jan;70(1):23–29. doi: 10.1080/01635581.2017.1374417
- Watanabe M, Otake R, Kozuki R, et al. Recent progress in multidisciplinary treatment for patients with esophageal cancer. Surg Today. 2020 Jan;50(1):12–20. doi: 10.1007/s00595-019-01878-7
- Harada K, Yamamoto S, Kato K. Pembrolizumab for the treatment of advanced esophageal cancer. Future Oncol. 2022 Jun;18(18):2311–2319. doi: 10.2217/fon-2022-0108
- Kopeina GS, Zhivotovsky B. Programmed cell death: past, present and future. Biochem Biophys Res Commun. 2022 Dec 10;633:55–58. doi: 10.1016/j.bbrc.2022.09.022
- Liu J, Hong M, Li Y, et al. Programmed cell death tunes tumor immunity. Front Immunol. 2022;13:847345. doi: 10.3389/fimmu.2022.847345
- Lei G, Zhuang L, Gan B. Targeting ferroptosis as a vulnerability in cancer. Nat Rev Cancer. 2022 Jul;22(7):381–396. doi: 10.1038/s41568-022-00459-0
- Zhang C, Liu X, Jin S, et al. Ferroptosis in cancer therapy: a novel approach to reversing drug resistance. Mol Cancer. 2022 Feb 12;21(1):47. doi: 10.1186/s12943-022-01530-y
- Tong X, Tang R, Xiao M, et al. Targeting cell death pathways for cancer therapy: recent developments in necroptosis, pyroptosis, ferroptosis, and cuproptosis research. J Hematol Oncol. 2022 Dec 8;15(1):174. doi: 10.1186/s13045-022-01392-3
- Hui D, Ting X, Hanxiang Y, et al. Identification and immune characteristics of cuproptosis-related genes in osteoarthritis. J Biol Regul Homeost Agents. 2023 Mar 20;37(3):1335–1351.
- Dong Y, Xu C, Guo J, et al. Advances in ferroptosis of cancer therapy. Oncologie. 2024;26(1):1–8. doi: 10.1515/oncologie-2023-0513
- Wang W, Green M, Choi JE, et al. CD8(+) T cells regulate tumour ferroptosis during cancer immunotherapy. Nature. 2019 May;569(7755):270–274. doi: 10.1038/s41586-019-1170-y
- Ge EJ, Bush AI, Casini A, et al. Connecting copper and cancer: from transition metal signalling to metalloplasia. Nat Rev Cancer. 2022 Feb;22(2):102–113. doi: 10.1038/s41568-021-00417-2
- Gou Y, Chen M, Li S, et al. Dithiocarbazate-copper complexes for bioimaging and treatment of pancreatic cancer. J Med Chem. 2021 May 13;64(9):5485–5499. doi: 10.1021/acs.jmedchem.0c01936
- Shanbhag V, Jasmer-McDonald K, Zhu S, et al. ATP7A delivers copper to the lysyl oxidase family of enzymes and promotes tumorigenesis and metastasis. Proc Natl Acad Sci USA. 2019 Apr 2;116(14):6836–6841. doi: 10.1073/pnas.1817473116
- Guo B, Yang F, Zhang L, et al. Cuproptosis induced by ROS responsive nanoparticles with elesclomol and copper combined with alphapd-l1 for enhanced cancer immunotherapy. Adv Mater. 2023 Jun;35(22):e2212267. doi: 10.1002/adma.202212267
- Ritchie ME, Phipson B, Wu D, et al. limma powers differential expression analyses for RNA-sequencing and microarray studies. Nucleic Acids Res. 2015 Apr 20;43(7):e47. doi: 10.1093/nar/gkv007
- Song Z, Yu J, Wang M, et al. CHDTEPDB: transcriptome expression profile database and interactive analysis platform for congenital heart disease. Congenit Heart Dis. 2023;18(6):693–701. doi: 10.32604/chd.2024.048081
- Zou Y, Xie J, Zheng S, et al. Leveraging diverse cell-death patterns to predict the prognosis and drug sensitivity of triple-negative breast cancer patients after surgery. Int J Surg. 2022 Nov;107:106936. doi: 10.1016/j.ijsu.2022.106936
- Dennis G Jr., Sherman BT, Hosack DA, et al. DAVID: database for annotation, visualization, and integrated discovery. Genome Biol. 2003;4(5):3. doi: 10.1186/gb-2003-4-5-p3
- Simon N, Friedman J, Hastie T, et al. Regularization paths for cox’s proportional hazards model via coordinate descent. J Stat Softw. 2011 Mar;39(5):1–13. doi: 10.18637/jss.v039.i05
- Heagerty PJ, Saha-Chaudhuri P, Saha-Chaudhuri MP. Package ‘survivalROC’. San Francisco: GitHub; 2013.
- Harrell FE Jr, Harrell MFE Jr, Hmisc D. Package ‘rms’. Vanderbilt Univ. 2017;229:Q8.
- Charoentong P, Finotello F, Angelova M, et al. Pan-cancer immunogenomic analyses reveal genotype-immunophenotype relationships and predictors of response to checkpoint blockade. Cell Rep. 2017 Jan 3;18(1):248–262. doi: 10.1016/j.celrep.2016.12.019
- Lin X, Tian C, Pan F, et al. A novel immune-associated prognostic signature based on the immune cell infiltration analysis for hepatocellular carcinoma. Oncologie. 2024;26(1):91–103. doi: 10.1515/oncologie-2023-0360
- Chen B, Khodadoust MS, Liu CL, et al. Profiling tumor infiltrating immune cells with CIBERSORT. Methods Mol Biol. 2018;1711:243–259.
- Jiang P, Gu S, Pan D, et al. Signatures of T cell dysfunction and exclusion predict cancer immunotherapy response. Nat Med. 2018 Oct;24(10):1550–1558. doi: 10.1038/s41591-018-0136-1
- Mariathasan S, Turley SJ, Nickles D, et al. TGFbeta attenuates tumour response to PD-L1 blockade by contributing to exclusion of T cells. Nature. 2018 Feb 22;554(7693):544–548. doi: 10.1038/nature25501
- Heitmeir B, Deniz M, Janni W, et al. Circulating tumor cells in breast cancer patients: a balancing act between stemness, EMT features and DNA damage responses. Cancers (Basel). 2022 Feb 16;14(4):997. doi: 10.3390/cancers14040997
- Shang Z, Yu J, Sun L, et al. LncRNA PCAT1 activates AKT and NF-kappaB signaling in castration-resistant prostate cancer by regulating the PHLPP/FKBP51/IKKalpha complex. Nucleic Acids Res. 2019 May 7;47(8):4211–4225. doi: 10.1093/nar/gkz108
- Han L, Shi J, Zhao L, et al. BCAP31 is involved in modulating colorectal cancer cell proliferation via the Emerin/beta-catenin axis. Exp Cell Res. 2022 Sep 1;418(1):113265. doi: 10.1016/j.yexcr.2022.113265
- Yoshida S, Yoshida K. Multiple functions of DYRK2 in cancer and tissue development. FEBS Lett. 2019 Nov;593(21):2953–2965. doi: 10.1002/1873-3468.13601
- Wang JL, Mu XY, Ma R, et al. Silencing UBQLN2 enhances the radiosensitivity of esophageal squamous cell carcinoma (ESCC) via activating p38 MAPK. J Oncol. 2023;2023:1–11. doi: 10.1155/2023/2339732
- Miao W, Bade D, Wang Y. Targeted proteomic analysis revealed kinome reprogramming during acquisition of radioresistance in breast cancer cells. J Proteome Res. 2021 May 7;20(5):2830–2838. doi: 10.1021/acs.jproteome.1c00075
- Chen C, Zhao W, Lu X, et al. AUP1 regulates lipid metabolism and induces lipid accumulation to accelerate the progression of renal clear cell carcinoma. Cancer Sci. 2022 Aug;113(8):2600–2615. doi: 10.1111/cas.15445
- Wang R, Zhang Y, Guo S, et al. Single-cell RNA sequencing reveals the suppressive effect of PPP1R15A inhibitor Sephin1 in antitumor immunity. iScience. 2023 Feb 17;26(2):105954. doi: 10.1016/j.isci.2023.105954
- Lin H, Liu S, Gao W, et al. DDIT3 modulates cancer stemness in gastric cancer by directly regulating CEBPbeta. J Pharm Pharmacol. 2020 Jun;72(6):807–815. doi: 10.1111/jphp.13243
- Runde AP, Mack R, Jp S, et al. The role of TBK1 in cancer pathogenesis and anticancer immunity. J Exp Clin Cancer Res. 2022 Apr 9;41(1):135. doi: 10.1186/s13046-022-02352-y
- Hao P, Yue F, Xian X, et al. Inhibiting effect of MicroRNA-3619-5p/PSMD10 axis on liver cancer cell growth in vivo and in vitro. Life Sci. 2020 Aug 1;254:117632. doi: 10.1016/j.lfs.2020.117632
- Guan Y, Zhu X, Liang J, et al. Upregulation of HSPA1A/HSPA1B/HSPA7 and downregulation of HSPA9 were related to poor survival in colon cancer. Front Oncol. 2021;11:749673. doi: 10.3389/fonc.2021.749673
- Lee JH, Yoo NJ, Kim MS, et al. Mutational and expressional alterations of ZMPSTE24, DNA damage response-related gene, in gastric and colorectal cancers. Pathol Res Pract. 2016 Dec;212(12):1113–1118. doi: 10.1016/j.prp.2016.10.001
- Ying L, Hao M, Zhang Z, et al. Medicarpin suppresses proliferation and triggers apoptosis by upregulation of BID, BAX, CASP3, CASP8, and CYCS in glioblastoma. Chem Biol Drug Des. 2023 Nov;102(5):1097–1109. doi: 10.1111/cbdd.14309
- Fader CM, Aguilera MO, Colombo MI. ATP is released from autophagic vesicles to the extracellular space in a VAMP7-dependent manner. Autophagy. 2012 Dec;8(12):1741–1756. doi: 10.4161/auto.21858
- Latour YL, Gobert AP, Wilson KT. The role of polyamines in the regulation of macrophage polarization and function. Amino Acids. 2020 Feb;52(2):151–160. doi: 10.1007/s00726-019-02719-0
- Liu R, Li X, Ma H, et al. Spermidine endows macrophages anti-inflammatory properties by inducing mitochondrial superoxide-dependent AMPK activation, Hif-1alpha upregulation and autophagy. Free Radic Biol Med. 2020 Dec;161:339–350. doi: 10.1016/j.freeradbiomed.2020.10.029
- Shan F, Somasundaram A, Bruno TC, et al. Therapeutic targeting of regulatory T cells in cancer. Trends Cancer. 2022 Nov;8(11):944–961. doi: 10.1016/j.trecan.2022.06.008
- Orecchioni M, Ghosheh Y, Pramod AB, et al. Macrophage polarization: different gene signatures in M1(LPS+) vs. classically and M2(LPS-) vs alternatively activated macrophages. Front Immunol. 2019;10:1084. doi: 10.3389/fimmu.2019.01084
- Pardoll DM. The blockade of immune checkpoints in cancer immunotherapy. Nat Rev Cancer. 2012 Mar 22;12(4):252–264. doi: 10.1038/nrc3239
- Swamydas M, Murphy EV, Ignatz-Hoover JJ, et al. Deciphering mechanisms of immune escape to inform immunotherapeutic strategies in multiple myeloma. J Hematol Oncol. 2022 Feb 16;15(1):17. doi: 10.1186/s13045-022-01234-2