
ABSTRACT
Introduction
Asthma, allergic rhinitis, atopic dermatitis, and food allergy affect approximately 20% of the global population. Few studies describe the burden of the totality of these diseases and only a handful studies provide a comprehensive overview of the socioeconomic impact of these diseases.
Areas covered
For this narrative review, we searched Pubmed using selected keywords and inspected relevant references using a snowballing process. We provide an overview of the socioeconomic burden of allergic diseases (in particular, asthma, allergic rhinitis, atopic dermatitis, and food allergy). The focus of this review is on their epidemiology (incidence, prevalence), burden (disability-adjusted life years, quality of life), and direct and indirect costs (absenteeism and presenteeism). We have put special emphasis on differences between countries.
Expert commentary
Both the prevalence and the burden of allergic diseases are considerable with prevalence varying between 1% and 20%. We identified a plethora of studies on asthma, but studies were generally difficult to compare due to the heterogeneity in measures used. There were only few studies on the burden of food allergy; therefore, more studies on this allergy are required. For future studies, we recommend standardizing epidemiologic, socioeconomic impact, and quality of life measures of allergic diseases.
1. Introduction
Asthma and other atopic diseases such as allergic rhinitis, atopic dermatitis, and food allergy have profoundly increased in frequency in recent decades. Notably, all combined, they now affect approximately 20% of the global population [Citation1]. Although allergic rhinitis and atopic dermatitis are more prevalent, the vast majority of epidemiological studies on allergic diseases have focused on asthma. Indeed, in their overview of systematic reviews in allergic epidemiology, Genuneit et al. showed that 72.9% of allergic studies provided data on asthma; while allergic rhinitis and atopic eczema were only covered in 15.7% and 24.5% of the studies, respectively. [Citation2].
For more than a decade, the relationship between these diseases has been sometimes referred to as ‘the atopic march’ [Citation3–7]. The basis for the atopic march lies in the theory that all allergic diseases may share a common ground [Citation8–10] and that this cohesion should be considered in their management [Citation11]. In particular the early childhood phase, where food allergy and atopic dermatitis are often present, is a crucial period for a person to develop asthma and/or allergic rhinitis [Citation12]. Although several studies relate to the atopic march, this theory is not uniformly accepted, some studies suggest a distinct phenotype rather than a progressive development [Citation13,Citation14].
More recently, it has been acknowledged that type 2 helper T cells (Th2 cells) play a critical role in all atopic diseases [Citation15]. The body reacts to antigens (such as house dust mites, animal dander, plant- or tree pollen, food products) with a complex immune response [Citation16]. That response starts with the activation and differentiation of specific Th2 cells. These cells, later on, control immunoglobulin E (IgE) production against allergens, IgE-dependent mast-cell activation and eosinophil recruitment by producing various cytokines such as IL-4, IL-5, and IL-13. On re-exposure to these allergens, cross-linking of IgE on mast cells releases mediators of hypersensitivity such as histamine and can result in immediate symptoms [Citation17]. Because of their critical role, Th2 cells and their cytokine products are important targets for future therapies in atopic diseases [Citation18,Citation19].
The siloed etiology, epidemiology, and management of asthma [Citation19,Citation20], allergic rhinitis [Citation21,Citation22], atopic dermatitis [Citation12,Citation23–25], and food allergy have been extensively described in earlier reviews. Fewer studies have been performed describing the totality of the burden of these Th2-related diseases [Citation26–31]. Only a handful of studies gave a comprehensive overview of the socioeconomic effects of atopic diseases [Citation32–34]. Moreover, within these economic studies, large diversity in applied methods and outcomes was observed [Citation35]. The discrepancy between, on the one hand, the fragmented ‘per-disease’ approach used in earlier studies and, on the other hand, the enhanced awareness of the interconnectivity [Citation36] and multimorbidity [Citation37] of Th2 related diseases and their (pharmacological) treatment, calls for a holistic overview of the burden and socioeconomic effects of atopic diseases.
In this review, we provide an overview of the socioeconomic burden of allergic diseases. In particular, we focus on asthma, allergic rhinitis, atopic dermatitis, and food allergies’ epidemiology, their direct and indirect costs, and their impact on patients’ quality of life. Although we cite some important studies regarding allergies in children, in this review we mainly focus on the burden of these allergies in adults.
2. Methods
For this narrative, non-systematic, review, we searched Pubmed in August 2019 with (combinations of) the following keywords: asthma, allergic asthma, rhinitis, atopic rhinitis, allergic rhinitis, atopic dermatitis, eczema, atopic eczema, food allergy in combination with the following terms: global, burden, prevalence, costs, direct costs, indirect costs, absenteeism, presenteeism, work absence, and quality of life. We subsequently ‘snowballed’ on identified references to identify further relevant studies. Therefore, we checked the reference lists of the articles identified in the initial Pubmed search.
3. Asthma
3.1. Epidemiology
Over the last four decades, numerous studies have been published describing the prevalence of asthma. It seems clear that the prevalence of asthma is increasing in most parts of the world since the 1950s [Citation38]. In 2006, an article in the New England Journal of Medicine even spoke of ‘the Asthma Epidemic’ [Citation39]. Despite the plethora of studies, it is difficult to compare the results of different epidemiological studies on asthma. There is no standardized definition of asthma and no golden standard on how to objectively diagnose asthma [Citation40], mainly caused by the complexity and heterogeneity of the disease. Assessment of the frequency of asthma is mostly based on questionnaires, simple tests, and the coding of medical care such as hospital attendances and drug prescriptions [Citation41]. Studies from countries outside Europe, North-America, and Australia are limited, and particularly few are from low-income countries [Citation38]. One of the few studies describing the prevalence of asthma in sub-Saharan countries showed an asthma prevalence of 6.8% in Uganda [Citation42]. Most studies describe the prevalence of asthma in children (ISAAC phase 3) [Citation43].
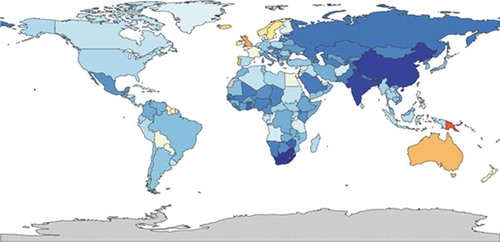
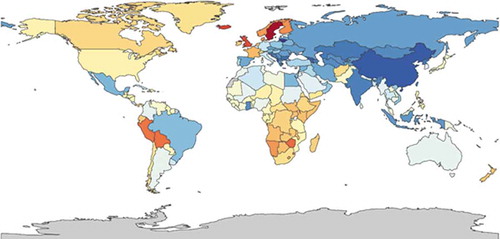
An overview of asthma data of the European countries is presented in the ERJ Whitebook [Citation44]. Here, reported prevalence ranges from 1.4% in Bosnia-Herzegovina to 20.6% in Sweden. For Asian and American countries, a review of Masoli et al. [Citation45] indicated that asthma prevalence ranges from 1.3% in Nepal to 13.0% in Peru. Yet, even in these systematic overviews, there is considerable variation in the underlying data and the definitions used. In order to overcome these issues and produce comparable results across the globe, the Global Burden of Disease (GBD) initiative was launched. In short, the GBD study estimates deaths, incidence, prevalence, and disability-adjusted life years (DALY) rates for 310 diseases and injuries for 195 countries and territories by age group and sex from 1990 up to now. The methods of this study are extensively reported elsewhere [Citation46–48]. In a systematic analysis for the GBD Study 2015 [Citation49], Soriano et al. calculated that globally 358.2 million individuals had asthma. An overview of global GBD asthma prevalence data is provided in (GBD – are composed using the health data visualization tool of the Institute of Health Metrics and Evaluation, IHME: https://vizhub.healthdata.org/gbd-compare).
Figure 1. The global prevalence of asthma, ranging from 1,900 (dark blue) to 12,000 (red) per 100,000 in 2015 (https://vizhub.healthdata.org/gbd-compare/)
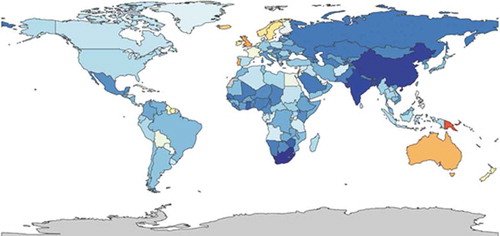
Figure 7. YLDs per 100,000 in patients with atopic dermatitis, both sexes all ages, 2015 [52(red) to 280 (darkblue)] (https://vizhub.healthdata.org/gbd-compare/)
![Figure 7. YLDs per 100,000 in patients with atopic dermatitis, both sexes all ages, 2015 [52(red) to 280 (darkblue)] (https://vizhub.healthdata.org/gbd-compare/)](/cms/asset/88791cad-8d91-45a4-b0d8-c600e617af41/ierp_a_1819793_f0007_oc.jpg)
3.2. Direct health-care costs
It is generally agreed that direct health-care costs are the costs of formal health-care goods and services (hospital, physician, nursing, home care, drugs, etc.) [Citation50]. Numerous studies have been published evaluating the economic burden of asthma on society and individuals. However, it was only in 2009 that the first systematic review on the economic burden of asthma was published [Citation51]. Total asthma costs have significant differences between countries, depending on factors like country gross domestic product (GDP), geographic and demographic status, type of health system, and organization of health services [Citation52]. Nurmagambetov et al. in 2018 studied 10,237 patients with treated asthma in the USA [Citation53]. The annual per-person medical cost of asthma was 3,266 USD of which 1,830 USD was attributable to prescription medication, 640 USD to office visits, 529 USD to hospitalizations, 176 USD to outpatient visits, and 105 USD to emergency room visits. For the year 2013, with a prevalence of 4.9%, they estimated the total medical costs of asthma in the United States at 57.9 USD billion.
In Europe, the direct costs vary per country; Nunes et al. [Citation52] estimated that the annual costs per patient, using the Purchasing Power Parity method, ranged from less than 500 USD in Russia to over 2,000 USD in the UK. In the UK, the total cost of asthma to the public health service was estimated at about £1 billion, 74% of this cost was assigned to the provision of primary care services and medication (60% prescriptions, 14% consultations) [Citation54].
Ehteshami-Afshar et al. [Citation55] estimated the direct costs of asthma in Middle Eastern countries as low as 150 USD per year (Abu Dhabi, United Arab Emirates) and between 247 USD and 592 USD in South-East Asia. In this review, the highest direct costs of asthma were in the USA: over 3000 USD. Furthermore, they showed that medication was the largest component of direct medical costs in the majority of studies, varying from 68% of total direct costs in Canada to 45% in Spain.
3.3. Indirect cost: absenteeism and presentism
Already in 1969, it was acknowledged that work absence was considerable in patients with asthma in the UK [Citation56]. Over the last two decades, numerous studies have analyzed the impact of asthma on work productivity and absence, including the costs for the employer [Citation57], the cost for the patient [Citation58], caretaker [Citation59], healthcare worker [Citation60], and the costs for parents of children with asthma [Citation61]. Although in general there is not much debate about the definition of direct costs [Citation62], there is less than full agreement on which costs can be called indirect [Citation50]. In all definitions of indirect costs, productivity loss plays an important role. Therefore, we focus on this major part of indirect costs. Productivity loss is the opportunity cost due to foregone labor; it can be caused by absenteeism (the withdrawal of labor) or by presenteeism (inefficiency of labor due to impairment) [Citation50].
In 2004, the Global Asthma Insights and Reality Surveys studied the international burden of absences from school in children and work loss in adults caused by asthma in the previous 12 months [Citation63]. Lost work days caused by asthma were as follows: 25% in the United States; 17% in Western Europe; 27% in the Asia-Pacific region and 23% in Central and Eastern Europe. Work loss was uniform in adults, although there were some notable exceptions, possibly because of socio-cultural differences. The percentage of adults with work loss caused by asthma in the Asia-Pacific region ranged from 8% in South Korea to 47% in The Philippines [Citation63]. Moreover, this study showed that in asthma patients with comorbidities, productivity loss was even 1.5 times higher than in patients with only asthma [Citation64]. Dierick et al. [Citation65] compared the work absence data of 9,988 patients with asthma of working age with the general Balearic population of working age. In 2012, 16% of the asthma patients had any work absence compared to 9% in the general population. Ehteshami et al. [Citation55] showed in their review study the lowest indirect costs in the Republic of Korea ($142/py) and the highest indirect costs in U.S. ($1274/py). Yet, the reviewed studies differed significantly making the costs difficult to compare directly.
Lamb et al. [Citation66] focused on productivity loss in allergic rhinitis but compared this with other morbidities, amongst others, asthma. The costs of all 11 employee conditions translated into an average loss per employee of 2,684 USD of which 85 USD were due to asthma (compared to 593 USD for allergic rhinitis). Sadatsafavi et al. [Citation67] recruited 300 individuals with asthma in Canada and 146 (48.7%) of them reported productivity loss due to asthma. In total, 137 (45.7%) reported presenteeism and 49 (16.3%) of the asthma patients reported absenteeism. On average, an employed adult with asthma lost 7.6 hours per week for health-related productivity loss, equal to 20.9% of the time they worked. It was shown that 122 patients (40.7%) with uncontrolled asthma had a weekly productivity loss of CAD$185. Accordini et al. estimated the total costs of asthma in Europe to be €19.3 billion, 62.5% of these costs were due to indirect non-medical costs [Citation68].
3.4. Quality of life and mortality
Asthma can worsen patients’ quality of life (QoL), can limit daily activities, and can disrupt sleep at night. QoL is often measured with questionnaires. The most used questionnaires are the Asthma Quality of Life Questionnaire (AQLQ) and the Saint George’s Respiratory Questionnaire (SGRQ) [Citation69]. These questionnaires represent the personal burden of illness, as perceived by the patient and are, therefore, also considered under the umbrella of ‘patient reported outcomes.’ The effect of asthma on QoL is expected to occur with different characteristics and magnitude to several patient factors, including age [Citation70]. Symptom frequency, especially chest tightness and shortness of breath, is strongly associated with impaired QoL scores [Citation71]. The SGRQ-impact score has a strong correlation with disease severity [Citation72]. The most important clinical parameter affecting the QoL of patients with asthma is disease severity [Citation73].
While the AQLQ and SGRQ are respiratory disease-specific, a more generalizable way of assessing the impact of asthma on individuals is to determine the DALYs and years lived with disability (YLDs). One DALY can be thought of as one lost year of healthy life, thus quantifying the burden of disease from mortality and morbidity together. This also allows a comparison between different diseases.
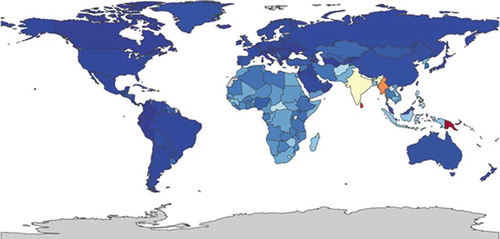
The Global Burden of Disease (GBD) study provides annual updates on estimates of deaths, prevalence, DALYs and YLDs [Citation49]. Age-standardized DALY rates due to asthma were similar between males (365 per 100,000 people) and females (368 per 100,000 people). With 26.2 million DALYs, asthma contributed 1.1% to the total global burden of disease in 2015.
shows the distribution of the burden of asthma, ranging from 110 DALYs per 100,000 (dark blue) to 1,700 DALYs per 100,000 (red). shows the global distribution of the burden of asthma in YLDs, ranging from 73 (dark blue) to 470 (red).
Figure 2. DALYs per 100,000 in patients with asthma, both sexes, all ages, 2015 (https://vizhub.healthdata.org/gbd-compare/)
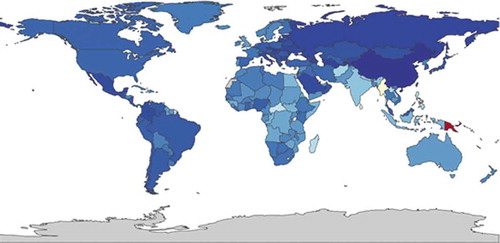
Figure 3. YLDs per 100,000 in patients with asthma, both sexes, all ages, 2015 (https://vizhub.healthdata.org/gbd-compare/)
In their 2017 Lancet study, Ebmeier et al. [Citation74] estimated that between 1993 and 2006 the asthma mortality rate declined significantly, from 0.44 deaths per 100,000 to 0.19 deaths per 100,000. They studied asthma patients between 5 and 34 years old in 36 high-income countries and 10 middle-income countries. They also highlighted that the mortality rate did not further decline between 2006 and 2012. Although asthma prevalence is generally lower in low-income countries, Burney et al. [Citation75] showed that in these countries the mortality rate is higher. Globally, asthma is estimated to be the 42nd cause of years of life lost. In poorer countries, asthma deaths are a more frequent cause of death (Oceania 13th, South-East Asia 25th, North Africa and Middle East 30th, sub-Saharan 33rd). shows the global mortality of asthma estimated by the GBD, ranging from 0 (dark blue) to 38 per 100,000 per year (red).
Figure 4. Deaths per 100,000 patients with asthma, both sexes, all ages 2015 (https://vizhub.healthdata.org/gbd-compare/)
4. Allergic rhinitis
Allergic rhinitis is the most common allergic airway disease with symptoms like rhinorrhea, sneezing, itching, and nasal blockage. In allergic rhinitis, initial exposure to allergens involves antigen-presenting cells, T and B lymphocytes and results in the generation of allergen-specific T cells and IgE antibodies. On re-exposure, it results in the release of mediators of hypersensitivity such as histamine and immediate nasal symptoms. Within hours there is an infiltration into nasal mucosal tissue by inflammatory cells, especially Th2 cells and eosinophils that results in the late-phase allergic response [Citation17]. This IgE-mediated inflammation of the airways can either manifest as allergic rhinitis, asthma, or both. The Allergic Rhinitis and its Impact on Asthma (ARIA) 2008 Practice Parameter defines rhinitis as ‘a condition characterized by one or more of the following nasal symptoms: congestion, rhinorrhea (anterior and posterior), sneezing, and itching [Citation76].’
4.1. Epidemiology
As for asthma, studying the epidemiology of allergic rhinitis is complicated by the different definitions and the different ways the diagnosis is made and recorded. Furthermore, Tan et al. [Citation77] showed that almost 70% of patients who purchased nasal treatment in a community pharmacy self-managed their allergic rhinitis with over-the-counter medication. Of all patients with allergic rhinitis symptoms, only 44.3% had a doctor’s diagnosis.
On the other hand, many national and multinational studies are rapidly improving our knowledge on the prevalence of allergic rhinitis. The International Study of Asthma and Allergies in Childhood (ISAAC) [Citation78] measures the global patterns of prevalence and severity in children. In phase III of this study, the prevalence of rhinitis with itchy-watery eyes over the past year varied across centers from 0.8% to 14.9% in 6–7 year olds and from 1.4% to 39.7% in 13–14 year olds. The highest regional prevalence rates were found in Africa (18.0%) and Latin America (17.3%), the lowest in Northern and Eastern Europe. They also showed that countries with a low prevalence of asthma (<5%) such as Indonesia, Albania, Georgia, and Greece also had a low prevalence of allergic rhinitis. Countries with a very high prevalence of asthma (>30%) like Australia, New Zealand, and UK had a high prevalence of rhinitis (15–20%). Morgan et al. [Citation42] showed that in Uganda the prevalence of allergic rhinitis is 11.9% and that the prevalence is twice as high in urban settings compared to rural areas.
Bauchau et al. [Citation22] studied the prevalence and rate of diagnosis of allergic rhinitis in Europe. A total of 9,646 telephone interviews were conducted. Self-awareness of allergic rhinitis was reported in 19% of the subjects. Of note, 70% of the subjects with self-awareness of allergic rhinitis reported having received a physician-based diagnosis. Overall, the self-reported prevalence of current asthma was 6.4% while 22% of the subjects who reported to have a physician-based diagnosis of allergic rhinitis reported having current asthma.
Bousquet et al. [Citation79] reviewed numerous mono- and multicentric studies in their ARIA 2008 update. In the general population of Europe, using the ARIA definition, the prevalence of allergic rhinitis was 25%, ranging from 17% in Italy to 28.5% in Belgium. They estimated that allergic rhinitis occurs in 500 million people around the world.
4.2. Direct healthcare costs
Although the annual cost to manage a patient with allergic rhinitis is relatively low compared to, for instance, asthma, its high prevalence makes allergic rhinitis a costly disease to treat on a population basis [Citation80]. It was estimated that the direct costs of allergic rhino conjunctivitis (as primary diagnosis) in the USA in 1996 was 1.9 USD billion [Citation81]. In 2003, using data from the 1996 medical expenditure panel, Law et al. [Citation82] calculated that the total direct medical cost of allergic rhinitis was 3.4 USD billion, with 46.6% attributable to prescription medication. They also found a distinct increase in the costs of allergic rhinitis compared with figures reported in the 1990s.
Cardell et al. [Citation83] analyzed 3,501 questionnaires that were sent to 8,001 random Swedish residents aged between 18 and 65 years. Notably, 24% of the subjects reported allergic rhinitis. The direct costs were calculated using the ARIA guidelines and were € 210 per individual per year.
In Spain, Colas et al. [Citation84] performed a multicentre, observational, prospective study in 2009. In this study, allergic rhinitis was diagnosed by an allergologist and classified according to the ARIA guidelines as mild, moderate, or severe. They evaluated 498 patients, 71.1% had moderate allergic rhinitis. The mean direct cost of allergic rhinitis per patient-year was € 554.
In a recent study, Belhassen et al. [Citation85] analyzed the healthcare data of 52,621 patients in France between 18 and 65 years in 2010, and found a prevalence of allergic rhinitis of 6.8% in this age band. In total, 26.2% of these patients were also diagnosed with allergic asthma. The median direct cost of a patient with allergic rhinitis and no asthma was €159, for a patient with allergic rhinitis with asthma the direct costs were between €266 and €375. The relatively low direct costs in this study are explained by the fact that patients were only included on GP’s diagnoses and prescribing data and by the fact that in France most nonsteroidal anti-inflammatory drugs are provided ‘over the counter.’ Therefore, medical resource utilization and associated costs could have been underestimated.
Outside Europe or the USA, limited data on the direct costs of allergic rhinitis were available. Patients in Ankara, Turkey, were studied by Celik et al. [Citation86]. The mean cost of a patient with allergic rhinitis with no comorbidity during the pollen season was 79 USD and the direct costs for patients with allergic rhinitis and asthma and/or conjunctivitis were 139. USD
In Korea, Kim et al. [Citation87] extracted the insurance claims records from the Korea National Health Insurance Corporation. With a total of 4,068,517 people identified as having allergic rhinitis they calculated a prevalence of 8.4%. The total direct cost was 224 USD million.
In India, Ghoshal et al. [Citation88] studied patients with respiratory diseases such as asthma, allergic rhinitis, COPD, and rhinosinusitis. A total of 1000 patients >18 years presenting to a healthcare provider during a routine consultation were enrolled and 80% of them had a diagnosis of asthma and/or allergic rhinitis. The direct costs for patients with allergic rhinitis as primary diagnosis were around 215 USD per year. Medication was the most significant direct cost. Furthermore, in this study there was high use of alternative medicine, possibly either reflecting the lack of evidence-based medicine, limited resources, or access to health care and/or cultural beliefs.
All and all, the direct costs of allergic rhinitis per patient per year are lower than for asthma but still the total costs are significant given its high prevalence.
4.3. Indirect cost: absenteeism and presentism
Some of the aforementioned studies also took the indirect costs of allergic rhinitis into account. Although Kim et al. [Citation87] showed in Korea lower indirect costs ($49 million in productivity loss) than direct costs ($224 million), most other studies showed higher indirect costs. Furthermore, these studies show that presenteeism contributes more to productivity loss than absenteeism. Colas et al. [Citation84] calculated in Spain the indirect costs of AR to be €1772 per person per year (direct costs were €553). Presenteeism accounted for 95% and absenteeism for only 5%.
For example, in India, 37% of the patients with allergic rhinitis had presenteeism and only 7% had absence from work. In this population, allergic rhinitis was responsible for total indirect costs of 460 USD per patient per year [Citation88].
In Sweden, indirect costs caused by presenteeism and absenteeism were €751 per individual/year [Citation83]. Absenteeism represented 8% of the total costs and presenteeism 70%. The average reduction in workability was 17%. The calculated total cost to Swedish society because of allergic rhinitis was €1.3 billion.
In the USA, 8,267 employees of 27 companies completed the Work Productivity Short Inventory (WPSI). This is a self-administered short questionnaire which records demographic information as well as presenteeism and absenteeism in the last year. Data for 11 common employee health conditions (allergic rhinitis, anxiety, arthritis, asthma, coronary artery disease, depression, diabetes, high stress, hypertension, migraine, and respiratory infection) were collected. Of note, allergic rhinitis was the most prevalent of the selected conditions. In particular, 55% of the employees experienced symptoms of allergic rhinitis during the last year, on average 52.5 days per year; they missed 3.57 days of work per year and were unproductive for 2.3 hours per working day while they were symptomatic. The mean total productivity (absenteeism and presenteeism) loss per employee due to allergic rhinitis was 518 USD (compared to 95 USD for diabetes, 85 USD for asthma, and 40 USD for coronary heart disease) [Citation66].
To estimate the total cost of absenteeism and presenteeism associated with allergic rhinitis in the United States, Crystal-Peters et al. [Citation89] combined data from the National Health Interview Survey (NHIS) with information on the use of sedating over-the counter-allergy medications and workers’ self-assessments of productivity loss due to allergic rhinitis. They calculated the productivity losses due to allergic rhinitis in the USA to 5.2 USD billion per year, up to 4.6 billion of these costs were caused by productivity losses due to sedative effects of antihistamines.
4.4. Quality of life
It is now recognized that allergic rhinitis is associated with diverse symptoms, but also with impairments in how patients function in day-to-day life [Citation79]. Having allergic rhinitis can lead to fatigue and mood changes, impairment of cognitive function, depression, and anxiety, thus having a severe impact on QoL. One way of monitoring control of allergic rhinitis (and asthma) is using the Control of Allergic Rhinitis and Asthma Test (CARAT) [Citation90]. The strong point of this test is the combination of asthma and allergic rhinitis. Meltzer et al. [Citation91] studied the health-related quality of life (HRQoL) of patients with allergic rhinitis. Using disease-specific questionnaires, they showed that HRQoL issues in allergic rhinitis patients include fatigue, decrease in energy, general health perception, and social function. Furthermore, they showed a relation between impairment of HRQoL and the severity of the disease. Although allergic rhinitis medication can have adverse side effects, in this study it was postulated that effective therapy of allergic rhinitis with non-sedating antihistamines, intranasal corticosteroids, and other common approved treatments results in improvements in HRQoL.
A 2016 review [Citation92], about American, Latin American, and Asian Pacific studies showed that between 35% and 50% of adult allergic rhinitis patients experience at least a moderate effect of their disease on daily life.
5. Atopic dermatitis
Atopic dermatitis, also called eczema, is a chronic inflammatory skin disorder. In the pathogenesis of this disease, both immune dysregulation and cutaneous barrier dysfunction are involved. Although it has been considered a Th2/Th1-mediated disease, recent studies have suggested the activation of Th22 and Th7 [Citation6]. It is a complex disease with wide variety of clinical presentations and combinations of symptoms [Citation12,Citation93]. First symptoms of atopic dermatitis often appear early in life and could precede other allergic diseases such as asthma and allergic dermatitis. Usually, atopic dermatitis is the first manifestation of the ‘atopic march.’ Its clinical hallmarks, intense itching, and eczematous lesions, were already noted in ancient times [Citation94]. Given atopic dermatitis cannot be cured at present, the aim of its management is to improve symptoms and achieve long-term disease control [Citation95].
5.1. Epidemiology
Numerous epidemiological studies have been performed estimating the prevalence of atopic dermatitis. Some of the most valuable atopic dermatitis prevalence data have come from the ISAAC study. This is the largest and only true global allergy study using a uniformly validated methodology allowing direct comparison between pediatric populations in the world [Citation96]. For the age group 13–14 years, ISAAC showed data from 663,256 participants from 96 countries estimating prevalence values varying from 0.2% in China to 24.6% in Colombia [Citation97]. The highest values were found in Africa and Latin America.
Unfortunately, this kind of comprehensive data is not available for adults. As in asthma and allergic rhinitis, studying the prevalence of atopic dermatitis is complicated by different definitions and different ways the diagnosis is made. Furthermore, there is no uniform way of recording and presenting this disease. Overall, it is known that after adolescence there is a steep decline in the prevalence of atopic dermatitis. Pols et al. [Citation20] showed that the prevalence of atopic dermatitis in UK and the Netherlands ranged from 1.8% to 9.5% in general practice and from 11.4% to 24.2% in the total population. Mei-Yen et al. [Citation98] studied the variation in the prevalence of atopic dermatitis among different countries. They found prevalence rates in adults varying from 2.6% in Korea to over 11% in Sweden, Malaysia, and Singapore.
Yu et al. [Citation99] showed that while 26.5% of children in Korea under 2 years had atopic dermatitis, at the age of 18 years the prevalence was 2.4%.
Studies regarding Africa and the Middle East are much scarcer. Al-Afif et al. [Citation100] present prevalence data from the ISAAC phase 3 study. They not only showed the difference in prevalence between countries, but they also compared the prevalence in urban environments (Tehran, Iran, 17.6%) to that in rural areas (Shahr-e-Kord, Iran, 2.1%).
In a multinational, cross-sectional study designed to represent the general population of US, Canada, France, Germany, Italy, Spain, and the United Kingdom, Barbarot et al. collected data through a web-based survey (n = around 20,000 in U.S. and around 10,000 in the other countries). In the overall population, the 12 month adult prevalence of atopic dermatitis was 4.9% (algorithm based on ISAAC and the United Kingdom Working Party (UKWPD) criteria). The self-report of physician-diagnosed atopic dermatitis ranged from 4.2% in Germany to 17.6% in Spain [Citation101].
Silverberg et al. [Citation102] collected data from the National Health Interview Survey (NHIS) 2010 and 2012. Data were collected from 27,157 adults for the 2010 NHIS and 34,613 for the 2012 NHIS. In 2010, the one-year history of allergic dermatitis was determined by a positive response to the question: ‘During the past 12 months, have you had dermatitis, eczema, or any other red, inflamed skin rash?’ In 2012 the question was: ‘During the past 12 months, have you been told by a physician or other health professional that you had eczema or any kind of skin allergy?’ The 2010 prevalence of atopic dermatitis in adults was 10.2%. The 2012 US prevalence in adults was 7.2%. In their 2019 cross-sectional US population-based study, Silverberg et al. showed that 10.4% reported a diagnosis of atopic dermatitis or eczema, 9.1% met UKWP criteria, 3.6% met UKWP criteria and were diagnosed with atopic dermatitis or eczema [Citation103]. Using the same UKWP criteria, Chiesa Fuxench et al. [Citation104] reported a prevalence in the US of atopic dermatitis in adults of 7.3% shows the global prevalence of atopic dermatitis ranging from 1.2% to 6.4% as per GBD estimates.
Figure 5. Global prevalence of atopic dermatitis both sexes, all ages 2015, ranging from 1,200 (dark blue) to 6,400 (red) per 100,000 (https://vizhub.healthdata.org/gb-compare/)
5.2. Direct healthcare costs
As in asthma and allergic rhinitis, calculating the totality of direct and indirect costs of atopic dermatitis is difficult [Citation105]. It is a disease with a high prevalence and a broad spectrum of severity. Direct costs include prescriptions, physician visits, emergency, and hospital costs.
In their 2015 study, Silverberg et al. [Citation102] showed that 75% of patients with allergic dermatitis had seen a physician for their eczema in the previous 12 months. In the 2010 NHIS survey, patients had significantly higher odds of visiting an emergency center, visiting a physician or hospitalization and receiving home health care than patients without eczema. Patients with atopic dermatitis also had significantly higher health-care costs than patients without eczema (an average additional cost of 371 USD and 489 USD per person-year, respectively).
The most comprehensive investigation of the economics of atopic dermatitis in the US came from a joint report of the American Academy of Dermatology and the Society for Investigative Dermatology published in 2006 [Citation106]. For this cost-of-disease study, data were obtained from several nationally representative public and private databases, including the National Health Interview Survey (NHIS). The joint report estimated that the total direct costs of atopic dermatitis in the US in 2004 were 1,009 USD billion. The prevalence of atopic dermatitis in this study, roughly 5%, is lower than in other studies, and the cost of over-the-counter products was not included. More recently, using different methods, Lim et al. [Citation107,Citation108] showed that the direct US healthcare costs of atopic dermatitis in 2013 were between 252 USD million and 314 USD million.
Recently, Zink et al. [Citation109]. studied the extra out-of-pocket costs due to atopic dermatitis in nine European counties: Czech Republic, Denmark, France, Germany, Italy, the Netherlands, Spain, Sweden, and the UK. A total of 1,189 patients (56% women) with atopic dermatitis participated in the study and were interviewed by telephone. At the time of the interview (October 2017-March 2018), 55% of these patients had mild atopic dermatitis or were clear of atopic dermatitis, 45% had moderate, severe, or very severe atopic dermatitis. On average, patients with atopic dermatitis spent an additional €927 per year on health care with emollients and moisturizers accounting for the highest costs (€332), followed by medication (€213) and doctors and hospitals (€104).
In their 2015 study Kim et al. [Citation110] conducted a prospective cost analysis by reviewing the home accounting records of patients with atopic dermatitis in Korea. To calculate the direct costs, the medical bills for consultations, laboratory examinations, medical procedures, hospital stays, drugs, dispensing fees, and medication storage fees were analyzed. The total direct medical costs in adults were KRW 510,777 (€358, using the exchange rate of September 3, 2019).
5.3. Indirect cost: absenteeism and presentism
Like in asthma and allergic rhinitis, indirect costs in patients with atopic dermatitis are significant. Indirect costs are mainly caused by presenteeism. Indeed, Zink et al. [Citation109] showed that 57% of the studied patients in Europe had at least 1 to 5 days of work absence, 26% had 6 to 10 days work absence and 13% missed 11 days or more due to atopic dermatitis.
In 2019, Andersen et al analyzed surveys of 1,098 patients with moderate-to-severe atopic dermatitis and 134 patients with mild atopic dermatitis in France, Germany, the UK, and the US. Atopic dermatitis severity was determined by the PO-SCORAD (Patient-Oriented-SCORing-Atopic Dermatitis) scale and work productivity loss and work absence was assessed using the Work Productivity and Activity Impairment (WPAI) questionnaire for atopic dermatitis. For overall work impairment due to atopic dermatitis, patients with mild atopic dermatitis reported 2.4 hours per week of potential work productivity loss, patients with moderate atopic dermatitis reported 9.6 hours per week and respondents with severe atopic dermatitis reported 19.0 hours per week potential productivity loss.
Bickers et al. [Citation106]. calculated that the indirect cost of atopic dermatitis in the US because of lost productivity in 2004 was 619 USD million. In this study, the overall direct costs ($1,009 million) were higher than the overall indirect costs.
In the Netherlands, Os-Medendorp et al. [Citation111] included 253 patients with atopic dermatitis. Most patients had moderate (37%) severe (35%) or very severe (10%) atopic dermatitis. In total, 23% of patients took sick leave in the previous two weeks and 64% in the last year. Sick leave due to atopic dermatitis was 12% in the last two weeks and 42% in the last year.
Zuberbier et al. [Citation112]. analyzed the effect of atopic dermatitis on the performance at work and the work absence of adult patients in the European Union. They calculated that the social cost of lost productivity in the EU amounts to more than € 2 billion per year.
In Japan, Arima et al. [Citation113] compared 634 individuals with self-diagnosed atopic dermatitis with 1268 matched controls. The Japanese version of the work productivity and activity impairment questionnaire was used to evaluate the respondents. They showed that employed atopic dermatitis patients reported significantly higher productivity loss than matched controls (28.6% vs 22.4%). There was no significant difference in absenteeism between the two groups.
Kim et al. [Citation111] also calculated the indirect costs in the adult working-age population with atopic dermatitis in Korea. They found a mean of 4.5 days of work absence, and 3 days of early leave from work due to atopic dermatitis. The estimated that the indirect costs were KRW1,507,068 (€1,055, using the exchange rate of September 3, 2019).
5.4. Quality of life
Because of its variety of symptoms and its sometimes very visible skin eruptions, atopic dermatitis can have a severe impact on patients’ QoL. Drucker et al. [Citation114] showed that the impact of atopic dermatitis on the QoL is diverse, varying from impaired social life to impact on the choice of clothing to association with suicidal ideation.
Zuberbier et al. [Citation112]. developed a questionnaire with a section about health-related quality of life by using the 25-item Quality of Life Index for Atopic Dermatitis (QoLIAD). It was indicated that 11% of the adult patients feel discriminated against because of their disease and 14% believe that their career progression has been hindered. They conclude, as a result of the QoLIASD questionnaire: ‘The main effect of atopic dermatitis on the lives of adult patients stems from embarrassment and not wanting to be seen in public, as well as being restricted in the choice of clothes the patient can wear and the unrelenting nature of the condition itself.’
In Saudi Arabia, Abolfotouh et al. [Citation115] assessed QoL interviewing patients with skin disease using an Arabic version of the Skindex-16 questionnaire. Of the eight skin-related diagnoses represented among these patients, atopic dermatitis was associated with the highest mean symptom domain score. This indicates a high physical burden of disease. Weisshaar et al. [Citation116] compared the QoL of 132 German patients with pruritus to that of 84 patients from Uganda. The same questionnaire with 30 questions was handed to the German patients and, after translation, to the Ugandan patients. Results from this study suggest that the burden of atopic dermatitis on QoL may be lower in African patients than in European patients.
Tsai et al. [Citation117] state in their 2019 review data that available data regarding the impact of atopic dermatitis on QoL in Asia are limited. They conclude that atopic dermatitis is associated with a significant burden within Asian countries with a significant impact on QoL. They furthermore postulate that a greater impact on QoL is observed in low-income countries than in high-income countries.
Given direct study comparison is difficult due to the wide variety of diagnostic methods, to estimate the burden of atopic dermatitis on QoL globally we used the comparison tool of the Institute for Health Metrics and Evaluation (IHME).
The leading cause of skin condition DALYs is eczema, when looking across countries, ages, sex, and time. This is because of the high prevalence worldwide and the relatively high average disability weight [Citation118].
In and it is shown that the DALYs and YLDs range from 52 (dark blue) to 280 (red). The YLDs (Years Lived with Disability) have exactly the same range in atopic dermatitis as the DALYs. Therefore, we can conclude that in the GBD study no deaths because of atopic dermatitis are recorded.
Figure 6. DALYs per 100,000 in patients with atopic dermatitis, both sexes all ages, 2015 [52(red) to 280 (darkblue)] (https://vizhub.healthdata.org/gbd-compare/)
![Figure 6. DALYs per 100,000 in patients with atopic dermatitis, both sexes all ages, 2015 [52(red) to 280 (darkblue)] (https://vizhub.healthdata.org/gbd-compare/)](/cms/asset/5e93b20d-3766-4f90-a49e-6754e4d8488e/ierp_a_1819793_f0006_oc.jpg)
6. FOOD ALLERGY
The role of food allergy in the atopic march has less been studied in population-based studies than the role of the other atopic diseases, presumably because it is less common [Citation119]. On the other hand, numerous studies discuss the relation between food allergy and asthma [Citation120], allergic rhinitis [Citation121], and atopic dermatitis [Citation10,Citation122].
As with the other atopic diseases, Th2 cell seems to play an important role. There are three different types of food allergies: IgE mediated, , and a mixed form. The relation between the different atopic diseases lies in the Th2 cells and the effects of IgE [Citation123].
6.1. Epidemiology
As with asthma, allergic rhinitis and atopic dermatitis, studying the prevalence of food allergy is difficult because there is no one way of diagnosing and recording it. There are many ways of testing patients on food allergies, but the most commonly used tests are not very accurate. For example, the frequently used IgE testing tests overestimate the food allergy status of sensitized children with up to 50%. In adults and children, double-blind and placebo-controlled food challenges remain the gold standard for diagnosing food allergy. Unfortunately, these food challenges are time-consuming and costly [Citation119]. Turnbull et al. [Citation124] showed that 20% of the population believe that they have adverse reactions to food, but estimates of true IgE-mediated food allergy may only be prevalent in 4–7% of the population. Furthermore, it has been shown that food allergies, especially if caused by peanuts or tree nuts, are rare but more common in children, can be life-threatening and should be distinct from food intolerances. In a systematic review on the prevalence of plant food allergies (1990–2006) Zuidmeer et al. [Citation125] concluded: ‘population-based studies of good quality to determine the true prevalence of food allergy are not currently available for most countries of the world.’
In infants, cow’s milk and egg allergy are the most commonly reported, although up to 50% of the young children gained tolerance within 1 year after diagnosis [Citation126,Citation127]. In older children and adults, seafood is most reported in Asia and peanut and other nuts allergy are commonly reported in Australia, Western Europe and the United States [Citation128]. In 2005, the EU-funded multidisciplinary-integrated project EuroPrevall was launched [Citation129]. Surveys in this study were nested with case–control studies, studying children 7–10 years old and adults 20–54 years old. The study focused on IgE mediated allergies to a number of foods. The studies were undertaken in eight centers representing different social and climatic regions in Europe. This study was performed in three stages: 1: screening survey (short questionnaire), 2: case-control study (longer questionnaire and blood sample), 3: full clinical evaluation (including double-blind placebo-controlled food challenge). Lyons et al. [Citation130] reported from this project that in stage 1 (n = 30,420) the self-reported prevalence of a food allergy varied from 1.7% in Vilnius to 37.7% in Zurich. In stage 2, the prevalence of probable food allergy varied from 0.3% in Athens to 5.6% in Zurich. In stage 3, too few challenges were performed to estimate the prevalence of confirmed food allergy.
Using the same EuroPrevall methodology, Mahesh et al. [Citation131] performed a screening study with 11,791 randomly selected participants in South India. In total, 26.5% had a self-reported food sensitization. In stage two, 1.2% had a probable food allergy to 1 of the 24 common foods.
Nwaru et al. stated in 2014 that evidence indicated that the lifetime prevalence of self-reported food allergy in Europe is around 17%. The prevalence seems to be the lowest in Southern Europe. In this systematic review, the incidence of food allergy seemed to be stable in time. The prevalence may be increasing yet they state that ‘caution is required due to the heterogeneity among the studies suggesting important methodological and diagnostic differences within and across geographical regions of Europe [Citation132].’
Loh et al. [Citation133] show the difficulties in comparing prevalence in different countries when there is no one standard way of reporting. They also showed the inaccuracy of self-reported food allergy as a measure of true prevalence. This said, in this study some prevalence rates in low-income countries are presented: East Asian countries 3.4–7.0%, Ghana 11%, Africa 5–19%. Furthermore, they showed an increase in prevalence in the last two decades of food allergy in almost all countries.
Wang et al. [Citation134] conducted a cross-sectional epidemiological survey (n = 4441) in Inner Mongolia, Northern China. They show a higher prevalence of self-reported food allergy in children (38.7%) than in adults (11.9%). There was a significant difference in the prevalence of food allergy between rural (14.6%) and urban areas (21.4%).
Sicherer et al. [Citation135] also mention the fact that the vast majority of recent studies only present the prevalence in (young) children. They show that there is a strong impression that the prevalence of food allergy is increasing. For example, in the U.S. an increased from 3.4% in children in 1997 to 5.1% in 2009, in a Chinese study from 3.5% in 1999 to 7.4% in 2009.
In the U.S, according to Verrill et al. [Citation136], the self-reported prevalence of food allergy increased from 9.1% in 2001 to 14.9% in 2006 and 13% in 2010 (n > 4000). On the other hand, in the same cohort the physician-diagnosed food allergy did not significantly increase; 5.3% in 2001, 7.6% in 2006 and 6.5% in 2010.
Differences in prevalence of food allergy across countries seem plausible, yet the prevalence studies are often difficult to compare. In their meta-analysis, Rona et al. concluded: ‘There is a marked heterogeneity in the prevalence of food allergy that could be a result of differences in study design or methodology, or differences between population [Citation137].’
6.2. Direct healthcare costs
Estimating the direct healthcare costs of food allergy is even more complicated than in asthma, allergic rhinitis, and atopic dermatitis due to the variety in types of foods and severity of this disease. A child with a systemic food allergy to peanut, with anaphylactic reactions and hospitalization, has a totally different scope of costs than an adult with Pollen Fruit Syndrome who gets an itch when he eats an apple. Of course, there is an overlap with costs made for especially atopic dermatitis but also for asthma and allergic rhinitis.
Most studies conducted present costs of food allergy in children. Only very few studies present the costs in adults.
Jansson et al. [Citation138] included 81 adults with a positive food challenge or with IgE levels associated with a 95% probability for food allergy and a convincing history of allergy to cow’s milk, hen’s egg, or wheat. Patients with a history of anaphylaxis had significantly higher costs compared with cases without a history of anaphylaxis. The number of offending foods did not significantly impact total costs. Annual direct costs did not differ significantly between cases and controls. Food allergy severity, but not the number of food allergies significantly impacted direct costs.
Fox et al. [Citation139] studied the costs of food allergy in nine European countries, using the EuroPrevall methodology. They showed that adults with a food allergy had higher health costs in (I$2016) than their controls (I$1089). A similar result was found for adults in each country and for children. Furthermore, they showed that cost was significantly related with severity of the disease.
In the U.S., Patel et al. [Citation140] identified patients with food-induced allergic reactions from a list of federally administered 2006 and 2007 databases. Direct costs were estimated by calculating the average cost of treatment of the illness and multiplying it by the prevalence. In this way they estimated the direct medical costs in 2007 to be 225 USD million, 52.5% of these costs were caused by office visits, 20% by emergency visits, 11.8% by in-patient hospitalization, 3.9% by out-patient visits, 3% by ambulance runs, and 8.7% by epinephrine devices.
6.3. Indirect cost: absenteeism and presentism
In food allergy, only very few studies have been conducted studying work absence and loss of productivity. Most studies that are conducted present the impact of food allergy on the productivity of parents of affected children.
Patel et al. [Citation140] quantified indirect costs of food allergy in the U.S. by estimating lost productivity caused by absenteeism and mortality of patients or caregivers. In this study, absenteeism for in-patients was defined as their length of stay. For an outpatient visit, an absence of 1 day was estimated. In case of food allergy in children, an absence of 1 day was assumed for one parent acting as caregiver. The lost days of work were multiplied with the mean wage of a lost day. In this way, indirect costs of food allergy in the U.S. in 2007 were estimated at 115 USD million.
Jansson et al. [Citation138]. showed that patients with a true food allergy had much higher indirect costs. Also, indirect costs were significantly higher for households with a food-allergic adult vs households without a food-allergic adult. Specifically, more time was spent on performing domestic tasks due to a family members’ food allergy.
Bilaver et al. [Citation141] conducted a systematic review of 11 studies (studies of Pavel and Jansson were included). They showed that patients had high food allergy-related direct costs ($2,081), but even higher indirect costs on house-hold level ($4,881). In their discussion, they stated that this is the first systematic study that reviews the literature on the economic burden of food allergy; ‘further research using standardized instruments and methods is necessary to fully comprehend the economic effect of food allergy.’
6.4. Quality of life
In the last decade, disease-specific health-related QoL questionnaires have been developed in the field of food allergy [Citation142–145]. These questionnaires are able to measure the ongoing psychosocial burden of food allergy, which differs from measuring QoL in chronic diseases with ongoing symptoms. Food allergic patients experience only symptoms when they ingest the food to which they are allergic to, otherwise they have no symptoms. However, food-allergic patients need to be constantly vigilant to the foods they ingest in all kinds of (social) situations. The impact of food allergies on QoL may differ between patients. Not only the severity of the food allergy, and therefore the impact on quality of life, can be very different, also the different types of foods that need to be avoided have a different impact on quality of life. Most studies have been conducted in children or their parents and some in adults.
Recently, Greenhawt [Citation146] reviewed multiple studies from the US, Europe, and Australia and showed the diverse relationships between food allergy QoL and allergic comorbidity, severity, treatment, and health status. In addition, food allergy QoL has become an important outcome to demonstrate the effect of the recent clinical trials on potential therapies for food allergy. However, Greenhawt states that beyond these potential therapies, the field lacks specific tools to repair QoL in patients with food allergy.
In their review study Dunn Galvin et al. [Citation147] analyzed the impact of food allergy on children’s, teenagers’ and parents’ QoL. They did not study the impact on adults. Overall the findings suggest that food allergy has a strong impact on the quality of life, especially on a social, dietary, and psychological level.
Although the gold standard for diagnosing food allergy, the double-blind and placebo-controlled food challenge is viewed as time-consuming and costly [Citation119], Kansen et al. [Citation148] showed in their review that it significantly improves QoL. This improvement in QoL was seen in children, teenagers, parents, and adults. Interestingly, QoL also improved after a positive food challenge (food allergy confirmed). However, as can be expected, the biggest improvement in QoL was seen after a negative food challenge (food allergy refuted).
7. Discussion
In this review, we provided a narrative overview of the prevalence as well as the socio-economic impact of allergic diseases. Globally, asthma prevalence in adults ranges from 1 to 20%, allergic rhinitis ranges from 1 to 18%, atopic dermatitis ranges from 2 to 10% and food allergy ranges from 1% to 2% (prevalence of self-reported food allergy in adults varies from 2% to 37%). While these prevalence estimates varied widely and were mainly focusing on adults, it should be acknowledged that the prevalence of allergic diseases in children is generally even higher. Asthma, allergic rhinitis, atopic dermatitis, and food allergy have a serious impact on quality of life, direct and indirect costs. Regarding indirect costs, particularly work productivity is negatively affected, mostly due to presenteeism.
7.1. Interpretation
In this review, we showed that asthma, allergic rhinitis, atopic dermatitis, and food allergy are globally highly prevalent. Furthermore, these diseases not only have a severe impact on quality of life, but also on work productivity. Indeed, because of their high prevalence, their frequent co-occurence and their economic burden, the combined overall socioeconomic burden of these allergic diseases is considerable. Although some studies indicated a significant impact of allergies on work productivity, we could not find studies showing the effect of proper allergy care on the patients’ productivity. Some studies show a relation between the severity of the symptoms and the impact on productivity, but only a limited number of studies assessed the effects of inadequate management [Citation28,Citation149]. Direct costs and indirect costs seem significant, yet the relation between these two is understudied. It would be interesting to study work productivity and quality of life in groups of patients with allergy, then optimize the management of their diseases and subsequently evaluate the effect of improved management on work productivity. We think this would strengthen the case that health-care expenses should not only been seen as a cost, health care should rather be seen as an investment. We hypothesize that every dollar that is spend on optimizing allergy, health care save multiple dollars in prevented productivity loss.
7.2. Limitations
For this narrative review, we did not follow a systematic search methodology. We only used one medical database (Pubmed) and used a snowballing strategy to identify additional relevant studies by checking reference lists of identified articles. Because of this non-systematic methodology, we have to consider the possibility of missing studies. Also, there was large heterogeneity in study design, methods, measures, and outcomes making studies difficult to directly compare. For example, for asthma, allergic rhinitis, atopic dermatitis and food allergy there is no one formal definition of these diseases. There are many ways they are diagnosed and even more ways of recording. The studies we cited are, therefore, only partly comparable. Comparability globally is difficult, because most studies are from Europe and the United States. There are quite a few studies from Asia, but studies from the rest of the world are scarce. Yet, we feel that the robustness of our conclusions is strengthened by the fact that there were no large differences in the overall conclusions of the individual studies.
7.3. Recommendations
The ISAAC studies show how relevant it is to have a uniform way of diagnosing and recording diseases. Yet, the ISAAC studies only included children up to 14 years of age. It would be of great importance to study the prevalence rates of allergies in adults in the same way.
Drucker et al. [Citation150] postulated in 2016 that there are still quite a few research hiatuses in quality of life and economic burden of atopic dermatitis. They propose a systematic way of identifying and reporting these research gaps. Indeed, we recommend future studies to systematically identify and address research gaps in the socioeconomic impact and quality of life in asthma, allergic rhinitis, atopic dermatitis, and food allergy. Furthermore, given the limited data on food allergy, more studies on this allergy are required. Also, more studies, especially performed in Africa and South America are recommended. Recently, an increasing number of studies on allergic multimorbidity have been performed [Citation151–154]. Future original studies as well as more focused systematic reviews on the effect of this multimorbidity on the burden of these diseases, especially on presenteeism and absenteeism are recommended. Lastly, we recommend studying the effect of introducing new therapies and optimizing existing therapies on especially the work productivity of patients with allergies.
8. Conclusion
Allergies, including asthma, allergic rhinitis, atopic dermatitis, have a high global prevalence and severely impact on the quality of life of patients. For food allergy, this is particularly the case in children. Furthermore, although the global variety is considerable, these diseases are responsible for high direct and indirect costs.
9. Expert opinion
In this review, we made clear that atopic diseases are globally prevalent, co-occur frequently, are costly to healthcare systems, and have large additional societal costs due to lost work productivity. However, comparing the available evidence highlighted that research methods are not uniform, in particular concerning methodologies for allergy diagnosis and outcome measurement. Notably, allergy-related outcomes such as quality of life, direct costs, and indirect costs (especially presenteeism) should be presented in a more standardized format. Using these outcomes together allows studying the burden of allergic diseases. Yet, in the absence of consensus on outcomes, studies can hardly be compared, and therefore the value of additional burden of disease studies is limited.
One may wonder why these burdens of disease studies are so important. The main rationale for performing burden of disease studies is not only to show the negative effect for a patient of having a particular disease. These kinds of studies are important because they can show the impact of diagnosing and treatment of particular diseases on health-care systems in a country or even on society as a whole. Subsequently, targeted and cost-effective interventions can be selected and promoted that reduce this impact. For allergic diseases, this means, for example, investing in interventions that focus on allergen exposure reduction, targeted case-finding or optimizing medication prescription and patient adherence.
Furthermore, burden of disease studies can give an insight on which diseases require relative prioritization from a policy perspective. Given governmental healthcare budgets are fixed and money can only be spent once, the allergy community needs to generate compelling evidence on societies’ investment case for allergy interventions, focusing on those with the highest return on investment. Indeed, in most countries health care seen as a cost. Burden of disease studies is used to showcase the cost of diagnosis and treatment. Rather than considering these as costs, diagnoses- and treatment-related expenditures can be conceived as ‘investment.’ If we know the burden of disease, we can estimate the effect of treating a disease and therefore we can estimate the ‘return on investment’ of the money spent on diagnosing and treating a disease. As such, the allergist community should promote the use of cost-effectiveness and budget impact analyses alongside clinical effect studies of promising interventions.
Also from this point of view it is of the upmost importance that we have agreement on which outcomes we find important, and how they are studied. In particular, consent is needed on how these properties are measured, which indices and which questionnaires are used. There should be agreement that for multiple subsequent years the same methods are used, preferably on an international scale. Fortunately, some multi-country initiatives (ISAAC, EuroPrevaLL) used uniform methodologies so that current and future results can be better compared. Another notable example has been set for asthma, for which a US National Institutes of Health (NIH) workshop has been resulted in set of core (required in future studies), supplemental (used according to study aims and standardized) and emerging (requiring validation and standardization) outcomes for asthma studies [Citation155]. Yet, while these recommendations are in place for some time, adherence to these recommended outcomes remains challenging [Citation156]. Moreover, for allergic rhinitis, atopic dermatitis, and food allergy we are not aware of such recommendations being in place at all.
Beyond allergic diseases, a more general issue exists and that is that significant differences in the cost (distribution) of health care countries exist depending on care organization and where the care is provided (e.g. primary versus secondary care). Additionally, there are differences in the way these costs are reimbursed, i.e. how much are out-of-pocket expenses and how much is covered by insurance. This further affects comparability of health economic studies. Numerous ways are applied to make it easier to compare countries in economic studies, inclusive the use of international dollars and purchasing power parities (PPPs) for monetary outcomes. Yet, issues remain. For example, PPPs may not reflect relative purchasing powers in the healthcare sector.
How to move forward? Some years ago, Pam Woodall, a reporter for the Economist, introduced the Big Mac index as a way to compare the real value of money in different countries. This index indicates what a Big Mac costs in a country, and this is compared to the official exchange rate. As such, one can estimate the impact of this exchange rate. In allergy and other medical costs studies, we should maybe think of our own Big Mac Index by using some kind of anchor (e.g. the cost of a certain medicine, diagnostic test or care episode divided by the costs of monthly rent or daily food expenses). This would result in a more uniform way of presenting the real costs to a local patient population in the context of its setting. This index should represent the economic burden of allergy holding the unique aspect of each healthcare and economic system in each country into account, inclusive the concept of these costs being merely an investment.
Article highlights
Asthma, allergic rhinitis, atopic dermatitis, and food allergy affect approximately 20% of the global population.
These diseases have a serious impact on quality of life, direct- and indirect costs.
Regarding indirect costs, work productivity is mostly affected in the form of presenteeism.
We recommend future studies to systematically address research gaps regarding the socioeconomic impact and quality of life in allergic diseases.
In medical costs studies there should be a uniform way of presenting the real costs to a local patient population in the context of its setting
Declaration of interest
The authors have no relevant affiliations or financial involvement with any organization or entity with a financial interest in or financial conflict with the subject matter or materials discussed in the manuscript. This includes employment, consultancies, honoraria, stock ownership or options, expert testimony, grants or patents received or pending, or royalties.
Reviewers disclosure
Peer reviewers on this manuscript have no relevant financial relationships or otherwise to disclose.
Additional information
Funding
References
- Bantz SK, Zhu Z, Zheng T. The atopic march: progression from atopic dermatitis to allergic rhinitis and asthma. J Clin Cell Immunol. 2014 Apr;5(2):202.
- Genuneit JJ, Seibold AM, Apfelbacher CJ. Overview of systematic reviews in allergy epidemiology. Allergy. 2017 Jun;72(6):849–856.
- Spergel Jonathan MJM. Atopic dermatitis and the atopic march. J Allergy Clin Immunol. 2003 Dec;112(6):118–127.
- Spergel Jonathan MJM. Atopic march: link to upper airways. Curr Opin Allergy Clin Immunol. 2005 Feb;5(1):17–21.
- Ker Jennifer J, Hartert TV. The atopic march: what’s the evidence? Ann Allergy, Asthma Immunol. 2009;103(4):282–289.
- Oliveira Clara C. More than skin deep: the systemic nature of atopic dermatitis. Eur J Dermatol. 2019 May 23; 29(3):250–258.
- Paller Amy SAS. The atopic march and atopic multimorbidity: many trajectories, many pathways. J Allergy Clin Immunol. 2019 Jan;143(1):46–55.
- Tran Maxwell MMM. Predicting the atopic march: results from the canadian healthy infant longitudinal development study. J Allergy Clin Immunol. 2018;141(2):601–607.
- Davidson WF. Report from the national institute of allergy and infectious diseases workshop on “atopic dermatitis and the atopic march: mechanisms and interventions”. J Allergy Clin Immunol. 2019 Mar;143(3):894–913.
- Celakovska J, Ettler K, Ettlerova K, et al. Food hypersensitivity in patients over 14 years of age suffering from atopic dermatitis. Indian J Dermatol. 2014;59(3):316.
- Lenaeus JMJ, Hirschmann J. Primary care of the patient with asthma. Med Clin North Am. 2015 Nov;99(5):953–967.
- Nutten Sophie S. Atopic dermatitis: global epidemiology and risk factors. Ann Nutr Metab. 2015;66:8–16.
- Illi S, von Mutius E, Lau S, et al. The natural course of atopic dermatitis from birth to age 7 years and the association with asthma. J Allergy Clin Immunol. 2004;113(5):925–931.
- Belgrave DC, Granell R, Simpson A, et al. Developmental profiles of eczema, wheeze, and rhinitis: two population-based birth cohort studies. PLoS Med. 2014;11(10):e1001748.
- Kuruvilla ME, Lee FE, Lee GB. Understanding asthma phenotypes, endotypes, and mechanisms of disease. Clin Rev Allergy Immunol. 2019;56(2):219–233.
- Leomicronn B. T cells in allergic asthma: key players beyond the Th2 pathway. Curr Allergy Asthma Rep. 2017;17(7): 43.
- Eifan AO, Durham SR. Pathogenesis of rhinitis. Clin Exp Allergy. 2016;46(9):1139–1151.
- Bosnjak B, Stelzmueller B, Erb KJ, et al. Treatment of allergic asthma: modulation of Th2 cells and their responses. Respir Res. 2011;12:114.
- Wu TD, Brigham EP, McCormack MC. Asthma in the primary care setting. Med Clin North Am. 2019 May;103(3):435–452.
- Pols DH, Wartna JB, Moed H. Atopic dermatitis, asthma and allergic rhinitis in general practice and the open population: A systematic review. Scand J Prim Health Care. 2016 Jun;34(2):143–150.
- Massoth Landon L. Asthma and chronic rhinosinusitis: diagnosis and medical management. Med Sci. 2019 Mar 27;7(4):53.
- Bauchau V. Prevalence and rate of diagnosis of allergic rhinitis in europe. Eur Respir J. 2004 Nov;24(5):758–764.
- Smith S. Atopic dermatitis in adults: an australian management consensus. Australas J Dermatol. 2020;61(1):23–32.
- Feldman SR. The challenge of managing atopic dermatitis in the united states. Am Health Drug Benefits 2019 Apr;12(2):83–93.
- Lee JH, Son SW, Cho SH. A comprehensive review of the treatment of atopic eczema. Allergy Asthma Immunol Res. 2016 May;8(3):181–190.
- Theodosiou Grigorios G. Burden of atopic dermatitis in swedish adults: A population-based study. Acta Derm Venereol. 2019 Oct; 99(11):964–970.
- Ding BB, Small M. Disease burden of mild asthma: findings from a cross-sectional real-world survey. Adv Ther. 2017;34(5):1109–1127.
- Zuberbier T, Lötvall J, Simoens S, et al. Economic burden of inadequate management of allergic diseases in the european union: A GA2LEN review. Allergy. 2014;69(10):1275–1279.
- Loftus PA, Wise SK. Epidemiology and economic burden of asthma. Int Forum Allergy Rhinology. 2015;5:S7–S10.
- Wang Y, Ghoshal AG, Bin Abdul Muttalif AR. Quality of life and economic burden of respiratory disease in asia-pacific-asia-pacific burden of respiratory diseases study. Value Health Reg Issues. 2016 May;9:72–77.
- Sullivan PW, Ghushchyan VH, Slejko JF. The burden of adult asthma in the united states: evidence from the medical expenditure panel survey. J Allergy Clin Immunol. 2011 Feb;127(2):363–369.
- Uphoff Eleonora E, Cabieses B, Pinart M. A systematic review of socioeconomic position in relation to asthma and allergic diseases. Eur Respir J. 2015 Oct;46(2):364–374.
- Linneberg A. Burden of allergic respiratory disease: A systematic review. Clin Mol Allergy. 2016; 14:12.
- Nørreslet LB, Ebbehøj NE, Ellekilde Bonde JP. The impact of atopic dermatitis on work life - a systematic review. J Eur Acad Dermatol Venereol. 2018 Jan;32(1):23–38.
- Gutknecht Mandy M, Reinert R, Augustin M. Review of health economic analyses in atopic dermatitis: how diverse is the literature? Expert Rev Pharmacoecon Outcomes Res. 2019;19(2):127–145.
- Ballardini N, Kull I, Lind T, et al. Development and comorbidity of eczema, asthma and rhinitis to age 12: data from the BAMSE birth cohort. Allergy. 2012;67(4):537–544.
- Gough H, Grabenhenrich L, Reich A, et al. Allergic multimorbidity of asthma, rhinitis and eczema over 20 years in the german birth cohort MAS. Pediatr Allergy Immunol. 2015;26(5):431–437.
- Lundbäck BB, Backman H, Lötvall J. Is asthma prevalence still increasing? Expert Rev Respir Med. 2016;10(1):39–51.
- Eder W, Ege MJ, von Mutius E. The asthma epidemic. N Engl J Med. 2006 Nov 23;355(21):2226–2235.
- Sears MR. Trends in the prevalence of asthma. Chest. 2014 Feb;145(2):219–225.
- European Lung White book. Sheffield, United Kingdom: ERS Publications Office; 2013.
- Morgan BW. Asthma and allergic disorders in uganda: A population-based study across urban and rural settings. J allergy clin immunol. 2018 Sep–Oct;6(5):1580–1587.
- Pearce Neil N, Ait-Khaled N, Beasley R. Worldwide trends in the prevalence of asthma symptoms: phase III of the international study of asthma and allergies in childhood (ISAAC). Thorax. 2007 Nov;62(9):758–766.
- [cited 2020 Sep 8]. https://www.erswhitebook.org/chapters/adult-asthma/.
- Masoli M, Fabian D, Holt S. The global burden of asthma: executive summary of the GINA dissemination committee report. Allergy. 2004 May;59(5):469–478.
- GBD 2013 Mortality and Causes of Death Collaborators. Global, regional, and national age-sex specific all-cause and cause-specific mortality for 240 causes of death, 1990–2013: A systematic analysis for the global burden of disease study 2013. Lancet. 2015 Jan 10;385(9963):117–171.
- GBD 2016 Causes of Death Collaborators. Global, regional, and national age-sex specific mortality for 264 causes of death, 1980–2016: A systematic analysis for the global burden of disease study 2016. Lancet. 2017 Nov 16;390(10100):1151–1210.
- GBD 2015 Mortality and Causes of Death Collaborators. Global, regional, and national life expectancy, all-cause mortality, and cause-specific mortality for 249 causes of death, 1980–2015: A systematic analysis for the global burden of disease study 2015. Lancet. 2016 Oct 08;388(10053):1459–1544.
- Global, regional, and national deaths, prevalence, disability-adjusted life years, and years lived with disability for chronic obstructive pulmonary disease and asthma. 1990–2015: A systematic analysis for the global burden of disease study 2015. Lancet Respir Med. 2017;5(9):691–706.
- Ernst R. Indirect costs and cost-effectiveness analysis. Value Health. 2006 Jul-Aug;9(4):253–261.
- Bahadori K. Economic burden of asthma: A systematic review. BMC Pulm Med. 2009 May 19;9:24.
- Nunes C. Asthma costs and social impact. Asthma Res Pract. 2017;3:1.
- Nurmagambetov T, Kuwahara R, Garbe P. The economic burden of asthma in the united states, 2008–2013. Ann Am Thorac Soc. 2018;15(3):348–356.
- Mukherjee M, Stoddart A, Gupta RP. The epidemiology, healthcare and societal burden and costs of asthma in the UK and its member nations: analyses of standalone and linked national databases. BMC Med. 2016 29;14(1). DOI:10.1186/s12916-016-0657-8
- Ehteshami-Afshar SS, FitzGerald JM, Doyle-Waters MM. The global economic burden of asthma and chronic obstructive pulmonary disease. The International Journal of Tuberculosis and Lung Disease. 2016 Jan;20(1):11–23.
- Springett VH. Hospital admission and absence from work attributed to asthma. Br Med J. 1969;1(5641):402–403.
- Birnbaum HG, Berger WE, Greenberg PE, et al. Direct and indirect costs of asthma to an employer. J Allergy Clin Immunol. 2002;109(2):264–270.
- Cisternas MG, Blanc PD, Yen IH, et al. A comprehensive study of the direct and indirect costs of adult asthma. J Allergy Clin Immunol. 2003;111(6):1212–1218.
- Szucs TD, Anderhub H, Rutishauser M. The economic burden of asthma: direct and indirect costs in switzerland. Eur Respir J. 1999;13(2):281–286.
- Kim JL, Toren K, Lohman S, et al. Respiratory symptoms and respiratory-related absence from work among health care workers in sweden. J Asthma. 2013;50(2):174–179.
- Kleinman NL, Brook RA, Ramachandran S. An employer perspective on annual employee and dependent costs for pediatric asthma. Ann Allergy Asthma Immunol. 2009;103(2):114–120.
- van Boven JFM, van de Hei SJ, Sadatsafavi M. Making sense of cost-effectiveness analyses in respiratory medicine: A practical guide for non-health economists. Eur Respir J. 2019;53(3):1801816.
- Rabe KF, Adachi M, Lai CK, et al. Worldwide severity and control of asthma in children and adults: the global asthma insights and reality surveys. J Allergy Clin Immunol. 2004;114(1):40–47.
- Ehteshami-Afshar Solmaz S. The impact of comorbidities on productivity loss in asthma patients. Respir Res. 2016;17:1.
- Dierick BJH, Flokstra-de Blok B, van der Molen T, et al. The impact of asthma and/or COPD on work absence. Eur Respir J. 2018;52(suppl 62):PA4216.
- Lamb CE. Economic impact of workplace productivity losses due to allergic rhinitis compared with select medical conditions in the united states from an employer perspective. Curr Med Res Opin. 2006 Jun;22(6):1203–1210.
- Sadatsafavi M, Rousseau R, Chen W, et al. The preventable burden of productivity loss due to suboptimal asthma control: A population-based study. Chest. 2014;145(4):787–793.
- Accordini Simone S. The cost of persistent asthma in europe: an international population-based study in adults. Int Arch Allergy Immunol. 2013;160(1):93–101.
- Arpinelli F. Health-related quality of life measurement in asthma and chronic obstructive pulmonary disease: review of the 2009-2014 literature. Multidiscip Respir Med. 2016;11:5.
- Hossny Elham E. Severe asthma and quality of life. World Allergy Organ J. 2017;10:1.
- Hooi LN. What are the clinical factors that affect quality of life in adult asthmatics? Med J Malaysia. 2003 Oct;58(4):506–515.
- Bae YJ. Reliability and validity of the st george’s respiratory questionnaire for asthma. Int J Tuberc Lung Dis. 2011 Sep;15(7):966–971.
- Uchmanowicz Bartosz B. Clinical factors affecting quality of life of patients with asthma. Patient Prefer Adherence. 2016;10:579–589.
- Ebmeier S, Thayabaran D, Braithwaite I, et al. Trends in international asthma mortality: analysis of data from the WHO mortality database from 46 countries (1993-2012). Lancet. 2017;390(10098):935–945.
- Burney PP. The global burden of chronic respiratory disease in adults. Int J Tuberc Lung Dis. 2015 Jan;19(1):10–20.
- Wallace DV. The diagnosis and management of rhinitis: an updated practice parameter. J Allergy Clin Immunol. 2008 Oct;122(2):1–84.
- Tan Rachel R. Identifying the hidden burden of allergic rhinitis (AR) in community pharmacy: A global phenomenon. Asthma Res Pract. 2017;3:8.
- Aït-Khaled NN. Global map of the prevalence of symptoms of rhinoconjunctivitis in children: the international study of asthma and allergies in childhood (ISAAC) phase three. Allergy. 2009 Jan;64(1):123–148.
- Bousquet J. Allergic rhinitis and its impact on asthma (ARIA) 2008 update (in collaboration with the world health organization, GA(2)LEN and AllerGen). Allergy. 2008 Apr;63:8–160.
- Reed Shelby DSD. The economic burden of allergic rhinitis: A critical evaluation of the literature. Pharmacoeconomics. 2004;22(6):345–361.
- Ray NF. Direct expenditures for the treatment of allergic rhinoconjunctivitis in 1996, including the contributions of related airway illnesses. J Allergy Clin Immunol. 1999 Mar;103(3):401–407.
- Law AW. Direct costs of allergic rhinitis in the united states: estimates from the 1996 medical expenditure panel survey. J Allergy Clin Immunol. 2003 Feb;111(2):296–300.
- Cardell LO. TOTALL: high cost of allergic rhinitis-a national swedish population-based questionnaire study. NPJ Prim Care Respir Med. 2016 Feb-Apr;26:15082.
- Colás C. Estimate of the total costs of allergic rhinitis in specialized care based on real-world data: the FERIN study. Allergy. 2017 Jun;72(6):959–966.
- Belhassen M. Costs of perennial allergic rhinitis and allergic asthma increase with severity and poor disease control. Allergy. 2017 Jun;72(6):948–958.
- Celik Gülfem G. Direct cost assessments in subjects with seasonal allergic rhinitis living in ankara, turkey. Allergy Asthma Proc. 2004 Mar-Apr;25(2):107–113.
- Kim SY. Economic burden of allergic rhinitis in korea. Am J Rhinology Allergy 2010 Sep–Oct;24(5):110–113.
- Ghoshal AG. The burden of segregated respiratory diseases in india and the quality of care in these patients: results from the asia-pacific burden of respiratory diseases study. Lung India. 2016 Nov-Dec;33(6):611–619.
- Crystal-Peters J. The cost of productivity losses associated with allergic rhinitis. Am J Manag Care. 2000 Mar;6(3):373–378.
- van der Leeuw S, van der Molen T, Dekhuijzen PN, et al. The minimal clinically important difference of the control of allergic rhinitis and asthma test (CARAT): cross-cultural validation and relation with pollen counts. NPJ Prim Care Respir Med. 2015;25:14107.
- Meltzer EO. Quality of life in adults and children with allergic rhinitis. J Allergy Clin Immunol. 2001 Sep;108(1):45–53.
- Meltzer EO. Allergic rhinitis: burden of illness, quality of life, comorbidities, and control. Immunol Allergy Clin North Am. 2016 May;36(2):235–248.
- Celakovska J, Bukac J. The severity of atopic dermatitis evaluated with the SCORAD index and the occurrence of bronchial asthma and rhinitis, and the duration of atopic dermatitis. Allergy Rhinol (Providence). 2016;7(1):8–13.
- Wallach Daniel D. Atopic dermatitis/atopic eczema. Chem Immunol Allergy. 2014;100:81–96.
- Weidinger S. Atopic dermatitis. Lancet. 2016 Mar 12;387(10023):1109–1122.
- Asher MI. Worldwide time trends in the prevalence of symptoms of asthma, allergic rhinoconjunctivitis, and eczema in childhood: ISAAC phases one and three repeat multicountry cross-sectional surveys. Lancet. 2006 Aug 26;368(9537):733–743.
- Odhiambo Joseph AJA. Global variations in prevalence of eczema symptoms in children from ISAAC phase three. J Allergy Clin Immunol. 2009 Dec;124(6):1251–1258.
- Yong M-YA. Atopic dermatitis: racial and ethnic differences. Dermatol Clin. 2017 Jul;35(3):395–402.
- Yu JS. Prevalence of atopic dermatitis in korea: analysis by using national statistics. J Korean Med Sci. 2012 Jun;27(6):681–685.
- Al-Afif KAM, Buraik MA, Buddenkotte J. Understanding the burden of atopic dermatitis in africa and the middle east. Dermatol Ther (Heidelb). 2019 Jun;9(2):223–241.
- Barbarot S, Auziere S, Gadkari A, et al., Epidemiology of atopic dermatitis in adults: results from an international survey. Allergy. 2018;73(6): 1284–1293.
- Silverberg JI. Health care utilization, patient costs, and access to care in US adults with eczema: A population-based study. JAMA Dermatol. 2015 Jul;151(7):743–752.
- Silverberg JI, Gelfand JM, Margolis DJ, et al. Atopic dermatitis in US adults: from population to health care utilization. J Allergy Clin Immunol Pract. 2019;7(5):1524–1532.e2.
- Chiesa Fuxench ZC, Block JK, Boguniewicz M, et al. Atopic dermatitis in america study: A cross-sectional study examining the prevalence and disease burden of atopic dermatitis in the US adult population. J Invest Dermatol. 2019;139(3):583–590.
- Drucker Aaron MAM, Wang AR, Li W-Q. The burden of atopic dermatitis: summary of a report for the national eczema association. J Invest Dermatol. 2017;137(1):26–30.
- Bickers DR, Lim HW, Margolis D. The burden of skin diseases: 2004 a joint project of the american academy of dermatology association and the society for investigative dermatology. J Am Acad Dermatol. 2006 Nov;55(3):490–500.
- Lim HW, Collins SAB, Resneck JS Jr, et al. The burden of skin disease in the united states. J Am Acad Dermatol. 2017;76(5):958–972.e2.
- Lim HW, Collins SAB, Resneck JS Jr, et al. A risk adjustment approach to estimating the burden of skin disease in the united states. J Am Acad Dermatol. 2018;78(1):129–140.
- Zink AGS, Arents B, Fink-Wagner A. Out-of-pocket costs for individuals with atopic eczema: A cross-sectional study in nine european countries. Acta Derm Venereol. 2019 Mar 01;99(3):263–267.
- van Os-medendorp H, Appelman-Noordermeer S, Bruijnzeel-Koomen C, et al. Sick leave and factors influencing sick leave in adult patients with atopic dermatitis: A cross-sectional study. J Clin Med. 2015;4(4):535–547.
- Kim C, Park KY, Ahn S. Economic impact of atopic dermatitis in korean patients. Ann Dermatol. 2015 Jun;27(3):298–305.
- Zuberbier T, Orlow SJ, Paller AS. Patient perspectives on the management of atopic dermatitis. J Allergy Clin Immunol. 2006 Jul;118(1):226–232.
- Arima K, Gupta S, Gadkari A. Burden of atopic dermatitis in japanese adults: analysis of data from the 2013 national health and wellness survey. The Journal of Dermatology. 2018 Apr;45(4):390–396.
- Drucker AM. Atopic dermatitis: burden of illness, quality of life, and associated complications. Allergy Asthma Proc. 2017 Jan 01;38(1):3–8.
- Abolfotouh MA. Quality of life in patients with skin diseases in central saudi arabia. Int J Gen Med. 2012;5:633–642.
- Weisshaar EE. Pruritus as a leading symptom: clinical characteristics and quality of life in german and ugandan patients. Br J Dermatol. 2006 Nov;155(5):957–964.
- Tsai TF. Burden of atopic dermatitis in asia. J Dermatol. 2019 Aug 22;46(10):825–834.
- Hay RJ, Johns NE, Williams HC. The global burden of skin disease in 2010: an analysis of the prevalence and impact of skin conditions. J Invest Dermatol. 2014 Jun;134(6):1527–1534.
- Allen KJ, Dharmage SC. The role of food allergy in the atopic march. Clin Exp Allergy. 2010;40(10):1439–1441.
- Emons JAM, Gerth van Wijk R. Gerth van Wijk R. Food allergy and asthma: is there a link? Curr Treat Options Allergy. 2018;5(4):436–444.
- Scadding GK, Scadding GW. Diagnosing allergic rhinitis. Immunol Allergy Clin North Am. 2016;36(2):249–260.
- Tham EH. Mechanisms by which atopic dermatitis predisposes to food allergy and the atopic march. Allergy Asthma Immunol Res. 2019 Jan;11(1):4–15.
- Saidova A, Hershkop AM, Ponce M, et al. Allergen-specific T cells in IgE-mediated food allergy. Arch Immunol Ther Exp (Warsz). 2018;66(3):161–170.
- Turnbull JL, Adams HN, Gorard DA. Review article: the diagnosis and management of food allergy and food intolerances. Aliment Pharmacol Ther. 2015;41(1):3–25.
- Zuidmeer L, Goldhahn K, Rona RJ, et al., The prevalence of plant food allergies: A systematic review. J Allergy Clin Immunol. 2008;121(5): 1210–1218.e4.
- Xepapadaki P, Fiocchi A, Grabenhenrich L, et al. Incidence and natural history of hen’s egg allergy in the first 2 years of life-the EuroPrevall birth cohort study. Allergy. 2016;71(3):350–357.
- Schoemaker AA, Sprikkelman AB, Grimshaw KE, et al. Incidence and natural history of challenge-proven cow’s milk allergy in european children–EuroPrevall birth cohort. Allergy. 2015;70(8):963–972.
- Koplin JJ, Mills EN, Allen KJ. Epidemiology of food allergy and food-induced anaphylaxis: is there really a western world epidemic? Curr Opin Allergy Clin Immunol. 2015;15(5):409–416.
- Kummeling I, Mills EN, Clausen M, et al. The EuroPrevall surveys on the prevalence of food allergies in children and adults: background and study methodology. Allergy. 2009;64(10):1493–1497.
- Lyons SA, Burney PGJ, Ballmer-Weber BK, et al., Food allergy in adults: substantial variation in prevalence and causative foods across europe. J Allergy Clin Immunol Pract. 2019;7(6): 1920–1928.e11.
- Mahesh PA, Fedorova O, Leung TF, et al. Prevalence of food sensitization and probable food allergy among adults in india: the EuroPrevall INCO study. Allergy. 2016;71(7):1010–1019.
- Nwaru BI, Hickstein L, Panesar SS, et al., The epidemiology of food allergy in europe: A systematic review and meta-analysis. Allergy. 2014;69(1): 62–75.
- Loh Wenyin W. The epidemiology of food allergy in the global context. Int J Environ Res Public Health. 2018;15(9):2043.
- Wang XY, Zhuang Y, Ma TT, et al. Prevalence of self-reported food allergy in six regions of inner mongolia, northern china: A population-based survey. Med Sci Monit. 2018;24(24):1902–1911.
- Sicherer SH, Sampson HA. Food allergy: A review and update on epidemiology, pathogenesis, diagnosis, prevention, and management. J Allergy Clin Immunol. 2018;141(1):41–58.
- Verrill Linda L, Bruns R, Luccioli S. Prevalence of self-reported food allergy in U.S. adults: 2001, 2006, and 2010. Allergy Asthma Proc. 2015 Nov-Dec;36(6):458–467.
- Rona RJ, Keil T, Summers C, et al. The prevalence of food allergy: A meta-analysis. J Allergy Clin Immunol. 2007;120(3):638–646.
- Jansson SA, Protudjer JL, Arnlind Heibert M, et al., Socioeconomic evaluation of well-characterized allergy to staple foods in adults. Allergy. 2014;69(9): 1241–1247.
- Fox M, Mugford M, Voordouw J, et al. Health sector costs of self-reported food allergy in europe: A patient-based cost of illness study. Eur J Public Health. 2013;23(5):757–762.
- Patel DA, Holdford DA, Edwards E, et al. Estimating the economic burden of food-induced allergic reactions and anaphylaxis in the united states. J Allergy Clin Immunol. 2011;128(1):110–115.e5.
- Bilaver LA, Chadha AS, Doshi P. Economic burden of food allergy: A systematic review. Ann Allergy Asthma Immunol. 2019 Apr;122(4):373–380.
- Flokstra-de Blok BM, DunnGalvin A, Vlieg-Boerstra BJ, et al. Development and validation of the self-administered food allergy quality of life questionnaire for adolescents. J Allergy Clin Immunol. 2008;122(1):139–44, 144.e1-2.
- Flokstra-de Blok BM, DunnGalvin A, Vlieg-Boerstra BJ, et al. Development and validation of a self-administered food allergy quality of life questionnaire for children. Clin Exp Allergy. 2009;39(1):127–137.
- DunnGalvin A, de BlokFlokstra BM, Burks AW, et al. Food allergy QoL questionnaire for children aged 0-12 years: content, construct, and cross-cultural validity. Clin Exp Allergy. 2008;38(6):977–986.
- Cohen BL, Noone S, Munoz-Furlong A, et al. Development of a questionnaire to measure quality of life in families with a child with food allergy. J Allergy Clin Immunol. 2004;114(5):1159–1163.
- Greenhawt M. Food allergy quality of life and living with food allergy. Curr Opin Allergy Clin Immunol. 2016;16(3):284–290.
- DunnGalvin Audrey A. The effects of food allergy on quality of life. Chem Immunol Allergy. 2015;101:235–252.
- Kansen HM, Le TM, Meijer Y, et al. The impact of oral food challenges for food allergy on quality of life: A systematic review. Pediatr Allergy Immunol. 2018;29(5):527–537.
- Kulthanan K. Economic burden of the inadequate management of allergic rhinitis and urticaria in asian countries based on the GA2LEN model. Allergy Asthma Immunol Res. 2018 Jul;10(4):370–378.
- Drucker AM, Wang AR, Qureshi AA. Research gaps in quality of life and economic burden of atopic dermatitis: the national eczema association burden of disease audit. JAMA Dermatol. 2016 Jan;152(8):873–874.
- Yii AC, Tay TR, Choo XN, et al. Precision medicine in united airways disease: A “treatable traits” approach. Allergy. 2018;73(10):1964–1978.
- Milner JD. Primary atopic disorders. Annu Rev Immunol. 2020;38:785–808.
- Pinart M, Benet M, Annesi-Maesano I, et al. Comorbidity of eczema, rhinitis, and asthma in IgE-sensitised and non-IgE-sensitised children in MeDALL: A population-based cohort study. Lancet Respir Med. 2014;2(2):131–140.
- Akar-Ghibril N, Casale T, Custovic A, et al. Allergic endotypes and phenotypes of asthma. J Allergy Clin Immunol Pract. 2020;8(2):429–440.
- Akinbami LJ, Sullivan SD, Campbell JD, et al. Asthma outcomes: healthcare utilization and costs. J Allergy Clin Immunol. 2012;129(3 Suppl):S49–64.
- Kim CH, Dilokthornsakul P, Campbell JD, et al. Asthma cost-effectiveness analyses: are we using the recommended outcomes in estimating value? J Allergy Clin Immunol. 2018 Mar–Apr;6(2):619–632.