
ABSTRACT
Background
Understanding variability in prescribing patterns through comparative drug utilization studies can contribute to improve an efficient, effective and safe use of medicines.
Objectives
To perform a cross-country comparison of consumption patterns of ambulatory high expenditure therapeutic groups between Portugal and six European countries and simulate potential cost-saving scenarios through the adoption of the different prescribing patterns of studied countries.
Methods
Cross-country comparison of 2019 drug consumption patterns between Portugal, Denmark, England, Finland, the Netherlands, Norway, and Spain. Analysis comprised antihypertensive drugs, glucose lowering drugs (GLD), insulins, lipid lowering drugs (LLD) and oral anticoagulants. Cost-saving analysis were performed using the Portugal average annual cost/daily defined dose and the potential reduction in expenditure simulating other European countries consumption pattern scenarios.
Results
Portugal had the lowest consumption uptake of metformin and the highest consumption of GLD (30.1%) and LLD (8.5% vs <3%) fixed-dose combinations. Annual cost-savings scenarios showed that Portugal would have saved between 53 M€ and 305 M€ if it had the same prescribing patterns than Norway or the Netherlands, respectively.
Conclusions
Different utilization patterns across countries were found. Although Portugal has the lowest gross domestic product per capita among the countries studied, it had the highest uptake of newly and costly drugs.
1. Introduction
Over the last decades, Portugal showed significant improvements in population health-related indicators, such as life expectancy or child mortality. Healthcare expenditure has increased during this period, facing nowadays a sustainability threat. The average growth in health expenditure is higher than the growth in gross domestic product (GDP) [Citation1]. This was heightened with the recent financial and economic national crisis which had a huge impact in the health sector [Citation2].
Globally, the evolving landscape of health systems led to an increase in expenditure, representing a considerable share of the public budget. That was mainly driven by the high-cost of new health technologies, population aging and increasing prevalence of chronic diseases Citation3]. Innovation on pharmaceuticals and other health products requires an effort to balance the management of finite health budgets, without compromising the access to the most appropriate therapies [Citation4]. A deep understanding of healthcare pharmaceutical expenditure and what measures have to be implemented to control it, is paramount within this context [Citation4].
The Portuguese healthcare is largely provided by the publicly funded National Health Service which has universal coverage and is financed mainly through taxation. In Portugal, the public expenditure on pharmaceutical products at the outpatient level represents the third-largest share of health costs [Citation5]. In 2019 alone, the total amount of public expenditure on prescribed medicines at the outpatient level was 1,327.2 M€ and the correspondent out-of-pocket expenditure was 732.7 M€. The therapeutic groups with greater impact on public expenditure were oral glucose lowering drugs (GLD), followed by oral anticoagulants (OAC), antihypertensive drugs (AHD), insulins, antiasthmatics, and bronchodilators [Citation6]. All these medicines can be prescribed either by a general practitioner (GP) or a specialist at any stage of disease treatment.
The pioneering drug research studies in Europe in the late 60s focused on assessing differences in utilization of medicines between countries and highlighted the need for an internationally accepted classification system for drug utilization studies. Since 1981, the World Health Organization (WHO) has recommended the Anatomical Therapeutic and Chemical classification/Defined Daily Dose (ATC/DDD) system as the international standard for drug utilization studies. Over the years, the knowledge of consumption patterns and expenditure has allowed the identification of areas of strategic interest to tailor intervention programs, with the purpose of ensuring the sustainability of pharmaceutical sector. In this scope, cross-national drug utilization research has played a role in helping to quantify, understand, and evaluate the drug usage process and ultimately to contribute to rational use of medicines [Citation7].
Acknowledging that prescription patterns may differ across European countries due to different range of factors, there is a need to study the consumption and the financial implications of changes in therapeutic groups with the greatest impact on public expenditure in Portugal. Therefore, this study focuses on four therapeutic classes that, in addition of their high financial burden on public expenditure, are also the therapeutic groups used in the most prevalent chronic diseases, that is, AHD, GLD, LLD, and OAC. We performed a cross-country comparison of drug consumption patterns between Portugal and six European countries (Denmark, England, Finland, the Netherlands, Norway, and Spain) and simulated potential cost-saving scenarios.
2. Methods
2.1. Study design and data sources
A cross-national comparison study comprising data consumption from the year of 2019 was conducted. Portuguese data was retrieved from hmR Pharmacy Sales Information System, a national database with representative drug dispensing data at a regional level from ambulatory care [Citation8]. Consumption data regarding the remainder six European countries was retrieved from open-access databases from regulatory health authorities or health insurance organizations in each country: Denmark – the MEDical STATistics from Danish Health Data Authority [Citation9]; England – Prescription Cost Analysis from National Health Service Prescription Services [Citation10]; Finland – Finnish Statistics on Medicines from the cooperation between Insurance Institution of Finland and the Finnish Medicines Agency [Citation11]; the Netherlands – information system from National Health Care Institute [Citation12]; Norway – Norwegian Prescription Database provided by Norwegian Institute of Public Health [Citation13] and Spain – hmR Pharmacy Sales Information System [Citation8]. Detailed information on the databases used is provided in Supplementary Data. Demographic data related to the total population size per 1st January in the referred year was retrieved from the EUROSTAT [Citation14]. For England population, data was taken from the Office for National Statistics [Citation15].
2.2. Data analysis
Consumption data was expressed in defined daily dose (DDD) per 1000 inhabitants per day (DID) using the Anatomical Therapeutic and Chemical classification/Defined Daily Dose (ATC/DDD) system developed by the WHO Collaborating Center for Drug Statistics Methodology. DDD is defined as the average maintenance dose per day for a drug used for its main indication in adults [Citation16]. There is only one DDD per ATC code and route of administration and this unit is independent of costs, currencies, package size or strength [Citation7]. In the ATC/DDD index, only DDD assigned to single substances are published. For fixed dose combinations (pharmaceutical products containing two or more active substances), the DDD is described in guidelines published by WHO which have allocated different ATC codes from plain products containing one active substance. For substances not included in the ATC/DDD system, the maintenance daily dose recommended by the marketing authorization holder is used [Citation17]. DID may give a rough estimate of the proportion of the population exposed daily with a particular drug or group of drugs [Citation18].
For this study, the following ATC groups were selected: AHD: C02, C03, C07, C08, and C09; GLD and insulins: A10; LLD: C10 and OAC: B01. Drug consumption was described for all studied therapeutic groups and by each chemical subgroup or active substance and calculated as a percentage of all therapeutic group consumption. Utilization patterns were identified by the consumption in percentage of DID.
2.3. Cost-saving scenarios
In order to perform cost-saving analysis, several expenditure scenarios were simulated using each European country drug utilization patterns for the year of 2019, applied to total DID consumption observed in Portugal. The cost-saving analysis was performed using the mean cost per DDD (€/DDD) in Portugal. The Portuguese cost per DDD (2019) according to each therapeutic group analyzed is presented in Supplementary Data.
The total costs allocated to each therapeutic agent/subgroup were calculated for each one of the four therapeutic groups studied.
In detail, for each cost-saving scenario computed, the potential reduction in the Portuguese expenditure studied therapeutic groups was estimated simulating each European country consumption pattern scenario (% DDD) using the mean cost/DDD in Portugal as reference. The difference between the observed expenditure in 2019 and the expected expenditure retrieved from the simulated scenario was computed for all therapeutic groups and for all six European countries.
Analysis was conducted using SAS Enterprise Guide v7.15 (SAS Institute, Cary, NC).
3. Results
Total consumption of the selected therapeutic groups amongst the studied countries is presented in . AHD consumption data showed that the country with the highest uptake was Finland followed by Denmark and Portugal. Regarding the total consumption of GLD (excl. insulins), a considerably higher use was identified in Portugal than other studied countries (e.g. 79.83 DID vs 36.64 DID in Norway). Contrariwise, Portugal had the lowest consumption of insulins across the countries studied. OAC consumption in Portugal was one of the lowest, surpassed only by England and Spain. An in-depth descriptive analysis per each studied therapeutic group is presented below.
Table 1. Total consumption (defined daily doses per 1000 inhabitants per day) of analyzed therapeutic groups, 2019.
3.1. Antihypertensive drugs
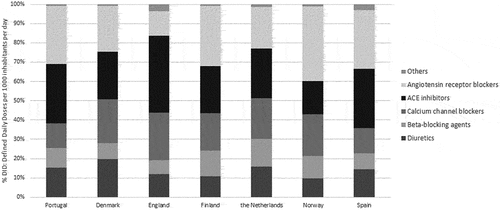
This group was analyzed according to the following classes: diuretics (C03), β-blocking agents (C07), calcium channel blockers (CCB) (C08), angiotensin-converting-enzyme inhibitors (ACEi) (C09A + C09B), angiotensin receptor blockers (ARB) (C09C + C09D) and others (C02 + C09X). Regarding the AHD utilization patterns, cross-national analysis showed that in Portugal, the groups with the highest uptake were ACEi (30.7%) and ARB (30.2%). The Portuguese high proportion of ARB consumption was surpassed by Spain (30.6%), Finland (31.5%), and Norway (38.7%). The Portuguese share of ARB consumption was approximately 2.4 higher than the share noted in England. In Portugal, the least expensive AHD were diuretics (C03) and CCB (C08) and they represented 15.2% and 12.8% of the AHD consumption, respectively (). In 2019, antiadrenergic agents (e.g. methyldopa) and renin inhibitors (aliskiren) had little expression in AHD Portuguese consumption. Regarding the total expenditure in AHD, ARB represent the group with the higher cost weight followed by the ACEi.
Figure 1. Share of antihypertensive drugs by chemical subgroup, 2019 (% DID: defined daily doses per 1000 inhabitants per day).
3.2. Glucose lowering drugs
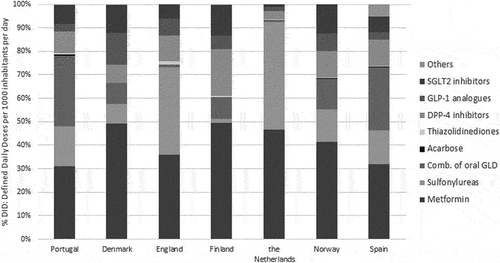
The GLD (exc. insulins) were analyzed according to the following: metformin (A10BA02), sulfonylureas (A10BB), fixed-dose combinations of oral GLD (A10BD), acarbose (A10BF01), thiazolidinediones (TZD) (A10BG), DPP-4 inhibitors (DPP-4i) (A10BH), glucagon-like peptide-1 analogues (GLP-1a) (A10BJ), sodium-glucose co-transporter 2 inhibitors (SGLT2i) (A10BK) and others (A10BX). Although metformin was the cheapest GLD (0.15€/DDD in Portugal), Portugal metformin consumption (31.1%) was the lowest among the studied countries. By contrast, Portugal presented the highest consumption rate of fixed-dose combinations, one of the most expensive (1.58€/DDD), with a share of 30.1%, against 0.9% in the Netherlands or 1% in England (). Within the group of fixed-dose combinations of GLD, the active substances with the highest uptake consumption in Portugal were metformin+DPP-4i (sitagliptin or vildagliptin), followed by the combination of metformin+dapagliflozin. These were the agents with the highest impact in the total expenditure of GLD since no generic options are available. Overall, the GLD expenditure analysis showed that fixed-dose combinations of GLD entails the greatest financial burden followed by SGLT2i and DPP-4i alone. In 2019, the new classes of GLP-1a and SGLT2i presented a consumption share of 3.2% and 8.3% respectively, in Portugal.
Figure 2. Share of glucose lowering drugs (excluding insulins) by chemical subgroup, 2019 (% DID: defined daily doses per 1000 inhabitants per day).
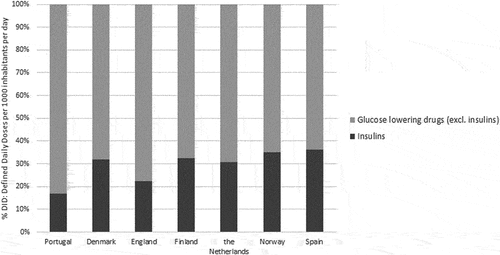
The proportion of insulin consumption in the total GLD revealed that Portugal was the country with the lowest consumption: 16.9%, near half than Denmark (32%), Finland (32.4%), and Norway (35.0%) ().
Figure 3. Proportion of insulin consumption in total market of glucose lowering drugs, 2019 (% DID: defined daily doses per 1000 inhabitants per day).
3.3. Lipid lowering drugs
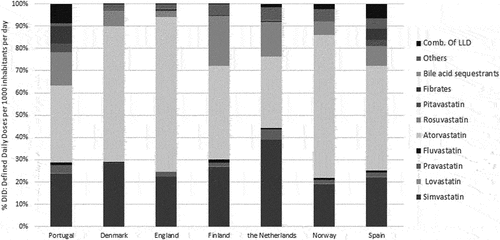
The LLD consumption results were analyzed according to the following: simvastatin (C10AA01), lovastatin (C10AA02), pravastatin (C10AA03), fluvastatin (C10AA04), atorvastatin (C10AA05), rosuvastatin (C10AA07), pitavastatin (C10AA08), fibrates (C10AB), bile acid sequestrants (C10AC), other lipid modifying agents and nicotinic acid and derivatives (C10AX + C10AD) and combination of LLD (C10B). Fixed-dose combination of LLD agents, one of the most expensive drugs in this class (1.04€/DDD in Portugal), represented the highest consumption rate in Portugal (8.5%), contrasting with 0% in England and 0.1% in Denmark and Finland. On the contrary, atorvastatin (one of the cheapest LLD) presented a consumption market share over 60% in Denmark (61.1%), Norway (64.3%), and England (69.3%), whereas in Portugal it reached only 34.6% of market share within LLD. Pitavastatin, the newly marketed statin and the most expensive one was used only in Portugal and Spain (share of 3.8%) (). The sub-group with the highest weight in LLD pharmaceutical expenditure was the HMG CoA reductase inhibitors (statins) followed by the fixed-dose combination of LLD agents.
Figure 4. Share of lipid lowering drugs by subgroup, 2019 (% DID: defined daily doses per 1000 inhabitants per day).
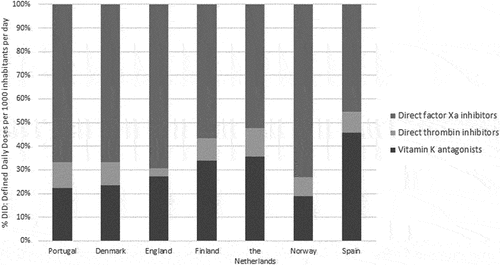
3.4. Oral anticoagulants
The overall results were analyzed according to the following groups: vitamin K antagonists (VKA) (B01AA), direct thrombin inhibitors (B01AE), and direct factor Xa inhibitors (B01AF). Portugal had one of the lowest market shares of VKA with a consumption uptake of 22.2% against 35.6% and 45.6% in the Netherlands and Spain, respectively (). Regarding the OAC utilization, the direct thrombin inhibitors accounted for about 83% of total OAC expenditure.
Figure 5. Share of oral anticoagulants by subgroup, 2019 (% DID: defined daily doses per 1000 inhabitants per day).
3.5. Cost-saving analysis
Overall cost-saving analysis for the selected therapeutic groups showed that Portugal would have saved between 53 M€ and 305 M€ if it had the same prescribing pattern than the Norway or the Netherlands, respectively in 2019 alone ().
Table 2. Annual cost-saving scenarios (€), 2019.
In Portugal, GLD represented a total expenditure of 290 M€ and if adopted the same consumption patterns of the Netherlands or England, the estimated savings would have been 199 M€ and 83 M€, respectively. This represented the highest potential savings that could be achieved, from all selected groups.
Regarding LLD, Portugal would have saved between 57 M€ and 68 M€, if it had the same consumption pattern as any country under study. In 2019, the AHD consumption accounted for 297 million € in Portugal, the highest expenditure of all therapeutic groups and 30 M€ could have been saved with consumption patterns similar to England.
4. Discussion
Globalization and the current challenges healthcare systems are facing have increased the need to compare the quality of prescribing indicators, effectiveness and cost of treatments between countries. This study provides an overview of high expenditure ambulatory therapeutic groups used in the most prevalent chronic diseases in seven European countries. Overall, a large variation in prescribing patterns was identified and characterized. Although Portugal has the lowest GDP per capita among the studied countries [Citation19], was the country with the highest uptake of the newer and costly drugs. This was the key driver for the main differences found across the simulated cost-saving scenarios performed.
4.1. Antihypertensive drugs
Despite ACE being the most prescribed AHD, Portugal had a high proportion of ARB consumption (30.2%) as compared to other countries, which represented the major budget impact given their high cost. To manage the consumption of this therapeutic class, some countries have put efforts on implementing specific guidelines with clear recommendations on how to treat patients with uncontrolled blood pressure or with a prior experience with adverse reactions (e.g. cough or angioedema) [Citation20,Citation21]. This was the case of England, where there is a well-established NICE guideline regarding the diagnosis and management of hypertension, and although it is not mandatory, its compliance is regularly audited. The NICE guideline established several treatment steps and promotes offering an ACE inhibitors or ARB as first-line uptake only for adults who have type 2 diabetes, and CCB for all the remainder groups, which explains the higher consumption of this therapeutic class in England [Citation22]. The low consumption of ARB in England can also be explained by its higher price since GP are encouraged to prescribe low-cost generic medicines whenever is possible [Citation23].
In Portugal the last update of the existent hypertension guideline occurred in 2013 [Citation24,Citation25], which reveals its lack of applicability in the clinical practice since it is obsolete and does not reflect the state of the art of pharmacological therapy for hypertension. Therefore, Portuguese clinicians seem to follow the European guidelines which favors both ACE or ARB as first-line agents [Citation26]. Nevertheless, it should be noted that despite the Portuguese prescribing pattern found, the proportion of patients treated with uncontrolled blood pressure remains very high probably due to the lack of adherence to treatment [Citation27], which is worrisome given the high prevalence and clinical consequences of this disease [Citation28].
4.2. Glucose lowering drugs
As compared with other countries, a considerably higher use of GLD (excluding insulins) was identified in Portugal. This may be due to the higher prevalence of diabetes [Citation29], as well as the lower use of insulin [Citation30]. Insulin uptake in Portugal was the lowest among the studied countries, suggesting that Portuguese prescribers seem to give preference to the intensification of oral GLD therapy, delaying the need for administration of insulin [Citation31]. There are several concerns associated with insulin therapy that contribute to its low utilization, namely weight gain and hypoglycemia, as well as stigma and interference in social life. In Portugal, the insulin reimbursement is fully covered, meaning price do not constitute a barrier to uptake [Citation32]. However, it is well known that the effectiveness of the insulin therapy highly depends on its appropriate utilization [Citation33]. It is essential to have a network of healthcare professionals prompt to answer to the problems that may arise. This type of established structures does not exist in Portugal, creating a great gap between the insulin prescription and patients therapeutic management [Citation32].
Portugal presented the lowest proportion of metformin utilization, which besides its low price, presents a high efficacy and minimal hypoglycemia risk [Citation33]. Additionally, a sharp contrast with England and the Netherlands was identified regarding the sulfonylureas consumption (16.8% versus 37.2% in England and 46.0% in the Netherlands). This lower-cost class has a high glucose-lowering efficacy; however, it is associated with weight gain and risk of hypoglycemia [Citation33]. Overall, unlike other countries, Portuguese prescribers favor the fixed-dose GLD combinations, especially with DPP-4i, which had the highest cost. The advantages of DPP-4i are the low risk of hypoglycemia and of weight gain [Citation33]. SGLT2i, one of the newest classes, ranked the second with the highest financial impact in diabetes therapy. This class demonstrated effective cardio-renal protection, weight loss, blood pressure lowering effect and low risk of hypoglycemia [Citation34]. They can be combined with any drug class at any stage in the history of the disease due to its insulin-independent action [Citation35]. The European guidelines recommend SGLT2i as a preferred add-on to metformin for patients with cardiovascular disease or at high cardiovascular risk [Citation36,Citation37].
Differences exist between countries regarding to guidelines implementation and programmes for prevention and treatment of diabetes. For example, in England, there is an ongoing strategy with the Quality and Outcomes Framework that provides economic incentives to GP for the provision of quality clinical care in primary care settings which has driven significant results in the management of diabetes [Citation38]. In the Netherlands, beyond several educational programs and prevention plans toward a healthier life, there are quality indicators with financial incentives to healthcare providers used by insurance companies to achieve quality standards in diabetes care [Citation39]. In Portugal, the official treatment guidelines do not reflect the current therapeutic armamentarium for diabetes. Some guidelines were issued for almost a decade ago, and no updates or changes have occurred since then [Citation35,Citation40]. Nevertheless, beyond guidelines update and auditing mechanisms, other efforts toward a better and integrated healthcare strategies for diabetes management should be implemented in Portugal. The increasing proportion of patients with hemoglobin A1C >8.0% (19.6% in 2017 and 19.9% in 2018) which indicates a poor control glycemic management is a reality which demand a call for action [Citation41].
4.3. Lipid lowering drugs
To our knowledge, there is no large-scale study comparison of the effectiveness between statins regarding cardiovascular outcomes, but some studies concluded that there are some differences regarding the improvement of lipid profile. Atorvastatin proved to be more effective in reducing LDL and total cholesterol without adverse effects in the CURVES study whereas in the STELLAR trial, rosuvastatin proved to be more effective in improving the lipid profile than atorvastatin at milligram-equivalent doses or higher doses of simvastatin and pravastatin. These results can partly explain the overall prescribing patterns found in our study [Citation42,Citation43].
As compared to other countries, Portugal had the highest rate of consumption of fixed-dose combination of LLD (8.5% versus near 0% in England, Denmark and Finland). The decrease in the consumption of this therapeutic class for values similar to England or Denmark would allow per se a saving of 64 M€. The discontinuation of statin therapy remains quite common, mainly due to its side effects. Guidelines highlight the importance of statin dose and potency, however, there is still some reluctance from the physicians to titrate statins without safety concerns [Citation44]. Literature suggests that by avoiding the maximum dose of a drug as monotherapy, the prevalence of adverse events depending on dose may decrease [Citation45]. Furthermore, there is evidence that combination therapies increase efficacy and reduce side effects related to higher doses. Consequently, there might be a higher tolerability and adherence by the patient [Citation46] which may justify the preference for the combination therapy in Portugal. The DA VINCI study concluded that even with optimized statins, the utilization of non-statin therapy is likely needed in order to accomplish the LDL ideal levels for patients at highest risk [Citation47]. In spite of this, the utilization of fixed-dose combination of LLD agents in Portugal must be monitored and its outcomes must be measured in order to confirm the cost-effectiveness of this therapeutic class consumption. From the data available, the proportion of treated patients without reaching the desired lipid profile values, remains quite high, as revealed in e-COR 2015 study [Citation48]. The poor treatment adherence and the prescription of statins in subtherapeutic doses might be some reasons behind this reality [Citation48].
4.4. Oral anticoagulants
In Portugal, no guidelines are set out regarding anticoagulation therapy [Citation49]. VKA, particularly warfarin were for a long time the standard therapy in atrial fibrillation (AF) prevention. Portugal has one of the lowest VKA shares among the studied countries. The underuse of VKA was studied and the conclusions pointed out to a higher risk of bleeding and to a more complex therapeutic regimen with a need for regular monitoring. It is estimated that patients are about 45% of the time, medicated under or over the ideal dose of a VKA and for that reason exposed to a higher risk of a thrombotic event or hemorrhage risk [Citation50].
Currently, novel OAC (NOAC) are as equivalent or superior to warfarin in patients with non-valvular AF and this can explain the higher utilization of this group which is recommended by international guidelines as first-line therapy [Citation51]. In fact, the prescription of NOAC has increased over the years mainly due to its simpler treatment schemes and more predictable dose effects. Both direct factor Xa inhibitors and direct thrombin inhibitors have showed a better safety–efficacy ratio [Citation50].
4.5. Strengths and limitations
There are some limitations that should be considered when interpreting the results of this study. Firstly, cross-national comparison studies pose various challenges, and therefore prescribing quality indicators cannot be directly reassigned between countries without an intermediate process that consider the variation in professional culture, clinical practice (e.g. clinical guidelines), organizational and system-level characteristics [Citation7]. Secondly, since the DDD does not necessarily reflect the consumed or the prescribed daily dose, it is not possible to assure that all medicines are being used for the approved indication.
Regardless of these limitations, our study provided a clear insight into the drug utilization patterns of ambulatory high expenditure and frequently used therapeutic groups for chronic diseases in seven European countries. Furthermore, results retrieved from the simulated cost-saving scenarios performed revealed large potential savings for Portugal when comparing with the studied countries, which reflects the need to identify factors influencing drug use and find areas for improvement drug utilization without compromising the quality of care.
5. Conclusions
Different utilization patterns of ambulatory high expenditure therapeutic groups across countries were found. Although Portugal has the lowest gross domestic product per capita among the studied countries, it had the highest consumption of newly and costly drugs; in this sense reflecting the ‘two sides of the Portuguese coin.’
The higher prevalence of the chronic diseases along with the prescribing patterns found will have implications in the pharmaceutical expenditure control and the healthcare sustainability. Therefore, identifying determinants of prescribing patterns and find areas for improvement in drug utilization without impacting the quality of care, should pave the way for the design of better and integrated strategies to achieve a more rational use of medicines. More important than updating national guidelines, is to understand the beliefs and motivations behind the current prescription behaviors and, within this scope, develop, implement, and evaluate multidisciplinary and multifaceted interventions tailored to the national setting. All in all, there are some interventions that can be implemented, such as educational (e.g. academic detailing programmes), economic/financial (e.g. implementation of incentives to improve prescribing practices) or organizational (e.g. closer relationship between health structures with multidisciplinary teams and the patients). In the end, efforts to improve quality of care require a multi-dimensional approach, should be designed and implemented based on sound scientific evidence, and be continuously evaluated.
Author contributions
I Martinho and C Torre drafted the manuscript. All authors provided substantial input in the study design, analysis, provided a critical revision of the manuscript, read, and approved the final manuscript to be published; all the requirements stated by the ICMJE have been met.
Declaration of interest
The authors have no relevant affiliations or financial involvement with any organization or entity with a financial interest in or financial conflict with the subject matter or materials discussed in the manuscript. This includes employment, consultancies, honoraria, stock ownership or options, expert testimony, grants or patents received or pending, or royalties.
Reviewer disclosures
Peer reviewers on this manuscript have no relevant financial or other relationships to disclose.
Ethics approval
Ethical approval was not required for the study, as this is population-based research, using secondary data where no individual characteristics were accessed neither individual data was analyzed.
Supplemental Material
Download MS Word (22.2 KB)Supplementary material
Supplemental data for this article can be accessed online at https://doi.org/10.1080/14737167.2023.2144839
Additional information
Funding
References
- Organization for Economic Cooperation and Development (OECD). Health at a Glance 2019. OECD Publishing, Paris: OECD Indicators; 2019. https://doi.org/10.1787/4dd50c09-en
- Morais Nunes A, Cunha Ferreira D, Campos Fernandes A. Financial crisis in Portugal: effects in the health care sector. Int J Health Serv. 2019;49(2):237–259.
- Belloni A, Morgan D, Paris V (2016), ”Pharmaceutical Expenditure And Policies: Past Trends And Future Challenges”, OECD Health Working Papers, No. 87, OECD Publishing, Paris.
- da Saúde M, da Saúde R. Portugal 2018. 2018.
- Organization for Economic Cooperation and Development (OECD)/European Observatory on Health Systems and Policies. Portugal: Country Health Profile 2019, State of Health in the EU, OECD Publ. 2019. 1–24.
- INFARMED. Monitorização do consumo de medicamentos em meio ambulatório, 2020.
- Elseviers M, Wettermark B, Almarsdóttir AB, et al. Drug utilization research - methods and applications, Willey 2016.
- Health Market Research, Pharma Data – Pharmacy. n.d. [cited 2022 May 1]. Available from: https://www.hmr.co.com/pharmacy/
- Schmidt M, Hallas J, Laursen M, et al. Data resource profile: danish online drug use statistics (MEDSTAT). Int J Epidemiol. 2016;45:1401–02G.
- Ferrer P, Ballarín E, Sabaté M, et al. On behalf of the PROTECT project. Drug consumption databases in Europe. Barcelona, February, 2015.
- Finnish Medicines Agency/Social Insurance Institution, Finnish Statistics on Medicines, (2019).
- Dutch Drug Information System (GIP) & National Health Care Institute. 2020. Available from: https://www.gipdatabank.nl/
- The Norwegian Institute of Public Health, Norwegian Prescription Database: prevalence statistics. 2020. Available from: http://www.norpd.no/Prevalens.aspx
- European Commission, Population on 1st January. Eurostat. 2019 [cited 2020 Apr 26]. Available from: https://ec.europa.eu/eurostat/databrowser/view/tps00001/default/table?lang=en
- Office for National Statistics, Population estimates, Home Off. 2019 [cited 2020 Oct 18]. Available from: https://www.ons.gov.uk/peoplepopulationandcommunity/populationandmigration/populationestimates#timeseries
- WHO Collaborating Centre for Drug Statistics Methodology, WHOCC - ATC/DDD Index 2020. 2020 [cited 2020 Oct 1]. Available from: https://www.whocc.no/atc_ddd_index/
- WHO Collaborating Centre for Drug Statistics Methodology. Guidelines for ATC classification and DDD assignment 2020, Oslo, Norway. 2020.
- WHO Collaborating Centre for Drug Statistics Methodology, DDD Indicators. 2020 [cited 2020 Oct 21]. Available from: http://www.who.int/medicines/regulation/medicines-safety/toolkit_indicators/en/
- Organization for Economic Cooperation and Development (OECD). Gross domestic product (GDP) and spending, OECD Data. 2020 [cited 2020 May 10]. Available from: https://data.oecd.org/gdp/gross-domestic-product-gdp.htm
- Li E, Heran B, Wright J. Angiotensin converting enzyme (ACE) inhibitors versus angiotensin receptor blockers for primary hypertension (Review). 2014 [cited 2020 Apr 8]. Available from: https://doi.org/10.1002/14651858.CD009096.pub2.www.cochranelibrary.com
- Pinto D, Rodrigues AP, Nunes B. Initial therapeutic choices for hypertension in the Portuguese Sentinel Practice Network. Rev Port Cardiol. 2018;37:657–663.
- National Institute for Health and Care Excellence (NICE). Hypertension in adults: diagnosis and management. NICE Guidel; 2019. www.nice.org.uk/guidance/ng136
- Taylor D, Davis M. Costs and benefits of ARBs in practice. Br J Cardiol. 2010;17:s14–s15.
- Direcção-Geral da Saúde, Abordagem Terapêutica da Hipertensão Arterial, Norma Da Direcção Geral Da Sauúde No 026/2011. 2011.
- Sociedade Europeia de Cardiologia, HIPERTENSÃO Recomendações da ESC/ESH para o Tratamento da Hipertensão Arterial. 2018.
- Williams B, Mancia G, Spiering W, et al., 2018 ESC/ESH Guidelines for the management of arterial hypertension, 2018. DOI:10.1097/HJH.0000000000001961.
- Marques da Silva P, Lima MJ, Macedo Neves P, et al. Prevalência de fatores de risco cardiovascular e outras comorbilidades em doentes com hipertensão arterial assistidos nos Cuidados de Saúde Primários: estudo Precise. Rev Port Cardiol. 2019;38(6):427–437.
- Gaio V, Antunes L, Barreto M, et al. Prevalência de hipertensão arterial em Portugal: resultados do Primeiro Inquérito Nacional com Exame Físico (INSEF 2015). Bol Epidemiológico Inst Nac Saúde Dr Ricardo Jorge. 2018;22:29–33.
- Organization for Economic Cooperation and Development (OECD)/EU, Health at a Glance: Europe 2020, State of in the EU Cycle, 2020. DOI:10.1787/82129230-en.
- Torre C, Guerreiro J, De Oliveira Martins S, et al. Patterns of glucose lowering drugs utilization in Portugal and in the Netherlands. Trends over time. Primary Care Diabetes. 2015;9:482–489.
- Dores J. Insulinoterapia na diabetes mellitus tipo 2. Rev Port Cardiol. 2013;32:25–31.
- Dores J, Melo M. Insulinas em Portugal – questões Por Resolver. Rev Port Diabetes. 2018;13:34–40.
- Davies MJ, D’Alessio DA, Fradkin J, et al. Management of hyperglycemia in type 2 diabetes, 2018. A consensus report by the American Diabetes Association (ADA) and the European association for the study of diabetes (EASD). Diabetes Care. 2018;41:2669–2701.
- Gavina C, Heitor S. Resultados do Estudo DECLARE-TIMI 58 : um Ponto de Viragem no Tratamento da Diabetes Mellitus Tipo 2. Rev Port Diabetes. 2019;14(4):51–163.
- da Saúde D-G, Abordagem Terapêutica Farmacológica na Diabetes Mellitus Tipo 2 no Adulto, Norma Da Direção-Geral Da Saúde No 052/2011. 2015. 1–28.
- Bailey CJ, Day C. The future of new drugs for diabetes management. Diabet Res Clin Pract. 2019;155:107785.
- Cosentino F, Grant PJ, Aboyans V, et al. ESC Guidelines on diabetes, pre-diabetes, and cardiovascular diseases developed in collaboration with the EASD. Eur Heart J. 2019;41(2020):255–323.
- Diabetes UK position statement, the future of the quality and outcomes framework in England. 2018 [cited 2021 Apr 13]. Available from: https://www.diabetes.org.uk/resources-s3/2018-08/Our%20position%20statement%20on%20the%20future%20of%20QOF%20in%20England.pdf
- Heintjes EM, Houben E, Beekman-Hendriks WL, et al. Trends in mortality, cardiovascular complications, and risk factors in type 2 diabetes. Neth J Med. 2019;77:317–329.
- Direcção-Geral da Saúde, Insulinoterapia na Diabetes Mellitus tipo 2, Norma da Direcção Geral Da Sauúde No 025/2011. 2014. 1–11.
- Raposo JF. Diabetes: factos e Números 2016, 2017 e 2018. Rev Port Diabetes. 2020;15:19–27.
- Jones PH, Hunninghake DB, Ferdinand KC, et al. Effects of rosuvastatin versus atorvastatin, simvastatin, and pravastatin on non-high-density lipoprotein cholesterol, apolipoproteins, and lipid ratios in patients with hypercholesterolemia: additional results from the STELLAR trial. Clin Ther. 2004;26(9):1388–1399.
- Jones P, Kafonek S, Laurora I, et al. Comparative Dose Efficacy Study of Atorvastatin Versus Simvastatin, Pravastatin, Lovastatin, and Fluvastatin in Patients With Hypercholesterolemia (The CURVES Study). Am J Cardiol. 1998;81:582–587.
- Toth PP, Banach M. Statins: then and now. Methodist Debakey Cardiovasc J. 2019;15:23–31.
- Pappa E, Rizos CV, Filippatos TD, et al. Emerging fixed-dose combination treatments for Hyperlipidemia. J Cardiovasc Pharmacol Ther. 2019;24(4):315–322.
- Masana L, Ibarretxe D, Plana N. Reasons why combination therapy should be the new standard of care to achieve the LDL-Cholesterol targets: lipid-lowering combination therapy. Curr Cardiol Rep. 2020;22. DOI:10.1007/s11886-020-01326-w.
- Stock JK. DA VINCI study: change in approach to cholesterol management will be needed to reduce the implementation gap between guidelines and clinical practice in Europe. Atherosclerosis. 2020;314:74–76.
- Cibelle Mariano MB, Antunes M, Rato Q. _e_LIPID: caracterização do perfil lipidico da população portuguesa. Inst Nac Saúde Bol Epidemiológico. 2015;14:7–10.
- Direcção-Geral da Saúde, Normas de Orientação Clínica – normas DGS. n.d. https://nocs.pt/
- Costa FM, Hemels MEW. Atrial fibrillation management: time for new goals. Rev Port Cardiol. 2020;39:663–665.
- Hindricks G, Potpara T, Dagres N, et al. ESC Guidelines for the diagnosis and management of atrial fibrillation developed in collaboration with the European Association for Cardio-Thoracic Surgery (EACTS). Eur Heart J. 2020;42(2021):373–498.