
ABSTRACT
Background
Clinical outcomes in chronic lymphocytic leukemia (CLL) have improved with targeted therapy, including Bruton tyrosine kinase inhibitors such as acalabrutinib.
Methods
A semi-Markov model with three health states (progression-free, progressed disease, and death) estimated cost per quality-adjusted life-year (QALY) gained for acalabrutinib ± obinutuzumab vs chlorambucil + obinutuzumab in treatment-naive CLL (based on ELEVATE-TN). The model used direct costs and resource utilization from the US Medicare perspective and utility values sourced from literature. Sensitivity analyses tested the robustness of the model.
Results
Over a 30-year lifetime horizon, the model base case analysis suggested that acalabrutinib monotherapy had an incremental cost of $206,329 and 2.52 QALYs gained versus chlorambucil + obinutuzumab, resulting in an incremental cost-effectiveness ratio (ICER) of $81,960/QALY. Acalabrutinib + obinutuzumab had an incremental cost of $423,747 and 2.79 QALYs gained (ICER: $152,153/QALY). Probabilistic sensitivity analysis showed the probability of acalabrutinib monotherapy being cost-effective as 59% to 73% at a $100,000-to-150,000/QALY willingness-to-pay threshold; the probability of acalabrutinib + obinutuzumab being cost-effective ranged from 34% to 51%.
Conclusions
Although the analysis is limited by uncertainty in postprogression survival outcomes, acalabrutinib monotherapy is likely cost-effective vs chlorambucil + obinutuzumab in treatment-naive CLL in the US Medicare setting.
1. Introduction
Chronic lymphocytic leukemia (CLL) is a B-cell malignancy that accounts for 38% of adult leukemia cases in the United States, with an estimated 21,250 new cases diagnosed in 2021. Older adults are at the greatest risk for CLL, with an average age at diagnosis of 70 years [Citation1,Citation2]. Progression-free survival (PFS) and overall survival (OS) rates for CLL patients have improved with the introduction of targeted therapies including Bruton tyrosine kinase (BTK) inhibitors [Citation3,Citation4]. The 5-year relative survival of people with CLL is 87.9% [Citation5].
Acalabrutinib, a next-generation BTK inhibitor, is an oral therapy approved by the US Food and Drug Administration for the treatment of patients with treatment-naive CLL and in those with relapsed or refractory CLL or mantle cell lymphoma (MCL) [Citation6]. At an initial median follow-up of 28.3 months, the phase 3 ELEVATE-TN study (NCT02475681) demonstrated significant improvements in PFS with acalabrutinib, alone or in combination with the anti-CD20 antibody obinutuzumab, compared with the chemoimmunotherapy (CIT) regimen chlorambucil + obinutuzumab and an acceptable tolerability profile in patients with treatment-naive CLL [Citation7]. The observed PFS benefits and tolerability profile of the acalabrutinib regimens were maintained with longer-term treatment in a subsequent analysis of ELEVATE-TN at a median follow-up of 46.9 months [Citation8]. Acalabrutinib is taken every 12 hours orally until progressive disease or unacceptable toxicity occurs [Citation6], whereas obinutuzumab + chlorambucil is a time-limited therapy, administered over 6 cycles (28-day cycles) [Citation8].
Health state models are frequently used to evaluate the cost-effectiveness of anticancer therapies as patients transition from progression-free to progressive disease to death. Conventional Markov models are time-homogeneous or memoryless and do not account for changes in the transition probabilities as time passes, whereas semi-Markov models utilize transition probabilities that are time dependent via tunnel states or time-varying probabilities, which allow the mortality risk to vary depending on the time the patient has been in the progression-free state [Citation9,Citation10]. Because the cost-effectiveness of acalabrutinib as first-line treatment for CLL has not been widely evaluated in the US setting, our objective was to analyze acalabrutinib-containing regimens vs chlorambucil + obinutuzumab in terms of costs, survival, and quality of life from a US payer (Medicare) perspective using a semi-Markov approach to allow for time-dependent transition probabilities between the health states. Results from the 4-year follow-up of the ELEVATE-TN study [Citation8] provided a basis and key data for developing an economic analysis of acalabrutinib ± obinutuzumab compared with chlorambucil + obinutuzumab in the first-line CLL treatment setting in the United States.
2. Methods
2.1. Decision model overview
This analysis employed a semi-Markov modeling approach using Microsoft Excel® to simulate disease progression and to estimate the total direct costs and quality-adjusted life-years (QALYs) associated with the included treatment regimens over a patient’s lifetime. Acalabrutinib monotherapy and acalabrutinib + obinutuzumab were included as separate interventions and compared with chlorambucil + obinutuzumab. A summary overview of key model details and inputs is presented in Table S1.
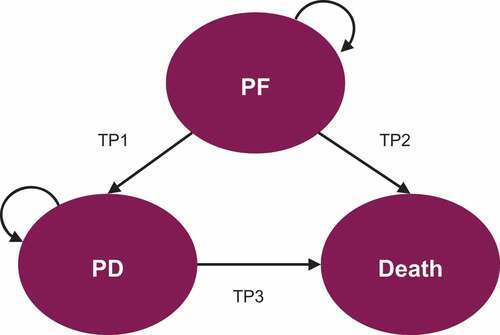
A semi-Markov model was developed with three health states: progression-free (PF), progressed disease (PD), and death (). The CLL cohort starts in the PF state where patients receive first-line treatment. Patients can stay in a PF state or transition to PD or death. Once in the PD state, patients receive one subsequent line of treatment. From PD, patients can stay in the PD state or transition to death. In this study, tunnel states enable time-dependent transition probabilities to be assigned to patients for all possible transitions from each state during each cycle to account for the competing risks of death associated with pre- and post-progression survival and general population mortality. For example, when accounting for patients in the PF state, probability exists for patients remaining progression free, incurring pre-progression death (related to CLL), incurring all-cause mortality (general population mortality), and experiencing disease progression (). The tunnel states allow all transition probabilities to vary based on the amount of time that has passed in the model.
Figure 1. Diagram of the three-state semi-Markov model structure.
For this model, a lifetime horizon of 30 years was used as the base case assumption based on the population’s starting age and life expectancy as well as a review of other models conducted in CLL populations. The cycle length was 4 weeks (28 days), consistent with the 4-week drug administration cycles in ELEVATE-TN. A half-cycle correction was applied. The US standard discount rate of 3% was applied to all model outcomes per Institute for Clinical and Economic Review recommendations [Citation11].
2.2. Patient population
The modeled patient cohort of previously untreated CLL patients in the United States was based on the intention-to-treat (ITT) population from the ELEVATE-TN trial. At baseline, the overall population had a median age of 70 years and a median body weight of 79.0 kg; 61.3% of patients were male, and 47% had Rai stage 3 or 4 disease. Oral acalabrutinib dosing was 100 mg twice daily [Citation7]. Data from ASCEND (NCT02970318) were pooled with ELEVATE-TN to model post-progression survival (PPS). At baseline, the overall population in the ASCEND trial had a median age of 67 years; among patients in the acalabrutinib group, 70% were male and 42% had Rai stage 3 or 4 dosing. In ASCEND, the dosing of acalabrutinib was also 100 mg twice daily [Citation12].
2.3. Clinical data
OS and PFS endpoints from the ELEVATE-TN trial (median study follow-up of 46.9 months) were used to derive the main efficacy and safety model inputs for the first-line treatment regimens up to a limited follow-up time of 57 months. Extrapolation to estimate lifetime outcomes was performed by fitting parametric survival functions to event-free survival (e.g. time to progression [TTP] and PPS data). The UK National Institute for Health and Care Excellence (NICE) Decision Support Unit methodology for survival modeling was followed, which includes using visual fit, statistical goodness-of-fit measures (i.e. Akaike information criterion [AIC], Bayesian information criterion [BIC]), and clinical plausibility of long-term extrapolations [Citation13]. To fit the clinical data from the ELEVATE-TN trial to the semi-Markov model structure, the investigator-assessed PFS endpoints were used. The pre-progression transition curves for TTP and time to death (TTDeath) were derived by censoring progression and death events, respectively, in the ELEVATE-TN PFS dataset. For extrapolation of TTP, the base case analysis assumed a lognormal distribution for chlorambucil + obinutuzumab and an exponential distribution for acalabrutinib monotherapy and acalabrutinib + obinutuzumab based on the lowest AIC/BIC values. For extrapolation of TTDeath, the exponential distribution was assumed for all comparators, also based on the lowest AIC/BIC values. presents the distribution parameters of models estimated and goodness-of-fit, and show these models overlaid with the Kaplan–Meier curves.
Figure 2. Parametric models overlaying the TTP Kaplan–Meier data for all comparators.
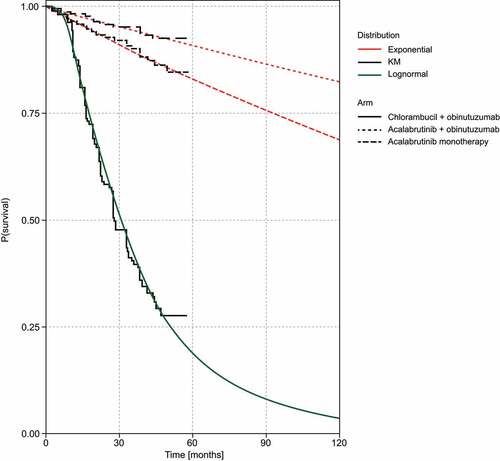
Figure 3. Parametric models overlaying the TTDeath Kaplan–Meier data for all comparators.
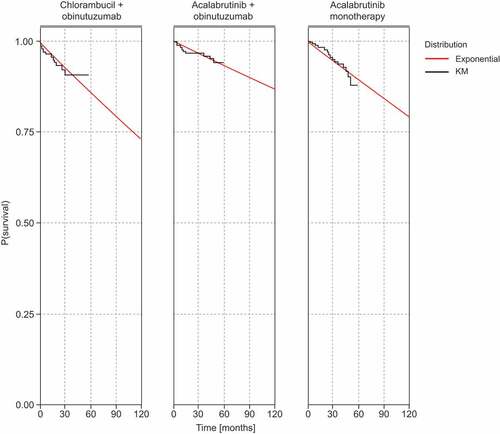
Table 1. Model parameters and goodness-of-fit indicators for the distributions of TTP, TTDeath, and PPS curves.
Transition probabilities governing transition from the PF state to the PD state were modeled from the derived TTP curves, and the transition from the PF state to the death state was modeled from the derived TTDeath curves. These transitions were modeled using competing risk equations because death pre-progression and disease progression are competing, mutually exclusive events. However, transitions to the death state were implemented such that the mortality risk of the modeled population could not be less than the mortality risk of the age- and gender-matched general population. Mortality risk for the general population was estimated from National Vital Statistics Reports 2020 (referred year 2018) and weighted by gender [Citation14].
Finally, because of the immaturity of the overall survival data from the ELEVATE-TN study [Citation8], the trial data from ELEVATE-TN and ASCEND (NCT02970318) [Citation15] were pooled to model PPS. ASCEND is a phase 3 study that demonstrated significant PFS benefit with acalabrutinib vs investigator’s choice of CIT (bendamustine + rituximab) or combination phosphoinositide 3-kinase inhibitor idelalisib + rituximab treatment in patients with relapsed/refractory (R/R) CLL [Citation15]. As a base case, post-progression patient-level data from the acalabrutinib monotherapy and acalabrutinib + obinutuzumab arms (pooled) from ELEVATE-TN and OS data from the CIT arm of the ASCEND trial were used to inform the acalabrutinib monotherapy and acalabrutinib + obinutuzumab PPS curves, and post-progression patient-level data from the chlorambucil + obinutuzumab arm from ELEVATE-TN and OS data from the acalabrutinib arm of the ASCEND trial were pooled to inform the chlorambucil + obinutuzumab PPS curve. Minimal difference was seen between patient characteristics of those with progressed disease from ELEVATE-TN and the baseline characteristics of patients in the ASCEND trial, which allowed for the pooling of these data. Based on clinical practice prevalent at the time of this assessment, we assumed that idelalisib + rituximab or bendamustine + rituximab (CIT) was administered after a patient has progressed on acalabrutinib ± obinutuzumab. We used the acalabrutinib OS data from ASCEND for patients who progressed on chlorambucil + obinutuzumab based on the assumption that efficacy benefits of acalabrutinib are equivalent to ibrutinib, which is the prevalent treatment option in R/R CLL. The PPS curves were also extrapolated beyond the ELEVATE-TN trial follow-up period to cover the time-horizon of the model by fitting parametric survival functions using an exponential distribution ().
The model accounts for the impact of all clinically relevant treatment-related grade ≥3 adverse events (AEs) that occurred in patients treated with the acalabrutinib regimens or the included trial comparator. AE incidence rates for acalabrutinib, acalabrutinib + obinutuzumab, and chlorambucil + obinutuzumab were sourced from the ELEVATE-TN trial () [Citation11,Citation16–19]. The statistical analyses were carried out using Sibyl software in R Studio.
Table 2. Parameters implemented in the model base case analysis.
2.4. Direct costs
The direct costs that were accounted for in the model were based on the US Medicare perspective. We considered direct medical costs as follows: drug acquisition, drug administration (only IV drugs), disease management, AEs, subsequent treatment, and terminal care. The costs of AE management were included as one-off costs in the first model cycle for the proportion of patients experiencing each AE. The total cost was calculated as the product of the AE incidence and its respective unit cost (Table S4). Drug monitoring costs were assumed to be negligible. Drug acquisition costs were applied until treatment discontinuation, determined by either the maximum treatment administrations or the observed time-to-treatment-discontinuation (TTD) curve. TTD was modeled as an independent curve assuming no clinical effect and used only to estimate the drug acquisition cost and the proportion of patients starting subsequent treatment in each model cycle. Based on expert input, we considered the following weights for subsequent treatments: CIT was assumed to be the most frequently used (80%), followed by a venetoclax + rituximab (20%), among patients treated with acalabrutinib-based therapy, and ibrutinib was assumed to be used for all patients treated with chlorambucil + obinutuzumab. These utilization weights were applied to the subsequent treatment cost (Tables S2–S3). Disease management costs were applied based on the resources used and proportion of patients in each health state (PF and PD). The cost of terminal care is applied at the cycle patients move to death, regardless of the health state in which death occurs.
For the purposes of this model, and given the median age of the patient population, we restricted the unit costs of disease management to the Medicare Fee-For-Service costs and did not consider separate scenarios for direct healthcare costs with Medicare Advantage or commercial plans. First-line drug acquisition (wholesale) costs were sourced from the Micromedex Red Book® (). Resource utilization and direct costs for disease management were sourced from relevant literature including the Healthcare Cost and Utilization Project [Citation20], the US Physicians Fee Schedule [Citation18], and previous health technology assessment submissions [Citation16,Citation21,Citation22] (Tables S2–S9). The terminal care direct costs were derived from a previous health technology assessment [Citation16].
Direct costs were inflated to the year 2021 using the consumer price index for medical care [Citation23]. In cases where the source cost was not available in US dollars (certain AE costs, indicated in Table S4, and terminal care costs), the cost was exchanged using the Purchasing Power Parity from the Organization for Economic Cooperation and Development [Citation24].
2.5. Utilities
Health state utility values (used to estimate QALYs) were applied to health states regardless of treatment arm (). Health state utility values from NICE TA 561 were used for PF and PD health states in the base case analysis because these were considered the most robust recent utilities for the target population [Citation16]. Disutility values (decrements) associated with AEs were implemented in the model (Table S10).
2.6. Sensitivity analysis
A deterministic one-way sensitivity analysis was conducted whereby, one at a time, all key model parameters were changed to a low value and a high value based on their 95% confidence intervals to test the sensitivity of the model results to changes in the parameters. Parameters were varied using ±20% of their base case values when 95% confidence intervals were unavailable. The impact on incremental cost, incremental QALYs, and the incremental cost-effectiveness ratio (ICER) was reported. A probabilistic sensitivity analysis (PSA) was also conducted whereby all model parameters were varied simultaneously across their statistical distributions. For the PSAs, the probability of being cost-effective was assessed at willingness-to-pay (WTP) thresholds of up to $500,000.
3. Results
3.1. Base case analysis
Compared with chlorambucil + obinutuzumab, acalabrutinib monotherapy was associated with an incremental cost of $206,329, incremental life-years (LYs) gained of 3.06, and incremental QALYs gained of 2.52, with a resulting ICER of $81,960/QALY. Compared with chlorambucil + obinutuzumab, acalabrutinib + obinutuzumab treatment was associated with an incremental cost of $423,747, incremental LYs gained of 3.23, and incremental QALYs gained of 2.79, with a resulting ICER of $152,153/QALY.
presents the incremental costs, QALYs, and cost-effectiveness ratio results for the base case comparisons.
Table 3. Incremental cost-effectiveness results from the base case analysis.
3.2. Sensitivity analysis
3.2.1. Deterministic sensitivity analyses
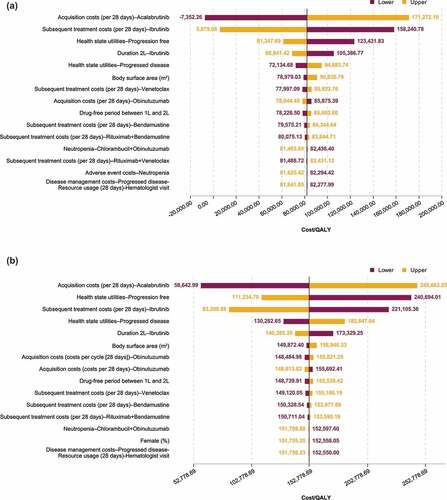
The results of the deterministic sensitivity analyses are shown in tornado diagrams (). The parameters that had the greatest impact on the ICERs were the acquisition costs of acalabrutinib, the cost of ibrutinib as subsequent treatment, and the PF health state utilities.
Figure 4. Deterministic sensitivity analyses: Tornado diagrams showing results for acalabrutinib monotherapy (a) and acalabrutinib + obinutuzumab (b) vs chlorambucil + obinutuzumab.
3.2.2. Probabilistic sensitivity analyses
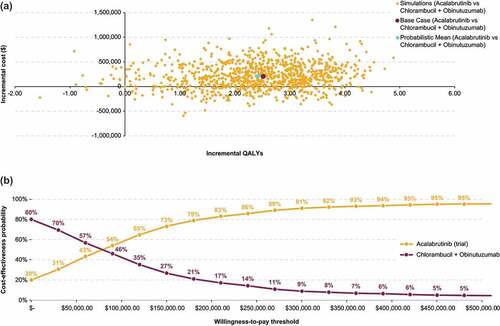
For acalabrutinib monotherapy, PSA (1000 iterations) showed a mean ICER of $87,195/QALY vs chlorambucil + obinutuzumab, which was comparable to the base case ICER. Thus, the probability of acalabrutinib monotherapy being cost-effective was approximately 59% at $100,000 and 73% at $150,000 WTP thresholds ().
Figure 5. Probabilistic sensitivity analysis results for acalabrutinib monotherapy vs chlorambucil + obinutuzumab: Cost-effectiveness plane (a) and cost-effectiveness acceptability curves (b).
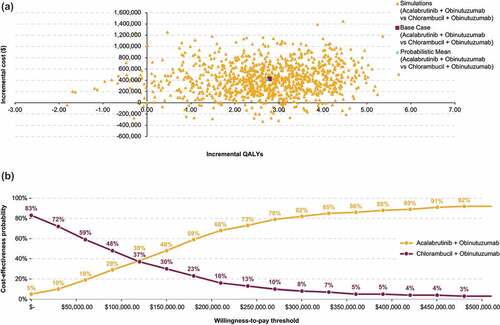
For acalabrutinib + obinutuzumab, PSA showed a mean ICER of $154,664/QALY vs chlorambucil + obinutuzumab, which was comparable to the base case ICER. The probability of acalabrutinib + obinutuzumab being cost-effective was approximately 34% at $100,000 and 51% at $150,000 WTP thresholds ().
Figure 6. Probabilistic sensitivity analysis results for acalabrutinib + obinutuzumab vs chlorambucil + obinutuzumab: Cost-effectiveness plane (a) and cost-effectiveness acceptability curves (b).
4. Discussion
This economic analysis provides the first report of the cost-effectiveness of acalabrutinib alone or in combination with obinutuzumab compared with a standard-of-care CIT regimen, chlorambucil + obinutuzumab, in patients with previously untreated CLL in the United States. The modeled population was based on the treatment-naive CLL patients (ITT population) from the ELEVATE-TN trial using data from a median follow-up of 46.9 months.
The results of our base case analyses demonstrated higher direct costs but substantial PFS and OS benefits with acalabrutinib regimens, resulting in considerable gains in QALYs compared with chlorambucil + obinutuzumab. Acalabrutinib monotherapy had an incremental cost of $81,960/QALY vs chlorambucil + obinutuzumab, which is below the commonly accepted WTP threshold range of $100,000–$150,000/QALY [Citation11]. The combination of acalabrutinib with obinutuzumab had an incremental cost of $152,153/QALY vs chlorambucil + obinutuzumab, which is slightly above the WTP threshold range of $100,000–$150,000/QALY.
The ELEVATE-TN trial is the first study to demonstrate the additional therapeutic value of adding an anti-CD20 antibody (obinutuzumab) to a BTK inhibitor (acalabrutinib) compared with acalabrutinib alone. At a median follow-up of 46.9 months in ELEVATE-TN, acalabrutinib + obinutuzumab offered a greater improvement in PFS (87% vs 78% for acalabrutinib monotherapy) and continues to provide numerically greater OS benefit (hazard ratio [HR] 0.50; P = 0.06 vs chlorambucil + obinutuzumab) relative to acalabrutinib monotherapy (HR 0.95; P = 0.92 vs chlorambucil + obinutuzumab). Given the deeper responses but higher rates of grade 3 and higher AEs, acalabrutinib + obinutuzumab could be reserved for a small subset of patients, such as those who are younger or who have bulky disease. However, we have not conducted a comparative clinical or economic assessment in this patient subset.
Deterministic sensitivity analysis revealed that the ICERs were sensitive to drug acquisition costs, utility values for PF and PD health states, and the costs associated with subsequent treatment. Exploring the combined uncertainty from all parameters simultaneously, the PSA showed that at a threshold of $100,000 per QALY, acalabrutinib monotherapy had a 59% probability of being cost-effective, at the higher threshold of $150,000, the probability of being cost-effective increases substantially to over 73%.
A key strength of our analysis is that the model inputs for efficacy and safety for the acalabrutinib arms and the comparator were derived from a direct comparison in the ELEVATE-TN trial using long-term follow-up data. Additionally, the analysis adopted a three-state semi-Markov model structure which was appropriate considering the trial data maturity, which is a function of both the treatment response to the BTK inhibitor treatments and the indolent nature of CLL.
Our analysis also had some limitations, particularly related to the trial data maturity. For example, long-term effectiveness of the treatments beyond the ELEVATE-TN trial period is inherently uncertain; therefore, it was necessary to make key model assumptions related to survival extrapolations beyond the trial period [Citation13]. Additionally, we used pooled ELEVATE-TN and ASCEND trial data to inform the PPS estimate. This was considered reasonable based on the use of OS data in the R/R setting (second-line) as a proxy for PPS. However, no adjustments in terms of patient characteristics or prognostic factors were made to the OS data from ASCEND despite the fact that the ASCEND trial included patients who received several prior treatments and, therefore, had a potentially worse survival prognosis than the patients who progressed in the ELEVATE-TN trial. In this regard, our model may underestimate the survival benefit and cost-effectiveness of acalabrutinib monotherapy and acalabrutinib + obinutuzumab in the ELEVATE-TN population. Using the post-progression clinical data from ASCEND to enable mapping of long-term outcomes in the model with more certainty than using immature ELEVATE-TN data was considered a reasonable trade-off given the limitations.
Because a US Medicare perspective was specified for this model, interpretation of this analysis is limited to the US perspective, particularly regarding the cost components. However, a similar model was developed from a UK perspective, using British costs and patient-level data similar to the current study [Citation25]. The results from that study found treatment with acalabrutinib monotherapy resulted in an incremental cost of £34,947 and incremental QALY gain of 1.14 compared with chlorambucil + obinutuzumab, resulting in an ICER of £30,701 per QALY gained, which is considered marginally cost-effective in a UK setting.
Additionally, a number of model parameter assumptions were made for AE disutility, duration, and direct cost estimates due to lack of data; however, the most conservative approach was taken whenever possible. For example, for cases in which no data were available for AE duration in the literature, estimates from clinical experts’ opinions on the expected duration were used and taken from NICE technical appraisals.
Finally, the modeled treatment comparisons were based on the comparators from the ELEVATE-TN trial, and these treatments may not reflect current clinical practice. For example, other treatments are recommended by guidelines and may be used in the first-line treatment setting, such as ibrutinib monotherapy or venetoclax, and additional lines of treatment after second-line therapy may be utilized for patients with progressive disease. We assumed that patients who progressed on acalabrutinib treatments were given idelalisib + rituximab or bendamustine + rituximab; any later lines of therapy with the B-cell lymphoma-2 inhibitor venetoclax were not considered. In addition, venetoclax use was not as prevalent for second-line treatment at the time of our analysis; therefore, the impact of venetoclax as a subsequent treatment option may have been underestimated in our analysis. Adding in other first-line comparators or additional subsequent lines of treatment would have required several assumptions and added further complexity to the model, possibly reducing the robustness of the analysis, which is based on a head-to-head clinical trial. The sensitivity analysis examined the impact of subsequent treatment cost and found that the ICER was sensitive to costs associated with subsequent treatment. Despite these limitations, the robustness of the model was demonstrated through the results of the PSA. Nonetheless, future studies are needed to assess the comparative effectiveness and cost-effectiveness of acalabrutinib monotherapy versus ibrutinib monotherapy.
In conclusion, using the commonly accepted WTP threshold range in the United States of $100,000–$150,000/QALY, acalabrutinib monotherapy at $81,960/QALY is cost-effective compared with chlorambucil + obinutuzumab in the first-line CLL setting; and acalabrutinib + obinutuzumab at $152,153/QALY is slightly above the WTP threshold range. As the number of treatments continues to grow for CLL, cost-effectiveness analysis can be a useful tool for understanding the value of treatments for patients and, therefore, may be helpful to healthcare providers involved in patient care and treatment selection. The results from our model may be utilized by US payers and decision-makers involved in CLL treatment selection, particularly in the US Medicare setting. The evidence and methods described here may also inform future economic analyses in CLL.
Declaration of interest
T Munir has served as a consultant to AstraZeneca, Janssen, AbbVie, MorphoSys, Alexion, and Roche and has received honoraria from AstraZeneca, Janssen, AbbVie, MorphoSys, Alexion, Roche, Sobi, Novartis, and Gilead. V Genovez is an employee of Amaris Consulting, which was contracted by AstraZeneca to perform this analysis. V Genestier is an employee of Amaris Consulting, which was contracted by AstraZeneca to perform this analysis. K Ryan is an employee and shareholder of AstraZeneca, which is the funder of this project. B Liljas is an employee and shareholder of AstraZeneca, which is the funder of this project. P Gaitonde is an employee and shareholder of AstraZeneca, which is the funder of this project. The authors have no other relevant affiliations or financial involvement with any organization or entity with a financial interest in or financial conflict with the subject matter or materials discussed in the manuscript apart from those disclosed.
Reviewer disclosures
Peer reviewers on this manuscript have no relevant financial or other relationships to disclose.
Author contributions
Study design: T Munir, P Gaitonde, B Liljas. Provided patients or study materials: P Gaitonde, K Ryan, B Liljas. Collection and assembly of data: T Munir. Data analysis: T Munir, V Genovez, V Genestier. Data interpretation: T Munir, P Gaitonde, V Genovez, V Genestier, B Liljas. Manuscript preparation: T Munir, P Gaitonde, B Liljas. All authors participated in the critical review and revision of this manuscript and provided approval of the manuscript for publication.
Data-sharing statement
Data underlying the findings described in this manuscript may be obtained in accordance with AstraZeneca’s data sharing policy described at https://astrazenecagrouptrials.pharmacm.com/ST/Submission/Disclosure. Data for studies directly listed on Vivli can be requested through Vivli at HYPERLINK ”http://www.vivli.org” www.vivli.org. Data for studies not listed on Vivli could be requested through Vivli at https://vivli.org/members/enquiries-about-studies-not-listed-on-the-vivli-platform/. AstraZeneca Vivli member page is also available outlining further details: https://vivli.org/ourmember/astrazeneca/.
Supplemental Material
Download MS Word (41.9 KB)Acknowledgments
Medical writing assistance, funded by AstraZeneca, was provided by Diana Arper, MSc, and Nicole Boyer, PhD, of Peloton Advantage, LLC, an OPEN Health company, under the direction of the authors. The authors thank Catherine Waweru and Parexel for their contributions to the development of the initial model and the Amaris team for model adaptation.
Supplementary material
Supplemental data for this article can be accessed online at https://doi.org/10.1080/14737167.2023.2196408
Additional information
Funding
References
- American Cancer Society. What is chronic lymphocytic leukemia? 2018. Available at: https://www.cancer.org/cancer/chronic-lymphocytic-leukemia/about/what-is-cll.html. Accessed: Nov 17, 2022.
- American Society of Clinical Oncology. Leukemia - chronic lymphocytic - CLL: statistics. 2021. Available at: https://www.cancer.net/cancer-types/leukemia-chronic-lymphocytic-cll/statistics. Accessed: Nov 17, 2022.
- Goyal RK, Nagar SP, Kabadi SM, et al. Overall survival, adverse events, and economic burden in patients with chronic lymphocytic leukemia receiving systemic therapy: real-world evidence from the medicare population. Cancer Med. 2021;10(8):2690–2702. DOI:10.1002/cam4.3855.
- Woyach JA, Ruppert AS, Heerema NA, et al. Ibrutinib regimens versus chemoimmunotherapy in older patients with untreated CLL. N Engl J Med. 2018;379(26):2517–2528. DOI:10.1056/NEJMoa1812836.
- National Cancer Institute. SEER cancer stat facts: leukemia - chronic lymphocytic leukemia. 2022. Available at: https://seer.cancer.gov/statfacts/html/clyl.html. Accessed: Nov 17, 2022.
- Calquence [package insert]. Wilmington DE;AstraZeneca Pharmaceuticals. Aug 2022.
- Sharman JP, Egyed M, Jurczak W, et al. Acalabrutinib with or without obinutuzumab versus chlorambucil and obinutuzmab for treatment-naive chronic lymphocytic leukaemia (ELEVATE TN): a randomised, controlled, phase 3 trial. Lancet. 2020;395(10232):1278–1291. DOI:10.1016/S0140-6736(20)30262-2.
- Sharman JP, Egyed M, Jurczak W, et al. Efficacy and safety in a 4-year follow-up of the ELEVATE-TN study comparing acalabrutinib with or without obinutuzumab versus obinutuzumab plus chlorambucil in treatment-naïve chronic lymphocytic leukemia. Leukemia. 2022;36:1171–1175.
- Smare C, Lakhdari K, Doan J, et al. Evaluating partitioned survival and Markov decision-analytic modeling approaches for use in cost-effectiveness analysis: estimating and comparing survival outcomes. Pharmacoeconomics. 2020;38(1):97–108. DOI:10.1007/s40273-019-00845-x.
- Carta A, Conversano C. On the use of Markov models in pharmacoeconomics: pros and cons and implications for policy makers. Front Public Health. 2020;8:569500.
- Institute for Clinical and Economic Review. ICER’s reference case for economic evaluations: principles and rationale. 2020. Available at: https://icer.org/wp-content/uploads/2020/10/ICER_Reference_Case_013120.pdf. Accessed: Nov 17, 2022.
- Ghia P, Pluta A, Wach M, et al. ASCEND: phase III, randomized trial of acalabrutinib versus idelalisib plus rituximab or bendamustine plus rituximab in relapsed or refractory chronic lymphocytic leukemia. J Clin Oncol. 2020;38(25):2849–2861. DOI:10.1200/JCO.19.03355.
- Latimer N NICE DSU technical support document 14. Survival analysis for economic evaluations alongside clinical trials – extrapolation with patient-level data Sheffield: NICE decision support Unit; 2013 [updated Mar 2013;Aug 3, 2020]. Available at: http://nicedsu.org.uk/wp-content/uploads/2016/03/NICE-DSU-TSD-Survival-analysis.updated-March-2013.v2.pdf. Accessed: Nov 17, 2022.
- Arias E, Xu J. United States Life Tables, 2018. Natl Vital Stat Rep. 2020;69:1–45.
- Jurczak W, Pluta A, Wach M, et al. Three-year follow-up of the ASCEND trial: acalabrutinib vs rituximab plus idelalisib or bendamustine in relapsed/refractory chronic lymphocytic leukemia [abstract]. Blood. 2021;138(Supplement 1):393. DOI:10.1182/blood-2021-146570.
- National Institute for Health and Care Excellence. Venetoclax with rituximab for previously treated chronic lymphocytic leukaemia. 2019. Available at: www.nice.org.uk/guidance/ta561. Accessed: Nov 17, 2022.
- IBM Micromedex RED BOOK: iBM Watson Health; 2022 [Jul 8, 2022]. Available at: https://www.ibm.com/products/micromedex-red-book. Accessed: Nov 17, 2022.
- Centers for Medicare and Medicaid Services. Search the Physician Fee Schedule. 2022. Available at: https://www.cms.gov/medicare/physician-fee-schedule/search. Accessed: Nov 17, 2022.
- Davids MS, Emeribe U, Cai L, et al., editors. Matching-adjusted indirect treatment comparison (MAIC) of acalabrutinib alone or in combination with obinutuzumab versus ibrutinib or venetoclax plus obinutuzumab in patients with treatment-naive chronic lymphocytic leukemia [poster]. Annual Meeting and Exposition of the American Society of Hematology; Dec 11-14, 2021; Atlanta, GA.
- Agency for Healthcare Research and Quality. Healthcare cost and utilization project. 2022. Available at: https://hcupnet.ahrq.gov/#setup. Accessed: Nov 17, 2022.
- National Institute for Health and Care Excellence. Ramucirumab for previously treated locally advanced or metastatic non-small-cell lung cancer. 2016. Available at: https://www.nice.org.uk/guidance/ta403. Accessed: Nov 17, 2022.
- National Institute for Health and Care Excellence. Chronic obstructive pulmonary disease in over 16s: diagnosis and management. 2019. Available at: www.nice.org.uk/guidance/ng115. Accessed: Nov 17, 2022.
- Health Resources & Services Administration. Consumer Price Index (CPI) for medical care. 2021. Available at: https://www.hrsa.gov/get-health-care/affordable/hill-burton/cpi.html. Accessed: Nov 17, 2022.
- Organisation for Economic Co-operation and Development. Prices and purchasing power parities (PPP). 2022. Available at: https://www.oecd.org/sdd/prices-ppp/. Accessed: Nov 17, 2022.
- Munir T, Gaitonde P, Waweru C. Cost-effectiveness of acalabrutinib monotherapy compared with chlorambucil plus obinutuzumab for previously untreated chronic lymphocytic leukemia [abstract]. Blood. 2020;136(suppl Supplement 1):13–14.