
 ?Mathematical formulae have been encoded as MathML and are displayed in this HTML version using MathJax in order to improve their display. Uncheck the box to turn MathJax off. This feature requires Javascript. Click on a formula to zoom.
ABSTRACT
Objectives
The current study aimed to map the disease-specific Schizophrenia Quality of Life Scale (SQLS) onto the three- and five-level EuroQol five-dimension (EQ-5D-3 L and EQ-5D-5 L), Health Utility Index Mark 3 (HUI3) and Short Form six-dimensional (SF-6D) preference-based instruments to inform future cost-utility analyses for treatment of patients with schizophrenia.
Methods
Data from 251 outpatients with schizophrenia spectrum disorders was included for analysis. Ordinary least square (OLS), Tobit and beta regression mixture models were employed to estimate the utility scores. Three regression models with a total of 66 specifications were determined by goodness of fit and predictive indices. Distribution of the original data to the distributions of the data generated using the preferred estimated models were then compared.
Results
EQ-5D-3 L and EQ-5D-5 L were best predicted by the OLS model, including SQLS domain scores, domain-squared scores, age, and gender as explanatory predictors. The models produced the best performance index and resembled most closely with the observed EQ-5D data. HUI3 and SF-6D were best predicted by the OLS and Tobit model respectively.
Conclusion
The current study developed mapping models for converting SQLS scores into generic utility scores, which can be used for economic evaluation among patients with schizophrenia.
1. Introduction
Schizophrenia is a severe mental illness that affects over 20 million people globally and is ranked among the leading causes of disease-related disability worldwide according to the Global Burden of Disease Study 2017 [Citation1]. Despite its low prevalence, the associated health, social and economic burden has been tremendous for both the patients and their caregivers, as well as the wider society. A systematic review showed that the annual cost estimates for schizophrenia range from US$94 million to US$102 billion across countries, which translated into 0.02% to 5.46% of gross domestic product [Citation2]. Symptoms of schizophrenia typically include positive symptoms (e.g. hallucination, delusions and disordered thinking), negative symptoms (e.g. emotional blunting, reduced motivation, social withdrawal, self-neglect, and paucity of speech) and cognitive impairment [Citation3]. The disorder is characterized by a chronic, relapsing course with typically incomplete remission, significant functional and social impairment, multiple comorbidities and increased risk of premature mortality [Citation4].
Schizophrenia has consistently been shown to have a major negative impact on the quality of life (QoL) [Citation5–7], and the concept of QoL has thus been recognized as a key outcome of schizophrenia treatment. Scales developed by clinicians and researchers to assess the QoL due to the disorder initially focused on measuring the disease-specific symptoms. Studies looking at the relationship between QoL and core symptoms of schizophrenia have found positive and negative symptoms, as well as depression and anxiety to be related to lower QoL [Citation6–8]. The use of generic QoL instruments has become increasingly important for clinical practice in the 21st century as the goal of recovery for schizophrenia patients has shifted from focusing on disorder-specific symptoms alone to improving broader and more functional outcomes [Citation9]. Disease-specific measures of QoL are known to have the advantage of being more clinically useful in informing case management as they are more sensitive and therefore are useful in tracking subtle treatment response over time and are better able to discriminate severity levels [Citation10,Citation11]. On the other hand, generic measures of QoL generally assess the physical, social and emotional dimensions of health and have the advantage of enabling comparisons of QoL deficits and treatment benefit across different types of diseases. Studies comparing disease-specific and generic QoL measures among individuals with schizophrenia tend to report differences in the determinants of the two types of measures [Citation12,Citation13].
In order to determine whether current or new intervention strategies are effective and represent an efficient use of scarce resources, there is a growing need for assessment of health interventions to be based on cost-utility analysis (CUA). The CUA is often based on generic health-related QoL measures, such as the EuroQoL Five Dimension (EQ-5D), Utilities Index Mark (HUI3) and Short Form-36 version (SF-36), so as to allow healthcare policy makers to consider all interventions on a common scale and allocate appropriate resources for patient care [Citation14,Citation15]. These instruments have been widely adopted for economic evaluation to calculate quality-adjusted life years (QALY) in the CUA. Despite the role of generic QoL measures in decision making, disease-specific measures continue to be assessed as primary end points in clinical trials in preference to the direct use of generic measures. Therefore, it is necessary to establish an accurate and reliable method for converting treatment effects demonstrated by disease-specific measures into treatment effect estimates of generic measures. This technique is called ‘mapping’ or ‘crosswalk,’ and it can produce statistical formula or functions that allow a disease-specific scale to predict utility scores and provides an alternative solution to generate QALY for CEA and CUA in clinical studies [Citation14,Citation16].
An essential feature of a schizophrenia-specific QoL instrument is the inclusion of life domains highly relevant to individuals with schizophrenia instead of being designed primarily to address symptom severity [Citation17]. One such measure is the Schizophrenia Quality of Life Scale (SQLS), a brief self-report that requires only 10–15 minutes to complete and is widely used in clinical settings with translated versions in various languages; generated from in-depth patient interviews and with incorporation of patients’ perspective [Citation18]. Further, the SQLS has been identified as one of the most utilized disease-specific measure in studies on QoL assessment in patients with schizophrenia [Citation8].
Singapore is a multi-ethnic and multi-cultural Asian society with a resident population of about 4 million people belonging to Chinese, Malay, Indian, and other ethnicities. According to the Singapore Mental Health Study 2016, the estimated lifetime prevalence of schizophrenia and other psychotic disorders was 2.3% [Citation19]. The mean age of onset for schizophrenia spectrum disorders was 23.1 years and about 80.4% of them had consulted a doctor or a mental health professionals for their symptoms [Citation19]. The objective of the current study was therefore to map the SQLS onto commonly used generic scales such as EQ-5D, HUI3 and SF-36 to inform future cost-utility analyses for the treatment of schizophrenia in Singapore
2. Material and methods
2.1. Sample
A total of 251 participants were recruited between August 2016 to June 2017 from the outpatient clinics of the Institute of Mental Health (IMH), the only tertiary psychiatric hospital in Singapore. This cross-sectional study employed a convenient sampling strategy to recruit patients with psychosis being treated at the IMH. In order to inform patients about the ongoing study and provide information on eligibility requirements, study posters were placed in the clinics. Inclusion criteria were being 21–65 years of age; able to provide consent; literate in English (main language in Singapore) and having been clinically diagnosed with a schizophrenia spectrum disorder by the consulting psychiatrists. Patients with a history of dementia or intellectual disability were excluded. All participants gave their informed consent and received an inconvenience fee after completing the questionnaires. The study was approved by the institutional ethics committee, the Domain Specific Review Board of National Healthcare Group, Singapore.
2.2. Measures
The Schizophrenia Quality of Life Scale (SQLS) was administered to measure disease-specific, subjective functioning and well-being of patients with schizophrenia [Citation18]. This questionnaire comprises 30 items with five response options: ‘never,’ ‘rarely,’ ‘sometimes,’ ‘often,’ and ‘always,’ and includes three dimensions: ‘psychosocial’ (fifteen items) which addresses various emotional problems such as feeling lonely, depressed or worried about the future; ‘motivation/energy’ (seven items) which addresses various problems of motivation and activity, such as lacking the will to do things; and finally ‘symptoms/side effects’ (eight items) which addresses issues such as sleep disturbance, blurred vision, dizziness, muscle twitches, unsteady walking, shaking/trembling and dry mouth, which can be caused by medication. The scores of each domain are scaled to a scoring algorithm ranging from 0 to 100, with higher scores indicating worse perceived QOL. The SQLS total score was tabulated by averaging the sum of the three domain scores. A confirmatory factor analysis of the SQLS was performed among an outpatient sample with schizophrenia in Singapore and it demonstrated the validity of assessing QOL under 3 domains: psychosocial (fifteen items), motivation/energy (seven items) and symptoms/side effects (eight items). The Cronbach’s alpha (α) values were higher than or close to the cutoff value of 0.7 for the psychosocial (α = 0.93), symptoms/side effects (α = 0.56) and energy/motivation (α = 0.82) scales, suggesting satisfactory reliability [Citation20].
The EuroQoL-5-Dimension (EQ-5D-) is a generic QoL self-report questionnaire introduced by the EuroQol Group to describe and value health [Citation21]. The three-level version (EQ-5D-3 L) is the original version and it comprises five health dimensions (mobility, selfcare, usual activities, pain/discomfort and anxiety/depression) with three levels (‘no problems’ [level 1], ‘some problems’ [level 2], and ‘extreme problems’ [level 3]), resulting in a total of 243 (35) health states. The value set assigns each health state (with 11,111 and 33,333 representing full health and worst health) a single societal preference-based index score to indicate its utility and this score typically ranges from 0 (death) to 1 (complete health) [Citation21]. To improve the instrument’s sensitivity and to reduce ceiling effects, a five-level version- the EQ-5D-5 L has been developed and it expands the EQ-5D classification system by adding two more response options in each dimension: no problems, slight problems, moderate problems, severe problems and extreme problems, with a total of 3125 (55) health states [Citation22]. The current study used two versions of the EQ-5D, the EQ-5D-5 L and the EQ-5D-3 L. Only the EQ-5D-3 L value set is available in Singapore. The utility scores of EQ-5D-5 L were derived using the UK value set estimated with a crosswalk project that maps EQ-5D-5 L utility scores from the EQ-5D-3 L [Citation23]. In other words, the utility scores of the 5 L health state were computed by summing the utility scores of the 3 L health states weighted by the transition probability from the 3 L state to the 5 L state. EQ-5D has been found to be responsive to improvement and corresponded well to objective ratings of remission in patients with first-episode psychosis in Singapore [Citation24].
The Health Utility Index Mark 3 (HUI3) is a generic QoL measure that describes the respondent’s health status based on eight attributes of functioning: vision, hearing, speech, ambulation, dexterity, emotion, cognition and pain [Citation25]. HUI3 overall utility score was derived with the HUI3’s Dead – Perfect Health Scale formula; u* = 1.371 × (b1 × b2 × b3 × b4 × b5 × b6 × b7 × b8) − 0.371), where b1 to b8 corresponds to the multi-attribute utility scores of the eight physical domains of functioning. HUI3’s overall utility scores range from −0.36 to 1, with 0 being defined as dead, negative scores indicating conditions worse than dead and 1 reflecting a state of perfect health [Citation26]. The construct validity of the HUI3 has been established among patients with schizophrenia in Singapore [Citation27].
The 36-item Short-Form Survey (SF-36) is a generic, patient-reported measure that is used to generate a six-dimensional health state classification known as the SF-6D that covers six dimensions including physical functioning, role limitation, social functioning, pain, mental functioning, and vitality [Citation28]. Each dimension has four to six response levels and the SF-6D system defines 18,000 health states in total with a utility score ranging from 0.00 to 1.00. The SF-6D utility scores were obtained using a UK value set estimated from a SF-6D utility scoring algorithm derived from a representative sample of the UK general population using the Standard Gamble method [Citation28]. In a study that compared the reliability and validity of SF-6D, ED-5D and HUI3 utility measures in patients with schizophrenia in Singapore, the SF-6D was found to have higher test-retest validity, convergent validity with SQLS domain scores, known-group validity and magnitude of change in scores over 6-month follow up than other measures [Citation29].
2.3. Modelling techniques
The most common regression technique used in the literature for mapping between QoL measures has been the Ordinary Least Square (OLS), which assumes that the relationship between the two variables can be expressed as a linear function of the parameters [Citation30]. The psychometric or utility measures used for measuring generic QoL in this study are continuous variables bounded at both ends of the distribution, and may therefore be highly skewed or subject to a ceiling effect. OLS models are typically able to predict mean scores but may be poorer in analyzing such health utility data that often shows an apparent truncation effect, where a significant proportion of individuals achieve the upper bound of full health (i.e. at 1) [Citation31,Citation32]. The use of the Tobit model has therefore been proposed as an alternative method to account for the upper and lower limits of such indices so predictions are limited to the credible range [Citation33]. A regression method that is also gaining increasing attention in the analysis of doubly bounded outcome measures is the beta regression mixture model (‘betamix’ command) [Citation34]. The betamix model is a two-part model that incorporates a multinomial logit model and a beta mixture model in their algorithms, with studies revealing this regression method to outperform linear regression model [Citation35–37]. The multinomial logit model deals with the data at the boundaries and a mass of observations at full health and the mixture of beta distributions capture multimodality of the QoL data. The OLS, Tobit, and betamix regression models were therefore employed and compared to estimate utility scores of the EQ-5D, HUI3 and SF-6D from SQLS in the current study.
2.4. Model specification
The mapping models were developed using either the SQLS total score or the alternative form with three dimension scores as the explanatory variables [Citation18]. Covariates such as age and gender, as well as squared terms for estimating quadratic effects were also tested for inclusion. In order to explore the best performance of the prediction model, a total of six different model specifications were therefore examined in each regression method. Model 1 included only SQLS total score as a main predictor of the utility score; Model 2 included psychosocial, energy/motivation, symptoms/side effects domain scores; Model 3 included SQLS total score, age and gender; Model 4 included psychosocial, energy/motivation, symptoms/side effects domain scores, age and gender; Model 5 included SQLS total score, SQLS-squared, age and gender; and Model 6 included psychosocial, energy/motivation, symptoms/side effects domain scores, psychosocial-squared, energy/motivation-squared, symptoms/side effects-squared, age and gender. For the beta mixture regression model, we further estimated different model specifications with different number of components (starting with a one component model which is equivalent to the beta regression model), with and without inclusion of the gap between full health and the next feasible value, and with and without probability masses at full health and truncation point of the scale distribution [Citation38]. Three regression methods with a total of 66 specifications were therefore tested for predicting each of the utility scale.
2.5. Assessment of model performance
Preferred models were determined using various fit statistics. To assess the goodness of fit of the above specifications within each class, we used the Akaike and Bayesian information criteria (AIC and BIC), where a smaller value indicates a better model fit. The predictive ability of models was assessed based on the mean error (ME), mean absolute error (MAE) and the root mean square error (RMSE). The MAE is the mean of absolute differences between the observed and predicted utility scores, whist the RMSE is the squared root of the mean of squared differences between the observed and predicted utility scores. The R-squared was also used to estimate the variance of the utility score that is explained by the model. While each of these criteria may support different models, higher priority is given to model with relatively lower ME, MAE, and RMSE values, higher R-squared value, and has similarity of summary statistics between observed and simulated data sets predicted by the model from each regression method. All models were estimated in Stata software version 15 (StataCorp LP, College Station, TX).
3. Results
3.1. Descriptive statistics
Responses from 251 participants were included for the analysis with no missing data. provides the descriptive statistics of the sample. Participants were mostly male (56.2%) and had a mean (SD) age of 39.9 (10.2) years, ranging from 21 to 62 years. The EQ-5D-3 L showed a mean index score of 0.771 (0.308) with minimum (min.) and maximum (max.) scores of −0.568 and 1 while that of EQ-5D-5 L index was 0.812 (0.222) with min. and maxi. scores of −0.367 and 1, respectively. The ceiling effect of both EQ-5D-3 L and EQ-5D-5 L were 43.3% and 36.5%, respectively. The mean of HUI3 index score was 0.647 (0.312) with min. and maxi. scores of −0.151 and 1, while that of SF-6D was 0.680 (0.137) with min. and max. scores of 0.383 and 1, respectively. An inspection of the distribution of the EQ-5D-3 L, EQ-5D-5 L and HUI3 utilities showed a skew substantially to the right (left-skewed), that is, toward full health or a better quality of life (). The mean (SD) of SQLS total score was 32.6 (17.7) with min. and max. scores of 0 and 83.0, respectively.
Figure 1. Distribution of generic utility scores.
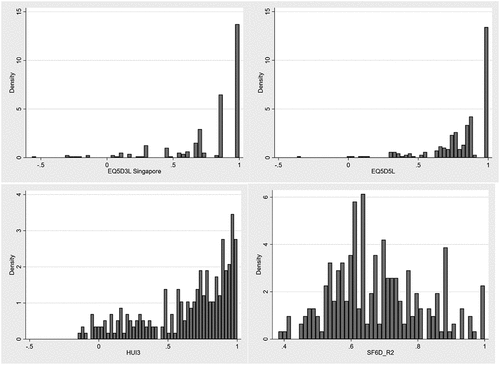
Table 1. Characteristics of the sample (N = 251).
3.2. Selection of preferred models for each mapping
In each mapping model, we selected one of the most preferred models for final selection. For mapping SQLS to EQ-5D-3 L utility scores, the OLS model consisting of the SQLS domain scores, domain-squared scores, age and gender as predictors (OLS6), the Tobit model consisting of SQLS domain scores, age and gender as predictors (Tobit4) and the Beta-mixture model with two components, inclusion of gap between full health and the next feasible point, probability mass at full health [Citation1], and consisting of the SQLS domain scores, domain scores-squared, age and gender as predictors (BetamixM6e) were initially selected as the preferred models (see Table S1a). For mapping SQLS to EQ-5D-5 L utility scores, OLS6, Tobit6 and BetamixM6d were the preferred models (see Table S1b). For mapping SQLS to HUI3 utility scores, OLS5, Tobit5 and BetamixM1h were selected (see Table S1c) and finally, OLS5, Tobit5 and BetamixM1d were the preferred models for mapping SQLS to SF6D (see Table S1d).
3.3. Selection of the final predictive model
provide information on the various fit statistics of the preferred models for each of the generic scales. provides the summary statistics of the observed and simulated data sets predicted by the best model from each regression method. Among the three preferred models, the OLS6 was the most parsimonious prediction model for the EQ-5D-3 L data (). Even though the distribution of the simulated data showed that the BetamixM6e model resemble most closely to the observed EQ-5D-3 L data, the OLS6 produced the lowest RMSE and highest R-squared value compared to the BetamixM6e. The OLS6 was the most parsimonious prediction model for the EQ-5D-5 L. It produced the smallest RMSE values, the highest R-squared value, and resemble the second most closely to the observed EQ-5D-5 L data. The OLS5 was the most parsimonious prediction model for the HUI3. It produced the smallest RMSE value, the highest R-squared value and resemble more closely to the observed HUI3 data. The Tobit5 model was the most parsimonious prediction model as it resembles more closely to the observed SF-6D data.
Table 2. Prediction performance of the preferred model within each class of models.
Table 3. Summary statistics of the observed and simulated data sets predicted by the best model from each regression method.
In the optimal model for mapping SQLS to EQ-5D-3 L (i.e. OLS6), SQLS-squared scores and age were negatively associated with EQ-5D-3 L’s utility scores (see Table S2a).
In the optimal model for mapping SQLS to EQ-5D-5 L (i.e. OLS6), SQLS psychosocial and motivation domain scores were positively while motivation-squared scores, symptoms-squared scores and age were negatively associated with EQ-5D-5 L’s utility scores (see Table S2b).
In the optimal model for mapping SQLS to HUI3 (i.e. OLS5), SQLS-squared scores were positively associated with HUI3 utility scores (see Table S2c) whereas in the optimal model for mapping SQLS to SF-6D (i.e. Tobit5), SQLS total scores were negatively while SQLS-squared scores were positively associated with SF-6D utility scores (see Table S2d).
4. Discussion
This analysis is one of the few that has mapped a disease-specific scale to a generic health-related QoL scale among individuals with schizophrenia. Other studies have mainly used the Positive and Negative Syndrome Scale (PANSS), an instrument for symptom severity assessment to predict common utility scores [Citation39–41]. In this study, three different regression models (OLS, Tobit and betamix) with a total of 66 specifications were explored to develop mapping functions for SQLS. Our findings supported the view that different predictive models should be used for estimating different health utilities in our sample of outpatients with schizophrenia. To our knowledge, this study is the first to map the SQLS onto the EQ-5D, HUI3 and SF-6D.
To use the mapping functions from our final models, the predicted EQ-5D-3 L, EQ-5D-5 L, HUI3 and SF-6D utilities can be calculated using the following mapping functions:
Given the nature of the utility values, we suggest the predicted utility values should be capped at 1 using the function below if the predicted utility values exceed 1:
i.e., if predicted EQ-5D-5 L, HUI3 or SF-6D utilities = > 1 then the utility value = 1.
Our mapping algorithm for EQ-5D-3 L was best predicted using the OLS. Other studies have reported that EQ-5D utility scores were best predicted by the beta mixture regression method [Citation35–37]. One study has found that beta-based mixture models tend to fit more closely to HUI3 data, which typically require more components in the mixture models due to its uneven distribution [Citation36]. Meanwhile, another study revealed that the beta mixture regression method seemed to predict the observed EQ-5D scores well [Citation38].
We found that although the distribution of the simulated data showed that the beta mixture regression model closely resembled the observed EQ-5D-3 L data, the OLS produced the lowest RMSE and highest R-squared values compared to the beta mixture regression model. In light of this, we suggest that the OLS was the most parsimonious prediction model for the EQ-5D-5 L. We found that the model including SQLS domain scores (observed and squared), as well as age and gender (i.e. model 6) attained the best fit. Individual subscale or domain scores should therefore be used to estimate health utility scores when possible instead of SQLS total scores. Other studies that estimated utility scores from clinical questionnaires in schizophrenia have also found age and gender to be key predictors of utility measures [Citation39,Citation41]. Not all the predictors or covariates achieved statistical significance in the respective selected models. It is, however, important to note that the primary intention of the study is to construct a mapping function that best predicts EQ-5D-3 L, ED-5D-5 L, HUI3 and SF-6D utility indexes from SQLS, and thus the statistical significance of the regression coefficients should be of secondary consideration [Citation42]. The performance of the regression model based on goodness of fit and predictive ability should be the first consideration.
The study had several limitations that needs to be acknowledged. Firstly, our sample size is small with only 251 participants. More complex models such as the beta mixture regression technique may be more effective in examining censored distribution of the utilities only when the sample size is sufficiently large [Citation15,Citation43]. A larger sample would also lead to increased statistical power and improved precision in estimating parameters. Secondly, we did not validate our results on part of the data set given that the splitting of sample for this purpose is not recommended by the International Society for Pharmacoeconomics and Outcome Research good practice report on mapping [Citation44]. The generalizability of the algorithms in another independent dataset should therefore be assessed when such datasets are available. Thirdly, due to the fact that the recruitment process was based on a convenient sampling including referrals from doctors and nurses, no systematic data collection was conducted to determine the reasons influencing a patient’s refusal to take part in the study. As a result, we were unable to evaluate the potential for selection bias in our sample. Lastly, we have only explored age and gender as the predictors to reduce complexity of the model in this study. Other factors such as household income, marital status (socio-demographics) and smoking and drinking status (lifestyle habits) may also be important for consideration, particular for schizophrenia populations. Measurement errors in the predictors is, no doubt, a potential problem in mapping models and future work should be undertaken to determine the most optimal predictors.
5. Conclusions
This study aimed to map SQLS domain scores into common health utility scores generated by EQ-5D, HUI3 and SF-6D. Our results show that more complex model specifications such as the beta mixture models may not outperform traditionally used linear predictions such as the OLS models or even Tobit models in estimating utility indexes and thus, further research on the usability of these models in mapping studies is warranted. While it is preferred to use utilities directly derived from the generic instruments, the developed algorithms allow clinicians and researchers to obtain reliable utility estimates from disease-specific instruments in future economic evaluations of health care interventions and quality-adjusted life-year analyses for patients with schizophrenia.
Declaration of interest
The authors have no other relevant affiliations or financial involvement with any organization or entity with a financial interest in or financial conflict with the subject matter or materials discussed in the manuscript apart from those disclosed.
Reviewer disclosures
Peer reviewers on this manuscript have no relevant financial or other relationships to disclose
Author contributions
L Seow wrote the first draft of the article. J Lau and E Abdin conducted the statistical analysis for the paper, and assisted in writing the first draft. E Abdin, S Verma, K Tan and M Subramaniam contributed to the conceptualization of the study and provided intellectual input on the article. All authors have approved the final manuscript for publication.
Ethics approval
The authors assert that all procedures contributing to this work comply with the ethical standards of the relevant national and institutional committees on human experimentation and with the Helsinki Declaration 1975, as revised in 2008. Ethics approval for the study was obtained from the National Healthcare Group’s Domain Specific Review Board.
Consent to participate
Written informed consent was obtained from all participants.
Supplemental Material
Download MS Word (42.7 KB)Data availability statement
The datasets used and/or analyzed during the current study are available from the corresponding author on reasonable request.
Supplementary material
Supplemental data for this article can be accessed online at https://doi.org/10.1080/14737167.2023.2215430.
Additional information
Funding
References
- James SL, Abate D, Abate KH, et al. Global, regional, and national incidence, prevalence, and years lived with disability for 354 diseases and injuries for 195 countries and territories, 1990–2017: a systematic analysis for the global burden of disease study 2017. Lancet. 2018;392(10159):1789–1858. DOI:10.1016/S0140-6736(18)32279-7
- Chong HY, Teoh SL, DB-C W, et al. Global economic burden of schizophrenia: a systematic review. Neuropsychiatr Dis Treat. 2016;12:357–373.
- Picchioni MM, Murray RM. Schizophrenia. BMJ. 2007;335(7610):91–95.
- Tandon R, Nasrallah HA, Schizophrenia KM. “Just the facts” 4. Clinical features and conceptualization. Schizophr Res. 2009;110(1–3):1–23.
- Bobes J, Garcia-Portilla MP, Bascaran MT, et al. Quality of life in schizophrenic patients. Dialogues Clin Neurosci. 2007;9(2):215–226. DOI:10.31887/DCNS.2007.9.2/jbobes
- Eack SM, Newhill CE. Psychiatric symptoms and quality of life in schizophrenia: a meta-analysis. Schizophr Bull. 2007;33(5):1225–1237.
- de Pinho LMG, Pereira AMS, Chaves CMCB, et al. Quality of life scale and symptomatology of schizophrenic patients – a systematic review. Eur J Psych. 2018;32(1):1–10.
- Karow A, Wittmann L, Schöttle D, et al. The assessment of quality of life in clinical practice in patients with schizophrenia. Dialogues Clin Neurosci. 2014;16(2):185–195. DOI:10.31887/DCNS.2014.16.2/akarow
- Liberman RP, Kopelowicz A. Recovery from schizophrenia: a challenge for the 21st century. Int Rev Psychiatry. 2002;14(4):245–255.
- Wiebe S, Guyatt G, Weaver B, et al. Comparative responsiveness of generic and specific quality-of-life instruments. J Clinical Epidemiol. 2003;56(1):52–60. DOI:10.1016/S0895-4356(02)00537-1
- Rajagopalan K, Abetz L, Mertzanis P, et al. Comparing The discriminative validity of two generic and one disease-specific health-related quality of life measures in a sample of patients with dry eye. Value Health. 2005;8(2):168–174. DOI:10.1111/j.1524-4733.2005.03074.x
- Zeng Y, Zhou Y, Lin J, et al. Generic and disease-specific quality of life and its predictors among Chinese inpatients with schizophrenia. Psychiatry Res. 2015;228(3):724–728.
- Seow LSE, Tan THG, Abdin E, et al. Comparing disease-specific and generic quality of life measures in patients with schizophrenia. Psychiatry Res. 2019;273:387–393.
- Brazier J, Connell J, Papaioannou D, et al. A systematic review, psychometric analysis and qualitative assessment of generic preference-based measures of health in mental health populations and the estimation of mapping functions from widely used specific measures. Health Technol Assess. 2014;18(34):1–188. (Winchester, England). doi: 10.3310/hta18340.
- Longworth L, Yang Y, Young T, et al. Use of generic and condition-specific measures of health-related quality of life in NICE decision-making: a systematic review, statistical modelling and survey. Health Technol Assess. 2014;18(9):1–224. (Winchester, England). DOI:10.3310/hta18090. .
- Brazier JE, Yang Y, Tsuchiya A, et al. A review of studies mapping (or cross walking) non-preference based measures of health to generic preference-based measures. Eur J Health Econ. 2010;11(2):215–225.
- McKenna SP. Measuring quality of life in schizophrenia. Eur Psychiatry. 1997;12(3):267s–274s.
- Wilkinson G, Hesdon B, Wild D, et al. Self-report quality of life measure for people with schizophrenia: the SQLS. Br J Psychiatry. 2000;177:42–46.
- Subramaniam M, Abdin E, Vaingankar JA, et al. Lifetime prevalence and correlates of schizophrenia and other psychotic disorders in Singapore. Front Psychiatry. 2021;12:650674.
- Luo N, Seng B-K, Xie F, et al. Psychometric evaluation of the Schizophrenia Quality of Life Scale (SQLS) in English- and Chinese-speaking Asians in Singapore. Qual Life Res. 2008;17(1):115–122.
- Rabin R, de Charro F. EQ-5D: a measure of health status from the EuroQol Group. Ann Med. 2001;33(5):337–343.
- EuroQol Group. EQ-5D-5L user guide: basic information on how to use the EQ-5D-5L instrument. 2014. Available from: http://www.euroqol.org/fileadmin/user_upload/Documenten/PDF/Folders_Flyers/UserGuide_EQ-5D-5L.pdf. [Accessed Nov 10, 2020].
- van Hout B, Janssen MF, Feng YS, et al. Interim scoring for the EQ-5D-5L: mapping the EQ-5D-5L to EQ-5D-3L value sets. Value Health. 2012;15(5):708–715. DOI:10.1016/j.jval.2012.02.008
- Subramaniam M, Abdin E, Poon LY, et al. EQ-5D as a measure of programme outcome: results from the Singapore early psychosis intervention programme. Psychiatry Res. 2014;215(1):46–51. DOI:10.1016/j.psychres.2013.10.002
- Feeny D, Furlong W, Torrance GW, et al. Multiattribute and single-attribute utility functions for the health utilities index mark 3 system. Med care. 2002;40(2):113–128. DOI:10.1097/00005650-200202000-00006
- Horsman J, Furlong W, Feeny D, et al. The Health Utilities Index (HUI®): concepts, measurement properties and applications. Health Qual Life Outcomes. 2003;1(1):54.
- Luo N, Seng BK, Thumboo J, et al. A study of the construct validity of the Health Utilities Index Mark 3 (HUI3) in patients with schizophrenia. Quality of life research: an international journal of quality of life aspects of treatment, care and rehabilitation. Qual Life Res. 2006;15(5):889–898. DOI:10.1007/s11136-005-5745-8
- Brazier J, Roberts J, Deverill M. The estimation of a preference-based measure of health from the SF-36. J Health Econ. 2002;21(2):271–292.
- Abdin E, Chong SA, Seow E, et al. A comparison of the reliability and validity of SF-6D, EQ-5D and HUI3 utility measures in patients with schizophrenia and patients with depression in Singapore. Psychiatry Res. 2019;274:400–408.
- Mukuria C, Rowen D, Harnan S, et al. An updated systematic review of studies mapping (or cross-walking) measures of health-related quality of life to generic preference-based measures to generate utility values. Appl Health Econ Health Pol. 2019;17(3):295–313. DOI:10.1007/s40258-019-00467-6
- Pullenayegum EM, Tarride JE, Xie F, et al. Analysis of health utility data when some subjects attain the upper bound of 1: are Tobit and CLAD models appropriate? Value Health. 2010;13(4):487–494. DOI:10.1111/j.1524-4733.2010.00695.x
- Basu A, Manca A. Regression estimators for generic health-related quality of life and quality-adjusted life years. Med Decis Making. 2012;32(1):56–69.
- Austin PC. A comparison of methods for analyzing health-related quality-of-life measures. Value Health. 2002;5(4):329–337.
- Gray LA, Alava MH. A command for fitting mixture regression models for bounded dependent variables using the beta distribution. Stata J. 2018;18(1):51–75.
- Gray LA, Wailoo AJ, Hernandez Alava M. Mapping the FACT-B Instrument to EQ-5D-3L in patients with breast cancer using adjusted limited dependent variable mixture models versus response mapping. Value Health. 2018;21(12):1399–1405.
- Gray LA, Hernández Alava M, Wailoo AJ. Development Of methods for the mapping of utilities using mixture models: mapping the AQLQ-S to the EQ-5D-5L and the HUI3 in patients with asthma. Value Health. 2018;21(6):748–757.
- Kiadaliri A, Alava MH, Roos EM, et al. Mapping EQ-5D-3L from the Knee Injury and Osteoarthritis Outcome Score (KOOS). Quality of Life Research. 2020;29(1):265–274.
- Yang F, Wong CKH, Luo N, et al. Mapping the kidney disease quality of life 36-item short form survey (KDQOL-36) to the EQ-5D-3L and the EQ-5D-5L in patients undergoing dialysis. Eur J Health Econ. 2019;20(8):1195–1206. DOI:10.1007/s10198-019-01088-5
- Abdin E, Chong SA, Seow E, et al. Mapping the positive and negative syndrome scale scores to EQ-5D-5L and SF-6D utility scores in patients with schizophrenia. Quality of life research: an international journal of quality of life aspects of treatment, care and rehabilitation. 2019;28(1):177–186. DOI:10.1007/s11136-018-2037-7.
- Lenert LA, Rupnow MFT, Elnitsky C. Application of a disease-specific mapping function to estimate utility gains with effective treatment of schizophrenia. Health Qual Life Outcomes. 2005;3(1):57.
- Siani C, de Peretti C, Millier A, et al. Predictive models to estimate utility from clinical questionnaires in schizophrenia: findings from EuroSC. Quality of Life Research. 2016;25(4):925.
- Cheung YB, Luo N, Ng R, et al. Mapping the functional assessment of cancer therapy-breast (FACT-B) to the 5-level EuroQoL Group’s 5-dimension questionnaire (EQ-5D-5L) utility index in a multi-ethnic Asian population. Health Qual Life Outcomes. 2014;12(1):180.
- Dakin H. Review of studies mapping from quality of life or clinical measures to EQ-5D: an online database. Health Qual Life Outcomes. 2013;11(1):151.
- Wailoo AJ, Hernandez-Alava M, Manca A, et al. Mapping to Estimate Health-State Utility from Non–Preference-Based Outcome Measures: an ISPOR Good Practices for Outcomes Research Task Force Report. Value Health. 2017;20(1):18–27. DOI:10.1016/j.jval.2016.11.006