
ABSTRACT
Background
This post hoc analysis aimed to estimate eptinezumab’s therapeutic effect on health utilities and determined to which extent monthly migraine days (MMDs) explain changes in health utilities.
Research Design/Methods
DELIVER, a randomized, double-blind, placebo-controlled phase 3b trial (NCT04418765), investigated eptinezumab efficacy and safety in patients with 2-4 prior migraine treatment failures. Regression analysis explored the relationship between utility scores and MMDs, with eptinezumab treatment as a covariate along with MMDs to identify any MMD-independent effect on utilities. Path analysis quantified eptinezumab’s impact as mediated through MMD reduction.
Results
The base case model showed that each reduction in MMD was associated with a mean utility score increase (0.0189; 95% CI: 0.0180, 0.0198; P < 0.001). Mean utility score was generally higher for eptinezumab versus placebo, justifying addition of treatment effect to the base case model. Patients administered eptinezumab had on average 0.0562 (95% CI: 0.0382, 0.0742; P < 0.001) higher utility versus placebo when controlling for number of MMDs. From path analysis, MMD reduction resulting from eptinezumab treatment accounted for 53% additional utility gain observed in patients.
Conclusions
Changes in MMDs alone inadequately captured migraine’s impact on patient utility, as there was also a positive eptinezumab-driven, treatment-specific impact on utility score.
Trial Registration
The trial is registered at ClinicalTrials.gov (CT.gov identifier: NCT04418765).
1. Introduction
Migraine is a common disease characterized by recurrent attacks of moderate to severe headache and other symptoms, such as nausea, vomiting, sensitivity to light, and sensitivity to sound, which can contribute to an overall disabling condition [Citation1]. It is associated with comorbidities such as psychiatric disease and sleep disturbances and cardiovascular functioning, ultimately affecting a person’s health-related quality of life (HRQoL) [Citation2]. Utility scores are metrics for quantifying preferences for different health states, can be compared across diseases, and can help quantify clinically meaningful changes depending on the possible outcomes of the disease being examined (1.00 corresponds to perfect health; 0.00, dead) [Citation3]. Quality-adjusted life years (QALYs), computed by multiplying health utility scores by the time lived in a health state [Citation4], are particularly relevant for decision making regarding the value and use of new treatments [Citation5,Citation6]. For generating health utilities for cost-utility analysis, the most widely used preference-based generic measure of health is the EQ-5D, which includes a health state classification system with five dimensions and either three levels (EQ-5D-3L) or the descriptively richer five-level version (EQ-5D-5L) [Citation7,Citation8]. In cost-utility analysis, which is a type of economic evaluation, a ratio of incremental cost to QALY gains associated with treatment (versus a comparator) is used to inform decisions about adoption of innovative therapies.
There are several systems for classifying health states and obtaining utility estimates that can subsequently be used for health economic evaluations [Citation9]. The EQ-5D system describes health status during the day the questionnaire is administered (i.e. health today) [Citation10,Citation11]. This limits the usefulness of the scale for a disorder such as migraine, which is defined by recurring acute events that can be heterogeneous; thus, large fluctuations in health utility may depend on whether the patient is experiencing an event on the day the questionnaire is filled out. Notably, migraine-specific patient-reported outcomes, such as the Migraine-Specific Quality of Life Questionnaire (MSQ), have longer recall periods and potentially more disease-relevant content, and thus may provide a more accurate representation of the HRQoL in migraine over a longer time period [Citation12,Citation13]. Although the MSQ was not designed as a health utility measure, it is possible to derive utility scores from the MSQ using previously published algorithms that mapped the MSQ onto EQ-5D–derived utility scores [Citation14,Citation15].
Over the last several years, estimates of the HRQoL gained with eptinezumab, an anti-calcitonin gene-related peptide (anti-CGRP) administered intravenously for the preventive treatment of migraine, have focused on migraine frequency, such as monthly migraine days (MMDs). Eptinezumab is recommended by European Headache Federation guidelines as a preventive for the treatment of episodic and chronic migraine [Citation16]. In DELIVER – a randomized, double-blind, placebo-controlled study of eptinezumab in patients with unsuccessful past experiences with migraine treatment attempts – eptinezumab met the primary efficacy endpoint, which was the change from baseline in MMDs over weeks 1-12 compared to placebo [Citation17,Citation18]. While changes in MMDs are still used as clinical endpoints, studies have increasingly focused on measures of migraine severity or burden, such as assessments of changes to a patient’s most bothersome migraine-associated symptom (self-identified or not self-identified) [Citation19,Citation20], to assess the effectiveness and impact of migraine treatment. Difficult-to-treat migraine populations, which are more resistant to reductions in MMDs, can still demonstrate improvements in HRQoL [Citation17,Citation21,Citation22], but these improvements may be better understood from the perspective of severity assessments that can examine multiple drivers of treatment effectiveness.
The overall goal of this post hoc analysis was to understand the drivers of utility score improvements, and in turn HRQoL improvements, experienced by patients with migraine treated with eptinezumab, using data from the DELIVER clinical trial. The relationship between the estimated utility scores and MMDs was determined, and it was determined whether the incremental utility gain of eptinezumab relative to placebo was explained by factors other than MMDs alone.
2. Patients and methods
2.1. Data sources
DELIVER was a multinational, randomized, double-blind, placebo-controlled phase 3b trial (NCT04418765) that investigated the safety and efficacy of eptinezumab treatment in patients with a migraine diagnosis (according to the International Headache Society criteria [Citation1]) and documented evidence of 2-4 prior preventive treatment failures [Citation17]. Patients across 96 trial locations in the United States (n = 3) and Europe (n = 93) had documented histories of preventive migraine treatment failures over 10 years, involving medications such as topiramate, amitriptyline, flunarizine, propranolol, metoprolol, valproate, candesartan, and botulinum toxin A (Supplementary Table S1). The primary efficacy endpoint was the change from baseline in MMDs over weeks 1-12 [Citation17]. In previous work, DELIVER demonstrated that reductions in both MMDs and severity of migraine contribute to the overall treatment effect of eptinezumab, which may be closely linked to improvements in HRQoL [Citation17]. During the study, scores from the MSQ (Version 2.1) instrument were captured for three time points and used in this post hoc analysis: at week 0 (baseline), week 12, and week 24.
2.2. MSQ and its mapping algorithms
A migraine-specific measure of HRQoL, the MSQ consists of 14 questions describing three domain scores (Role Function-Restrictive, Role Function-Preventive, and Emotional Function) affected by migraine, and respondents answered questions based on their experiences with migraine over the previous 4-week period [Citation23]. Each item is scored from 1 (none of the time) to 6 (all of the time). All domain scores are added and then transformed to a 0-100 scale, with higher scores indicating a better HRQoL. MSQ scores from DELIVER were mapped to EQ-5D-3L utilities (UK valuation set) using previously published mapping algorithms with low root mean square error values, indicative of a suitable model for describing utility scores of migraine [Citation14].
Two versions of the mapping algorithm were utilized (Model 1 and Model 2), along with a third model sensitive to variations in patients’ migraine status over time (Model 3). Model 1, the base case model, used MSQ scores from DELIVER as the only variable from which to map utilities (Supplementary Table S2). Model 2, an extension of Model 1, used MSQ as well as other covariates from DELIVER data to map utility values (Supplementary Tables S3 and S4) [Citation14]. Covariates in Model 2 included age, sex, race (white vs. other), current work status (full- or part-time), current use of headache medication, and comorbidities (pain disorders, vascular disorders, psychiatric disorders, or other disorders).
In the published algorithm, Models 1 and 2 as described above each consisted of two different formulas [Citation14] based on migraine classification (episodic migraine [EM]/chronic migraine [CM] status) at baseline. Formula 1 was applied to patients with EM and Formula 2 was assigned to patients with CM. In this work, for Models 1 and 2 the formula applied to each patient was determined in alignment with the published algorithm, with EM and CM defined by the number of MMDs reported during the baseline period only. Hence, the formula used to derive utilities remained the same across study visits, but the utilities were calculated for each visit for each patient by using the number of migraine days in the previous 4-week period. This approach was consistent with previous anti-CGRP evaluations by the National Institute for Health and Care Excellence (NICE) [Citation24]. A sensitivity analysis of Model 1 (presented in this work as Model 3, with treatment effect [3a], without treatment effect [3b], and with pooled treatment effect [3c]) was conducted since the trajectory of improvement with effective therapies suggests that some patients can switch from experiencing CM to EM over time (Supplementary Table S4) [Citation25]. In Model 3, the current migraine status at each study visit was used to select which model (EM or CM) was appropriate (i.e. EM/CM status was allowed to vary over time), based on the number of MMDs in the previous 4-week period, to allow the utility formula to change for each patient at each visit. Using these three mapping models, we evaluated the relationship between the estimated utilities and MMDs, including no treatment effect (Models 1a, 2a, 3a), an effect by treatment arm (Models 1b, 2b, 3b), and a pooled treatment effect (Models 1c, 2c, and 3c).
All study visits during the double-blind phase of DELIVER up to week 24 were included in the mapping procedure.
2.3. Statistical analysis
MSQ scores from DELIVER were converted into EQ-5D-3L utilities using the Gillard et al. algorithms (Models 1, 2, and 3) [Citation14]. Each individual could have measurements at different timepoints. Therefore, a linear mixed model with number of MMDs as a predictor variable and MSQ-derived utility as the dependent (outcome) variable (from Model 1a, the baseline assumption, or also called the base case) was conducted on DELIVER data to quantify the relationship between utility scores and MMDs. This analysis was done again, but with interaction between eptinezumab treatment (split by both eptinezumab 100 mg and eptinezumab 300 mg as well as pooled eptinezumab), and MMDs considered, to identify if treatment has any additional influence on utilities.
Several model specifications for the relationship between utilities and MMDs were explored to find the best-fit model (Supplementary Table S5), such as a quadratic MMD term, 1-knot or 2-knot splines, a 1-degree polynomial term, and a 2-degree polynomial term. Best-fit evaluation was based on Akaike Information Criterion (AIC) and Bayesian Information Criterion (BIC), with lower AIC and BIC indicating better model fit while accounting for the number of parameters in the model.
To estimate the robustness of the results of Models 1a (no treatment effect), 1b (treatment effect by arm), and 1c (pooled treatment effect), the base case and base case with treatment effect were replicated with the subgroup of patients with three or more prior treatment failures. Additionally, the base case model was run separately for EM and CM to determine if pooling the EM and CM patient populations was justified in the main analyses. After analyzing the link between utilities, treatment, and MMD, the overall effect of eptinezumab on utilities was analyzed using a mixed model for repeated measures to account for missing data. The analysis included a comparison of eptinezumab patients who experienced a 50% reduction in MMD over weeks 1–12.
2.4. Path analysis
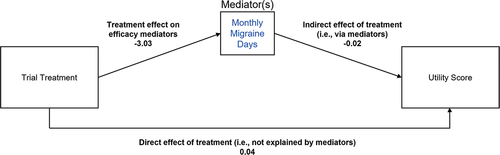
Path analysis is an extension of regression modeling, allowing for more complex models with multiple outcomes and chains of relationships between variables [Citation26]. In path analysis, variables are distinguished as endogenous (influenced by other variables in the analysis) or exogenous (not influenced by other variables). The analysis can reveal how much of the variability of endogenous variables are explained, directly and indirectly, by other variables in the system. An exploratory path analysis aimed to identify the proportion of eptinezumab’s impact on health utility scores originating from the reduction in MMDs versus originating from the direct treatment effect, i.e. not explained by MMD reduction (). Analyses were conducted on the average change from baseline in MMDs and average change from baseline in utilities for all study visits during the double-blind period of DELIVER (weeks 1-24). In the path analysis, the effect on change in health utilities is divided into a direct treatment effect and an indirect effect mediated by MMD reduction. The direct effect is the coefficient of the regression of change in utilities versus the eptinezumab indicator. The indirect effect is the product of coefficient of the regression of change in MMD versus the eptinezumab indicator and the coefficient of change in utilities versus change in MMD. The total effect is the sum of the direct and indirect effects. The percentage of utility improvement for eptinezumab patients that is explained by MMD reduction is the ratio of indirect effect to total effect. No adjustment was made for missing values.
Figure 1. Directed acyclic graph showing measured variables and paths.
2.5. Software
Analyses were conducted using R software (Version 4.1.2). The lme4 package was used for linear mixed models, the nlme package was used for mixed model for repeated measures, and the lavaan package was used for path analyses.
3. Results
The base case model for the relationship between utility scores and MMDs is presented in , which shows the results of the linear mixed model plotted along with the average utility scores calculated for every given MMD value in DELIVER. As linear models were used in NICE submissions, and since fit with other models only marginally improved AIC and BIC statistics when treatment was incorporated into the model (Supplementary Table S5), only coefficients for linear models are reported in this analysis. For every point lower MMDs, the mean utility score was 0.0189 higher (MSQ, 95% confidence interval [CI]: 0.0180, 0.0198; p < 0.001), as described by the slope of the trend line of Model 1a (). The intercept (0.7938, 95% CI: 0.7815, 0.8061) represents the mean utility score for patients not experiencing any MMDs. After the inclusion of covariates to map utility values from MSQ, yielding Model 2a, the impact of MMDs on utility scores slightly decreased to −0.0130 (MSQ, 95% CI: −0.0137, −0.0124; p < 0.001) (Supplementary Table S4). Conversely, estimating utility scores based on the EM/CM status at each patient visit rather than at baseline slightly increased the impact of MMDs on utility scores to −0.0213 (MSQ, 95% CI: −0.0222, −0.0205; p < 0.001), as shown in Model 3a (Supplementary Table S4). The coefficients for MMDs were consistent between patients who failed ≥ 2 (all patients) and ≥ 3 therapies and were also consistent between patients irrespective of their EM/CM status (Supplementary Table S4).
Figure 2. Mean utilities associated with monthly migraine days (base case model, Model 1a).*
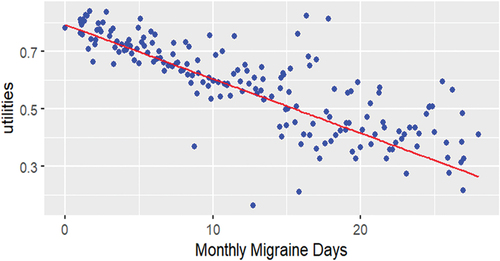
Table 1. Estimates of health utilities in relation to monthly migraine days, mapped from MSQ with no covariates (Model 1), with and without a specific treatment effect.
For all but one MMD level, the mean utility score was higher for the eptinezumab treatment arm compared to the placebo arm (Supplementary Figure S1), thus the inclusion of the treatment effect, which was statistically significant, improved model fit. A substantial eptinezumab treatment effect relative to placebo was observed (in addition to the base case reduction in MMDs), as shown with Model 1c: patients administered eptinezumab treatment have, on average, 0.0562 higher utility score (95% CI: 0.0382, 0.0742) than do patients receiving placebo when controlling for number of MMDs (); thus, a driver for utility score improvement beyond reduction in MMDs alone was observed. These results were also consistent across eptinezumab 100 mg (0.0553 [MSQ, 95% CI: 0.0346, 0.0760]) and eptinezumab 300 mg (0.0571 [MSQ, 95% CI: 0.0363, 0.0780]).
As a result, patients treated with eptinezumab experienced a noticeable improvement in utility scores over time compared to patients receiving placebo throughout weeks 1-24 of DELIVER (). In a pooled analysis, a mean change of 0.17 points relative to baseline (standard error [SE]: 0.010) was observed with eptinezumab compared to placebo. A similar improvement in utility scores was observed with both doses (100 mg: 0.171 [SE: 0.011]; 300 mg: 0.178 [SE: 0.011]). This amounted to a 0.09 mean utility gain for all patients treated with eptinezumab compared to patients who received placebo, as well as a 0.15 mean utility score gain for 50% migraine responders over weeks 1-12 ().
Table 2. Change from baseline in utility scores for patients treated with eptinezumab or placebo for weeks 1-24, estimated using Model 1.
Finally, path analysis was conducted to identify the extent to which the impact of eptinezumab on utility scores was mediated through different measures of treatment efficacy, such as MMDs and migraine severity (). Path analysis indicated that the reduction in MMDs resulting from eptinezumab treatment (i.e. the indirect effect) accounted for approximately 53% of the additional utility gain observed in eptinezumab patients relative to placebo patients. The remaining 47% was attributed to the direct effect of eptinezumab on utility scores.
Table 3. Path analysis for the effect of treatment on MSQ-derived utility scores.
4. Discussion
This investigation provided evidence that changes in MMDs alone do not adequately capture the impact of migraine on the utility if they are treated with eptinezumab, which has a significant positive impact on utilities. A linear relationship between MMDs and utilities is an acceptable model when treatment effect is incorporated (the BIC difference between the best model and the linear model with treatment effect was only marginal). Having established that an eptinezumab treatment effect can be added to the base-case regression model evaluating the relationship between MMDs and utility scores, it follows that patients treated with eptinezumab have a better HRQoL (as measured by utility scores) compared to patients receiving placebo, even after controlling for the number of MMDs. These results are externally validated when comparisons are made to previously published results on erenumab [Citation27]. Critically, from path analysis, the reduction in MMDs only explains half of the score improvement seen with eptinezumab treatment. There are two current pathways to increased utility scores. In the first route, utility scores can increase via a higher reduction in MMDs (e.g. the primary endpoint of DELIVER). In the second route, utility scores can increase via MMDs as well as aspects of HRQOL not captured by MMDs where eptinezumab also has a stronger effect than placebo.
Since a treatment-specific utility impact exists in addition to reduction in MMDs, the implication is that current MMD measures (such as the primary endpoint in DELIVER) underestimate the HRQoL gained with eptinezumab treatment. Underestimations have been observed in previous studies of migraine treatments, where only 20% of the improvement in HIT-6 and MSQ scores could be explained by the reduction in headache days [Citation28]. Eptinezumab utility gains are higher than what would be expected based on reductions in MMDs seen in DELIVER. The 47% attributed to the direct effect of eptinezumab on utility scores may be explained by other measures of efficacy in migraine (e.g. improvement in most bothersome symptom, nausea, vomiting, etc.), which will be explored in future work. It is important to ask what is driving this additional improvement of HRQoL with eptinezumab besides reduction in MMDs, as currently most economic models for migraine are based on clinical trials that use health status measures, such as a change in MMDs, that lack preference weights and therefore do not provide values for cost-utility analyses [Citation14]. Additional symptoms and aspects of HRQoL may need to be incorporated into the outcomes of interest for cost-effectiveness models to fully capture a drug’s effect on patients’ lives. Going forward, we suggest that changes in MMDs are examined in tandem with path analysis of measures such as PI-MBS, to get a full picture of the impact of migraine treatments on patient HRQoL.
4.1. Limitations and additional research
There are some limitations that define the scope of this analysis. The 1-day recall period of the EQ-5D makes it less applicable to diseases such as migraine for which symptoms may change dramatically from day to day. We therefore applied a mapping algorithm based on the MSQ to estimate EQ-5D utilities rather than estimating utilities through direct assessment. Similar considerations can be relevant for other disease states with fluctuating symptoms, for example as in some neurological disorders (e.g. Parkinson’s disease [Citation29]) and psychiatric illnesses [Citation30]. Another example is diseases with rare events [Citation31].
Disease-specific measures such as the MSQ instrument are thought to have better discriminative and evaluative properties compared to generic measures for disease-specific applications. Several studies have demonstrated that memory bias is intrinsic when recalling retrospective, complex information such as pain [Citation32,Citation33]. If utility scores rely on MSQ mapping, which in turn relies on a patient’s ability to recall migraine experiences as far back as 4 weeks, scores may not be an entirely accurate representation of patients’ experiences with pain. However, the robustness of the models presented in this work was demonstrated using a subgroup analysis of patients with a history of severe, difficult-to-treat migraine (e.g. 3 or more prior treatment failures) – patients likely to also have a complex history with pain and other migraine-related symptoms. We found consistency between patient groups with some variation in their migraine severity. Further work is needed to fully understand the impact of severity on utility scores. Additionally, this work showed that the substantial treatment effect of eptinezumab cannot be explained by reductions in MMDs alone. Other canonical symptoms, or perhaps patients’ most bothersome symptom, may correlate with HRQoL and should be validated as additional drivers of utility scores in future clinical work.
5. Conclusions
Patients treated with eptinezumab in the DELIVER study had a higher utility score (i.e. HRQoL) than those receiving placebo during weeks 1-24, but this was only partially driven by the larger reduction in MMDs after eptinezumab treatment; there is also a treatment-specific utility score impact. In summary, the improvements in utility scores after eptinezumab treatment experienced by patients with migraine and 2–4 prior preventive treatment failures go beyond reduction in MMDs, reflecting that improvements in frequency-based migraine days assessments in isolation are not sufficient to fully capture the benefits of eptinezumab treatment.
Abbreviations
| AIC | = | Akaike Information Criterion |
| anti-CGRP | = | anti-calcitonin gene-related peptide |
| BIC | = | Bayesian Information Criterion |
| CI | = | confidence interval |
| CM | = | chronic migraine |
| EM | = | episodic migraine |
| HRQoL | = | health-related quality of life |
| MMDs | = | monthly migraine days |
| MSQ | = | Migraine-Specific Quality of Life Questionnaire |
| NICE | = | National Institute for Health and Care Excellence |
| QALYs | = | quality-adjusted life years |
| SE | = | standard error |
Declaration of interest
L Jönsson has received consultancy fees from H. Lundbeck A/S, Copenhagen, Denmark. S Regnier owns stock or stock options in Novartis. S Regnier, S Kymes, S Awad, B Talon, and X Lee are employees of H. Lundbeck A/S, Copenhagen, Denmark. P Goadsby reports, over the last 36 months, a grant from Celgene, and personal fees from Aeon Biopharma, Allergan/AbbVie, CoolTech LLC, Dr Reddy’s, Eli Lilly, Epalex, Impel Neuropharma, Lundbeck, Novartis, Pfizer, Praxis, Sanofi, Satsuma, Shiratronics, Teva Pharmaceuticals and Tremeau. He also reports personal fees for advice through Gerson Lehrman Group, Guidepoint, SAI Med Partners, and Vector Metric; fees for educational materials from CME Outfitters, and WebMD; publishing royalties or fees from Massachusetts Medical Society, Oxford University Press, UpToDate, and Wolters Kluwer; fees for medicolegal advice in headache; and a patent for magnetic stimulation for headache (No. WO2016090333 A1) assigned to eNeura without fee. The authors have no other relevant affiliations or financial involvement with any organization or entity with a financial interest in or financial conflict with the subject matter or materials discussed in the manuscript apart from those disclosed.
Reviewer disclosures
One peer reviewer is currently employed at Lundbeck. Peer reviewers on this manuscript have no other relevant financial relationships or otherwise to disclose.
Author contributions
Concept and design: L Jönsson, S Regnier, S Kymes, X Lee, P Goadsby
Acquisition of data: L Jönsson, S Regnier, S Kymes, X Lee, P Goadsby
Analysis and interpretation of data: L Jönsson, S Regnier, S Kymes, S Awad, B Talon, X Lee, P Goadsby
Drafting of the manuscript: S Regnier, S Kymes, S Awad, B Talon, X Lee, P Goadsby
Critical revision of the paper for important intellectual content: L Jönsson, S Regnier, S Kymes, S Awad, B Talon, X Lee, P Goadsby
Obtaining funding: S Regnier, S Kymes, S Awad, B Talon, X Lee, P Goadsby
Administrative, technical, or logistic support: S Regnier, S Kymes, S Awad, B Talon, X Lee, P Goadsby
Supervision: S Regnier, S Kymes, S Awad, B Talon, X Lee, P Goadsby
All authors agreed for the final version of the manuscript to be published.
Ethics statement
The placebo-controlled period of DELIVER was done in accordance with standards of Good Clinical Practice as defined by the International Conference on Harmonisation and all applicable federal and local regulations, as is the ongoing extension. At each site, all study documentation was approved by the local review board or by a central institutional review board or ethics committee. All patients provided written informed consent before participation in the study. The DELIVER study is registered on ClinicalTrials.gov, NCT04418765, and EudraCT, 2019–004497–25.
Role of the funder/sponsor
The sponsor participated in the design and conduct of the study; data collection, management, analysis, and interpretation; and preparation, review, and approval of the manuscript. All authors and H. Lundbeck A/S prepared, reviewed, and approved the manuscript and made the decision to submit the manuscript for publication.
Data sharing statement
In accordance with EFPIA’s and PhRMA’s ‘Principles for Responsible Clinical Trial Data Sharing’ guidelines, Lundbeck is committed to responsible sharing of clinical trial data in a manner that is consistent with safeguarding the privacy of patients, respecting the integrity of national regulatory systems, and protecting the intellectual property of the sponsor. The protection of intellectual property ensures continued research and innovation in the pharmaceutical industry. Deidentified data are available to those whose request has been reviewed and approved through an application submitted to https://www.lundbeck.com/global/our-science/clinical-data-sharing.
Supplemental Material
Download MS Word (186.5 KB)Acknowledgments
The authors thank Simon Pickard, PhD, for his contributions to the study design. The authors also thank Jessica A. Weaver, PhD, and Nicole Coolbaugh, CMPP, of The Medicine Group, LLC (New Hope, PA, USA) for providing medical writing support in accordance with Good Publication Practice guidelines. Support was funded by H. Lundbeck A/S.
Supplementary Material
Supplemental data for this article can be accessed online at https://doi.org/10.1080/14737167.2023.2219898
Additional information
Funding
References
- Headache Classification Committee of the International Headache Society (IHS). The international classification of headache disorders, 3rd edition. Cephalalgia. 2018 Jan;38(1):1–211. DOI:10.1177/0333102417738202
- Burch RC, Buse DC, Lipton RB. Migraine: epidemiology, burden, and comorbidity. Neurol Clinics. 2019;37(4):631–649.
- Torrance GW, Feeny D. Utilities and quality-adjusted life years. Int J Technol Assess Health Care. 1989;5(4):559–575.
- Prieto L, Sacristán JA. Problems and solutions in calculating quality-adjusted life years (QALYs). Health Qual Life Outcomes. 2003;1:80.
- Kind P, Lafata JE, Matuszewski K, et al. The use of QALYs in clinical and patient decision-making: issues and prospects. Value Health. 2009;12 Suppl 1:S27–30.
- Brown JS, Neumann PJ, Papadopoulos G, et al. Migraine frequency and health utilities: findings from a multisite survey. Value Health. 2008;11(2):315–321. DOI:10.1111/j.1524-4733.2007.00246.x
- Brazier J, Connell J, Papaioannou D, et al. A systematic review, psychometric analysis and qualitative assessment of generic preference-based measures of health in mental health populations and the estimation of mapping functions from widely used specific measures. Health Technol Assess. 2014;18:1–180.
- van Hout BA, Shaw J. Mapping EQ-5D-3L to EQ-5D-5L. Value Health. 2021;24(9):1285–1293.
- Johnston KM, L’Italien G, Popoff E, et al. Mapping migraine-specific quality of life to health state utilities in patients receiving rimegepant. Adv Ther. 2021;38(10):5209–5220. DOI:10.1007/s12325-021-01897-2
- Rabin R, de Charro F. EQ-5D: a measure of health status from the EuroQol Group. Ann Med. 2001;33(5):337–343.
- Tassorelli C, Diener HC, Dodick DW, et al. Guidelines of the international headache society for controlled trials of preventive treatment of chronic migraine in adults. Cephalalgia. 2018;38(5):815–832. DOI:10.1177/0333102418758283
- Diener HC, Tassorelli C, Dodick DW, et al. Guidelines of the international headache society for controlled trials of preventive treatment of migraine attacks in episodic migraine in adults. Cephalalgia. 2020;40(10):1026–1044. DOI:10.1177/0333102420941839
- Bagley CL, Rendas-Baum R, Maglinte GA, et al. Validating migraine-specific quality of life questionnaire v2.1 in episodic and chronic migraine. Headache. 2012;52(3):409–421. DOI:10.1111/j.1526-4610.2011.01997.x
- Gillard PJ, Devine B, Varon SF, et al. Mapping from disease-specific measures to health-state utility values in individuals with migraine. Value Health. 2012;15(3):485–494. DOI:10.1016/j.jval.2011.12.007
- Jönsson L, SA R, Kymes S, et al., editors. Disease-specific quality-of-life measures mapped to the EQ-5D in a chronic disorder with recurrent attacks: analysis of the deliver trial in patients with migraine. ISPOR Europe: Vienna Austria. 2022 Dec 11.
- Sacco S, Amin F, Ashina M, et al. European Headache Federation guideline on the use of monoclonal antibodies targeting the calcitonin gene related peptide pathway for migraine prevention - 2022 update. J Headache Pain. 2022;23(1):67.
- Ashina M, Lanteri-Minet M, Pozo-Rosich P, et al. Safety and efficacy of eptinezumab for migraine prevention in patients with two-to-four previous preventive treatment failures (DELIVER): a multi-arm, randomised, double-blind, placebo-controlled, phase 3b trial. Lancet Neurol. 2022;21(7):597–607. DOI:10.1016/S1474-4422(22)00185-5
- Goadsby PJ, Barbanti P, Lambru G, et al. Eptinezimab improved patient-reported outcomes and quality of life in patients with migraine and prior preventive treatment failures. Euro J Of Neurology. 2023;30:1089–1098.
- Lipton RB, Dodick DW, Ailani J, et al. Patient-identified most bothersome symptom in preventive migraine treatment with eptinezumab: a novel patient-centered outcome. Headache. 2021;61(5):766–776. DOI:10.1111/head.14120
- Winner PK, McAllister P, Chakhava G, et al. Effects of intravenous eptinezumab vs placebo on headache pain and most bothersome symptom when initiated during a migraine attack: a randomized clinical trial. JAMA. 2021;325(23):2348–2356. DOI:10.1001/jama.2021.7665
- Barbanti P, Goadsby PJ, Lambru G, et al. Effects of eptinezumab on self-reported work productivity in adults with migraine and prior preventive treatment failure in the randomized, double-blind, placebo-controlled DELIVER study. J Headache Pain. 2022;23(1):153. DOI:10.1186/s10194-022-01521-w
- Wang X, Wen D, He Q, et al. Efficacy and safety of monoclonal antibody against calcitonin gene-related peptide or its receptor for migraine patients with prior preventive treatment failure: a network meta-analysis. J Headache Pain. 2022;23(1):105. DOI:10.1186/s10194-022-01472-2
- Jhingran P, Osterhaus JT, Miller DW, et al. Development and validation of the migraine-specific quality of life questionnaire. Headache. 1998;38(4):295–302. DOI:10.1046/j.1526-4610.1998.3804295.x
- National Institute for Health and Care Excellence (NICE). 2018 . Erenumab for preventing migraine [ID1188] - Single Technology Appraisal Document; [cited 2020 Mar 27]; Available from: https://www.nice.org.uk/guidance/ta682/documents/committee-papers-3
- Buse DC, Winner PK, Charleston L, et al. Early response to eptinezumab indicates high likelihood of continued response in patients with chronic migraine. J Headache Pain. 2022;23(1):29. DOI:10.1186/s10194-022-01387-y
- Streiner DL. Finding our way: an introduction to path analysis. Can J Psychiatry. 2005;50(2):115–122.
- Mahon R, Lang A, Vo P, et al. Cost-effectiveness of erenumab for the preventive treatment of migraine in patients with prior treatment failures in Sweden. Pharmacoeconomics. 2021;39(3):357–372. DOI:10.1007/s40273-020-00996-2
- Diener HC, Dodick DW, Lipton RB, et al. Benefits beyond headache days with onabotulinumtoxinA treatment: a pooled PREEMPT analysis. Pain Ther. 2020;9:683–694.
- Young M, Ng S, Mellick G, et al. Mapping of the PDQ-39 to EQ-5D scores in patients with Parkinson’s disease. Qual Life Res. 2013;22:1065–1072.
- Purba F, Anggriani Y, Murtini T. EQ-5D-5L in Schizophrenia: differences between patients and nurses’ reports. Health Qual Life Outcomes. 2021;19:240–248.
- Moore A, Young C, Hughes D. Mapping ALSFRS-R and ALSUI to EQ-5D in patients with motor neuron disease. Value Health. 2018;21(11):1322–1329.
- Broderick JE, Stone AA, Calvanese P, et al. Recalled pain ratings: a complex and poorly defined task. J Pain. 2006;7(2):142–149. DOI:10.1016/j.jpain.2005.09.012
- Stull DE, Leidy NK, Parasuraman B, et al. Optimal recall periods for patient-reported outcomes: challenges and potential solutions. Curr Med Res Opin. 2009;25(4):929–942. DOI:10.1185/03007990902774765