
ABSTRACT
Introduction
While magnetic resonance imaging (MRI) is established in diagnosing and monitoring disease activity in multiple sclerosis (MS), its utility in predicting and monitoring disease progression is less clear.
Areas covered
The authors consider changing concepts in the phenotypic classification of MS, including progression independent of relapses; pathological processes underpinning progression; advances in MRI measures to assess them; how well MRI features explain and predict clinical outcomes, including models that assess disease effects on neural networks, and the potential role for machine learning.
Expert opinion
Relapsing-remitting and progressive MS have evolved from being viewed as mutually exclusive to having considerable overlap. Progression is likely the consequence of several pathological elements, each important in building more holistic prognostic models beyond conventional phenotypes. MRI is well placed to assess pathogenic processes underpinning progression, but we need to bridge the gap between MRI measures and clinical outcomes. Mapping pathological effects on specific neural networks may help and machine learning methods may be able to optimize predictive markers while identifying new, or previously overlooked, clinically relevant features. The ever-increasing ability to measure features on MRI raises the dilemma of what to measure and when, and the challenge of translating research methods into clinically useable tools.
1. Introduction
Multiple sclerosis (MS) is a chronic, inflammatory demyelinating neurodegenerative disease of the central nervous system (CNS) [Citation1]. It affects over 130,000 people in the UK and is the commonest cause of non-traumatic disability among young adults [Citation2–4]. Approximately 85% present with an episode of neurological deficit (termed a clinically isolated syndrome; CIS) [Citation5] and then initially run a relapsing-remitting (RRMS) course characterized by episodes of neurological deficits (relapses) with at least partial recovery of function [Citation1]. Current evidence suggests that half or more of people with RRMS will transition to secondary progressive (SP) MS, typically around 15–20 years after first symptom onset, characterized by progressive neurological impairments with few or no relapses [Citation6–8]. A minority of people with MS (~15%) have a primary progressive (PP) form, in which progressive neurological disability accrues from disease onset without any clearly discernible relapses [Citation1]. The transition between RRMS and SPMS can be challenging to establish clinically [Citation9] and can take years to determine. Pathologically, there are no distinct new processes which occur among those developing progressive compared with RR MS, but instead there appear to be differences in the extent and degree of pathogenic mechanisms, which may be seen in all clinical forms of MS. Recently, the division between RRMS and SPMS has been further challenged by the recognition that even in people with RRMS clinically significant progression independent of relapses (PIRA) commonly occurs [Citation10], which we consider in more detail below.
Magnetic resonance imaging (MRI) has an established role in the diagnosis and prognostication of MS [Citation11], but this is mainly based on the detection of white matter (WM) lesions and their association with relapses. The role of MRI in the assessment of MS progression is less clear-cut in clinical practice, although it is typically used in early phase treatment trials and has provided useful insights into the in vivo evolution of pathology and pathogenesis of disability in progressive MS. Members of our group reviewed this in secondary progressive (SP) disease in this journal in 2016 [Citation12]. In this review, we build on this earlier review, and discuss the potential role of MRI as a predictor of clinical outcomes and as a measure of progression viewed from the perspective of pathogenic mechanisms that may underlie disease progression. We focus on significant developments since the 2016 SPMS review article, and so do not aim to replicate it here. In addition, while spinal cord pathology has a clear and significant role in progressive MS, this has been recently reviewed in detail [Citation13] and so will not be reprised here.
2. Clinical characteristics of progression
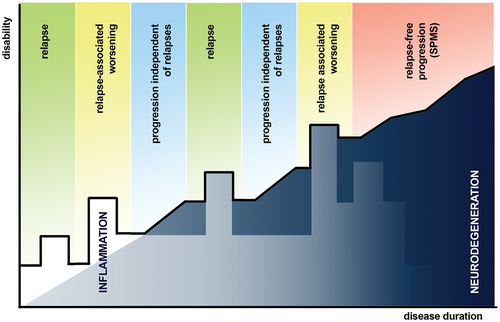
It is increasingly suggested that traditional clinical MS phenotypes (RRMS, PPMS, and SPMS) [Citation7,Citation14,Citation15] do not adequately capture the disease’s full clinical spectrum, and that clinical differences reflect the predominant pathological mechanisms at a given time rather than absolute differences in pathology [Citation7]. This is reflected in the recently proposed redefinition of disease course [Citation16] which frames disease activity in terms of relapses and progression in MS, but not does not expect these to be mutually exclusive features. While conventional phenotypes separate PPMS from SPMS, PPMS shows similarity with SPMS in terms of the age at onset, the rate of disability progression and frequency of (albeit sparse) clinical relapses [Citation7]. Although PPMS was previously considered less inflammatory than SPMS [Citation6], more recently, inflammation elsewhere (for example meningeal, perivascular and extra-lesional brain tissues) has been implicated in progression in both PP and SPMS [Citation7,Citation15,Citation16]. Reflecting the phenotypic overlap between RR and progressive MS, the concept of PIRA has emerged as a way of capturing and quantifying non-relapse associated disability progression in RRMS (). PIRA has been defined as an increase in expanded disability status scale (EDSS) scores of ≥1.5 points from baseline EDSS 0, an increase of ≥1.0 points from baseline EDSS 1–5, or an increase of ≥0.5 points from baseline EDSS ≥5.5, confirmed by a second assessment after at least 3 months (in order to confirm true worsening disability) and with either no prior relapse or an onset of more than 90 days from the start of the last reported relapse [Citation17]. Despite clinical relapses being traditionally thought to be the main cause of disability accrual in RRMS, PIRA may actually account for at least half or more (53.6–70.9%) of all confirmed EDSS-worsening events in those with RRMS [Citation17]. It is also worth recalling here the well-recognized limitations of the EDSS scale; in particular, its limited sensitivity to clinical changes and the dominance of motor disability components (e.g. walking) throughout much of the scale [Citation18] and that the inclusion of additional clinical measures may improve sensitivity to change (e.g. 9-hole peg test and timed 25-ft walk) [Citation19]. Kappos and colleagues [Citation20] found that in RRMS patients, approximately 78–89% of composite confirmed disability accumulation was likely due to PIRA rather than relapse-associated worsening, although this was with the caveat that they had used less stringent EDSS thresholds for confirmed disability worsening and did not require PIRA events to be sustained. A recent longitudinal study [Citation10] demonstrated that 25% of MS patients experienced PIRA events within 12 years from first symptom onset (while ~10% of patients had PIRA events within 5 years) significantly increasing the risk of developing later severe disability. Taken together, these studies suggest that PIRA affects a significant proportion of people with RRMS, in whom PIRA events are a substantial contributor to disability. They also reinforce the view that the division between RRMS and progressive MS is not absolute and may to a degree be based on observation bias, and that the processes underlying progressive MS, and their assessment, may be of significant clinical relevance even before the onset of SPMS.
Figure 1. Graphical representation of disability progression in MS with clinical descriptors of events associated with disability accumulation highlighted above the line in bold (reflecting disability at that timepoint). Underneath the line, the interplay and evolution of underlying inflammatory and neurodegenerative processes are depicted. Whilst neurodegeneration is thought to ultimately drive irreversible disability progression in MS, it is important not to assume that the same processes underlie PIRA and SPMS, although they may.
It is also worth recalling that a substantial proportion of people with RRMS show no signs of developing SPMS over two or more decades [Citation21]. For instance, in one longitudinal study spanning 30 years [Citation22], it was reported that up to a third of people with RRMS did not ultimately progress to progressive stages following first symptom onset. When looked at in retrospect, these people show no clear signs of progression earlier in the clinical course, and this seems to be reflected in a slower rate of brain atrophy and lower accrual of gray matter (GM) brain lesions when compared with people who do develop SPMS [Citation23]. It is also worth noting that progression in SPMS does not appear to be strongly influenced by preceding clinical course or prior relapse frequency [Citation24], although the time to a diagnosis of SPMS does appear to be shorter in people with more frequent relapses [Citation7,Citation8,Citation25].
3. Effects of disease modifying therapies on progression
The role of MRI in monitoring disease modifying therapy (DMT) efficacy and risk has been reviewed in detail elsewhere [Citation26], but in current clinical practice MRI is used to monitor disease activity andDMT efficacy by assessing new or enlarging, or contrast-enhancing, WM lesions. MRI also has an important role in surveillance for progressive multifocal leukoencephalopathy, primarily in patients treated with Natalizumab.
There is growing evidence that the early use of DMTs slows the accrual of relapse associated disability, delays conversion to SPMS [Citation27,Citation28], and reduces long-term disability [Citation29,Citation30], which has led to increasing support for early treatment with high-efficacy DMTs over escalation-based paradigms [Citation31]. The effects of current DMTs appear to be greatest in early RRMS, where inflammatory activity (clinical relapses and new WM lesion formation) is the predominant pathology: there remains a paucity of treatment options available for established progressive MS, and to date none that are mechanistically clearly different from those used in RRMS. It is also worth considering here how earlier treatments may have significant persistent effects that need to be taken account of in clinical practice and trials. For example, alemtuzumab and cladribine are given as time-limited courses over days but have effects that persist for years, and while they do not necessarily prevent progression entirely, they may significantly modify pathological processes underlying it. Other DMTs may have similarly long-term effects that need to be accounted for.
4. Pathological processes underlying progressive clinical disability
The main driver of functional neurological decline in progressive MS is thought to be neurodegeneration, and, while not necessarily clinically apparent, it begins early in the clinical course of the disease [Citation1,Citation32]. However, the main cause of neurodegeneration in MS is unknown, and multiple processes may lead to it, both in GM and WM. In acute WM lesions, axonal transection occurs in parallel with inflammation and demyelination [Citation33], and in lesions that do not fully remyelinate there is chronic axonal loss [Citation34]. Further, a significant proportion of WM lesions are thought to remain chronically active (~30% from histopathological studies) [Citation35,Citation36], which is associated with on-going axonal loss [Citation35,Citation37]. These processes may unfold over years, and the true effects of WM lesions may not be apparent for a decade or more after they first form [Citation38]. GM lesions, in particular ribbon-like subpial lesions, appear to be relatively specific for MS and are rarely seen in other neurological diseases [Citation39] or healthy controls [Citation40,Citation41]. GM lesions also appear to be overall more extensive than WM lesions (26.5% of total GM involvement versus 6.5% in the WM) [Citation42]. Features of neuroaxonal loss are also seen in both GM lesions and the surrounding normally-appearing gray matter (NAGM) [Citation43,Citation44]. GM lesions are more prevalent in those developing progressive MS and correlate with accruing disability [Citation45,Citation46] at least as much as, if not more so than, WM lesions [Citation7,Citation47]. One recent study [Citation48] investigated differences between those with RRMS or SPMS 30 years after a CIS and found that the number of GM lesions was what most clearly differed between them.
Unlike RRMS, where the dominant mechanisms driving inflammation appear to be led by the activation of the acquired (adaptive) immune system and infiltration of peripherally-derived lymphocytes and macrophages, in progressive MS greater activation of immune pathways intrinsic to the CNS are thought to be more relevant [Citation14,Citation49]. Microglial activation occurs from the early stages of MS, through increases in its prominence over time [Citation49–51]. There has also been growing interest in inflammation occurring outside brain parenchyma, and how this may influence pathology within the brain. For example, meningeal inflammatory mechanisms have been implicated in contributing to GM lesional pathology and surface-in-gradients of neuronal loss in lesional and extra-lesional GM, as well as in microglial activation [Citation52,Citation53]. Histopathological studies have also shown inflammation and aggregation of lymphoid tissues (consisting of clustered B- and T-cell infiltrates) within the meningeal layers compartmentalized behind an intact or repaired blood-brain barrier (BBB) [Citation54–57]. Given that sustained CNS inflammation may be detectable in the CSF (e.g. through mild lymphocytosis, presence of oligoclonal immunoglobulin-G bands), there has been significant interest in persistent leptomeningeal and perivascular compartmentalized inflammation and the role it plays toward clinical disease progression [Citation58,Citation59]. One hypothesis is that persistent accumulation of inflammatory lymphoid cells within a repaired BBB may sustain intrathecal myelin-specific immune responses [Citation44,Citation52,Citation60–62]. More recently, the discovery of the homeostatic role of the glymphatic system in CNS waste clearance (e.g. soluble proteins and metabolites) [Citation63] has been described in several neurodegenerative conditions including Parkinson’s disease and Alzheimer’s dementia [Citation64,Citation65], and more recently in MS [Citation66] although its exact effects on clinical disability remains to be determined.
Iron homeostasis within the CNS may also be relevant to neurodegeneration and disease progression in MS, as iron accumulation may lead to neurotoxicity (from metabolic dysfunction, oxidative stress or calcium/glutamate-induced excitotoxicity), altered microglial/macrophage activity and activation of circulating immune cells [Citation67]. Although not necessarily specific to MS, iron deposition in neuropathological specimens of MS patients appears to correspond to regions that undergo neurodegeneration and demyelination [Citation68,Citation69].
5. Monitoring and predicting disease progression on MRI (in clinical practice and trials)
5.1. WM inflammation
5.1.1. Acute WM inflammation
WM lesions, as seen in conventional structural MRI, are a key part of current diagnostic criteria [Citation11] based on lesion distribution and evolution [Citation70–73] and have been considered in detail in the 2016 SPMS review [Citation12]. Administration of gadolinium-based contrast agents may indicate areas of acute WM inflammation on MRI as a result of a disrupted BBB, with findings enhancing for up to four weeks [Citation12,Citation74]. Studies have repeatedly shown [Citation22,Citation75–77] that early WM lesion accrual is associated with worse clinical disability (as measured using EDSS) [Citation22,Citation75–77], with infratentorial lesions [Citation22,Citation78,Citation79] in particular being a consistent predictor of worse clinical outcomes. Of note, one recent longitudinal study [Citation22] explored the effects of early lesion accrual on clinical outcomes 30 years from first symptom onset, and found that a greater number of baseline lesions predicted greater clinical disability (EDSS >3.5) at 30 years (OR = 1.84 between grouped lesion counts). Compared to other lesion locations, the number of infratentorial lesions at baseline and 1-year, and deep white matter lesions at 1-year were the strongest independent predictors of clinical disability (EDSS >3.5) (ORs 12.4, 11.1, and 10.7, respectively) and SPMS development (ORs 20.3, 19.3, and 14.9) by 30 years, while the number of infratentorial lesions at baseline and 1-year were most predictive of MS-related mortality by 30 years (HR = 3.9 and 5.25 respectively). It is important to note however that, while a greater burden of WM lesion correlates directly with worse disability and greater disease progression, these MRI findings still only explain a proportion of the observed clinical variability of MS outcomes (the ‘clinico-radiological paradox’) [Citation80].
5.1.2. Chronic active WM inflammation
Given that the effects of early accrual WM lesions may take several years to exert maximal effect on brain atrophy and progressive disease [Citation35,Citation36], and that a significant proportion (~30%) of lesions show evidence of chronic inflammatory activity [Citation75] there has been increasing interest in imaging techniques that better characterize chronically active lesions. While the optimal methods of detecting chronic WM lesions are still to be determined, the presence of a susceptibility-weighted rim surrounding WM lesions and measurement of serial lesion expansion both mark chronically active lesions. A susceptibility-weighted rim can be detected using susceptibility-weighted imaging (SWI) MRI [Citation81–84], and reflects iron deposition at the perimeter of chronically active lesions as a result of microglial and macrophage activation [Citation14,Citation37,Citation85–89]. Slow expansion of lesions, as a marker of chronic lesional activity, can be measured through serial measurement of lesion growth over time [Citation86,Citation90,Citation91].
The presence and increased proportion of slow-expanding lesions is related to greater disability progression over time [Citation86,Citation90,Citation91]. In one study conducted by Elliott and colleagues [Citation86], accumulation of T1 hypointense lesion volume correlated with chronic T2 lesional expansion, rather than the formation of new T2 lesions, and was associated with an increased risk of disability progression at 12 weeks. A more recent study by the same group [Citation90] developed automated heuristic algorithms to detect chronically active, slow expanding lesions through Jacobian analyses of sub-voxel level tissue deformation, and found that chronic slowly expanding lesions were more common and had greater T2 volumes among PPMS patients when compared to relapsing MS, further emphasizing the role of chronic inflammation in progressive disease. In another study [Citation92], Klistorner and colleagues found that chronic lesion volumes were also significantly associated with accelerated brain atrophy and disability accrual (as measured by EDSS) independent of the formation of new WM lesions. Another recent longitudinal cohort study by Preziosa and colleagues [Citation91] also found that a higher proportion of slowly expanding WM lesions and lower MTR values at baseline both independently predicted clinical disability progression (using EDSS) after 9 years.
5.2. GM inflammation
5.2.1. Acute GM inflammation
Detecting cortical lesions in vivo using MRI is more difficult than identifying WM lesions [Citation93]. Cortical lesions are smaller, generate less contrast (due to the comparative paucity of myelin in the cortex compared with WM) and are spatially more prone to partial volume effects [Citation94]. Demyelinating cortical lesions can be detected on conventional field-strength (1.5T and 3T) MRI using double inversion recovery (DIR) or phase-sensitive inversion recovery sequences (PSIR) [Citation95]. The histopathological-validated sensitivity of DIR and PSIR at 3T with similar resolution (1.2 mm3 and 1.25 mm3 respectively) is only about 10% of purely intracortical lesions, albeit with high pathological specificity [Citation96,Citation97]. Ultra-high field strength MRI at 7T, with superior spatial resolution and contrast, increases the sensitivity of cortical lesion detection [Citation98]. Compared with 3T MRI, 7T MRI is able to detect about twice the number of intracortical lesions in clinical MRI sequences (T2-weighted and FLAIR) but a significant proportion of cortical lesions remain undetected, particularly subpial lesions [Citation99–101].
Despite these limitations, MRI studies can identify cortical lesions in most people with MS, even in the earliest stages, and they are rarely seen in healthy controls [Citation40,Citation41,Citation102,Citation103]. Longitudinal studies have shown cortical lesion accrual is greater in SPMS than in RRMS patients and that cortical lesions appear to develop intracortically, independently of WM lesions [Citation104–106]. Cortical lesion loads correlate positively with EDSS and appear to do so more than WM lesion volumes, particularly with increased sensitivity for cortical lesion detection at 7T [Citation102,Citation105,Citation107,Citation108]. In 102 patients with MS, cortical lesion volume, along with disease duration, increased the odds of a higher EDSS score independent of cortical atrophy [Citation108]. Similarly, in 63 people evaluated 30 years after a first demyelinating episode suggestive of MS, cortical lesions were the main correlate of neurological disability measured by EDSS and distinguishing feature of a progressive disease course [Citation48]. In the same study, cortical lesions also had a significant contribution to other clinical outcomes at 30-years in terms of lower limb function (timed 25-ft walk test) and cognitive impairment (symbol digit modalities test) [Citation48]. Cortical lesion number and volume have been found to be higher in patients with cognitive impairment and both correlated with test scores across multiple cognitive domains, while cortical lesion volume appears to be an independent predictor of a composite cognitive impairment index [Citation109]. Similarly, cortical lesion number has been shown to significantly increase the risk of mild cognitive impairment [Citation110], and cortical lesion volume correlates with cognitive impairment independent of WM lesion load and brain volumes [Citation102].
Cortical lesions not only influence current physical and cognitive disability but also seem to be of prognostic value. An early longitudinal study showed that cortical lesion volume predicts subsequent gray matter atrophy and disability progression over 3 years [Citation106]. More recently, baseline cortical lesion volume has been shown to influence both baseline EDSS and subsequent EDSS change (over a mean 1.5-year interval), independent of white matter lesion load and cortical atrophy [Citation105]. Using a gradient-boosted decision tree machine learning algorithm, cortical lesions, particularly leukocortical lesions were among the most influential imaging markers to predict EDSS progression and differentiate between MS disease phenotypes over 3 years [Citation111]. In the longer term, the presence of at least three cortical lesions at diagnosis predicts cognitive impairment at 20 years [Citation112]. Furthermore, the key predictive factors in a machine-learning derived risk score of conversion to SPMS over 10 years included both cortical lesion number at MS diagnosis and increase in cortical lesion volume over the first 2 years, with the latter having the greatest predictive effect barring age [Citation113].
5.2.2. Chronic active GM inflammation
Histopathological studies have shown that, as with WM lesions, cortical lesions may be staged into active, inactive and chronic active lesions; the latter is identified by increased presence of activated microglia at the lesion edge or pial surface [Citation55,Citation60,Citation114]. People with chronic active cortical lesions showing rims of activated microglia on postmortem tissue had a less favorable disease course with more active WM inflammation, shorter disease duration and a younger age at death [Citation115]. There was also a correlation between chronic active cortical lesions and the presence of chronic active WM lesions, suggesting that chronic inflammation in WM and GM are related. Chronic active cortical lesions can be identified on T2* gradient echo MRI sequences by the appearance of a hypointense halo or ring around a hyperintense center [Citation116]. Chronic activity can be seen in all cortical lesion subtypes, although most are leukocortical lesions, and the rim hypointensity correlates with the identification of iron-rich microglia on immunohistochemical analysis [Citation116]. Similarly, quantitative susceptibility mapping (QSM) can accurately quantify brain iron load and be used to identify chronically active lesions with a paramagnetic rim, related to the presence of iron-laden activated microglia and macrophages [Citation117]. QSM-hyperintense cortical lesions appear to correlate with EDSS in the subset of RRMS patients, although to date an association in SPMS has not been observed (attributed to smaller sample sizes) [Citation111,Citation117]. Positron emission tomography (PET) imaging has been shown to have a useful role to play in identifying chronic inflammatory activity (see review [Citation118]). Using MRI PET and the 11 C-PBR28 radioligand, Herranz et al. [Citation119] were able to show that patients with more active cortical lesions had lower cognitive performance and greater disability.
5.3. Microglial activation in chronic inflammation
Activated microglia are seen at the rims of chronically active lesions [Citation37,Citation120] and extra-lesional WM [Citation6]. We have previously discussed the presence of a susceptibility-weighted rim on SWI scans above. Considering extra-lesional tissues, there is currently no MRI technique that is specifically sensitive to microglial activation, although microglial activation does appear to be associated with myelin and axonal pathology that can be assessed using MRI [Citation35]. Here positron emission tomography (PET) has a clear advantage over MRI, with the ability to specifically tag cell types if an appropriate ligand can be found. For microglia, translocator protein ligand (TSPO) PET has shown promise in mapping microglial activity, suggesting that this is apparent in the NAWM preceding radiological features of neurodegeneration measured by enlarging T2-lesions and brain atrophy [Citation121,Citation122].
5.4. Leptomeningeal disease
Imaging the leptomeninges is technically challenging, both in terms of distinguishing areas of inflammation from meningeal blood vessels (which also avidly enhance with Gadolinium contrast on T1-weighted images) or due to contrast leakage from surface brain lesions into surrounding CSF spaces [Citation59]. With the ability of 3T and 7T MRI to better detect subpial demyelination and GM lesion formation, several studies have demonstrated leptomeningeal contrast enhancement (LMCE) as a radiological marker of neuroinflammation, which appears to correlate with both subpial demyelination and areas of meningeal inflammation cells [Citation59]. LMCE correlates with greater volume and rate of GM loss, greater disability, and longer disease duration in MS [Citation59,Citation123–125]. In one study, LMCE appeared to be more prevalent among those with MS compared to healthy controls (25% vs 2.7%) [Citation59], while two studies suggested that, among patients with established MS, this finding was also more common in progressive forms (33–85.7%) [Citation59,Citation125]. Using 3T imaging, Zivadinov and colleagues [Citation125] found that LMCE persisted in at least 50% of cases over the 5-year follow-up period, while those with SPMS were more likely to have multiple foci of LMCE. However, in a more recent study [Citation126] which utilized 7T MRI the investigators found that, while LMCE persisted in approximately 70–85% of the patients after 2 years, there were no observed differences in LMCE between patients that followed progressive and non-progressive courses of MS. The presence of LMCE does not appear to be influenced by DMT use [Citation59,Citation125–128], and two further studies which considered the use of intrathecal rituximab [Citation129] and intravenous ocrelizumab [Citation130] anti-CD20 therapies.
5.5. Perivascular disease
A small number of studies have found associations between greater numbers of enlarged perivascular spaces and worse cognitive performance [Citation131] and fatigue [Citation132] clinically, as well as greater numbers of gadolinium-enhancing lesions [Citation133] and lower brain volumes [Citation134]. Considering micro, rather than macrostructural features, Carotenuto and colleagues [Citation66] recently evaluated diffusion tensor imaging along the perivascular space (DTI-APLS) (as a marker of glymphatic function), and found a lower DTI-APLS index among individuals with MS compared to healthy controls (suggesting impairment in glymphatic system function), as well as in those with more progressive forms of MS compared to relapsing-remitting phenotypes. A lower DTI-APLS also correlated radiologically with higher WM and cortical GM lesion volumes, greater GM atrophy (both cortical and deep GM) and reduced fractional anisotropy and increased mean diffusivity in the NAWM, as well as being clinically associated with more severe clinical disability among and greater MS disease duration [Citation66]. This is a newly emerging field, and these findings suggest that there may be value in exploring it further.
5.6. Neurodegeneration
5.6.1. Brain and grey matter atrophy
The final pathway of tissue injury from acute and chronic demyelination is neuro-axonal loss [Citation135] although it also occurs independently of lesions [Citation136,Citation137] and is associated with volumetric changes on MRI [Citation138]. Since the 2016 review [Citation12], there is now more of a consensus [Citation139] that brain volume loss occurs from earliest MS, is associated with concurrent disability and predicts future disability throughout the disease course with changes in GM volume being more pronounced and clinically relevant than WM. It has also been shown that people with MS may have ‘silent progression,’ defined as worsening disability in the absence of relapses or white matter lesions, with higher rates of brain atrophy than those with stable disease, although it is not clear if this is driven by GM volume loss [Citation140]. The measurement of whole brain atrophy has been preferred in clinical trials, as it is technically less challenging, but remains difficult to apply to clinical practice [Citation12,Citation139,Citation141].
5.6.2. Regional atrophy
It has been shown that regional linear atrophy measures, even derived from low resolution 0.5T MRI, can independently predict long-term disease progression and disability [Citation23]. Similarly, lateral ventricle volume is a promising metric that correlates with disability progression and may prove more clinically feasible than whole brain volume measurement [Citation141–143]. Brain atrophy appears fastest in deep GM, being associated with disability progression and baseline deep GM volume predicts time-to-EDSS progression [Citation144]. In deep GM, the cingulate cortex and thalamus show the greatest volume loss and correlate with subsequent disability progression, with baseline thalamic volume predictive of future disability worsening over 2–8 years [Citation145–149]. Thalamic atrophy is better explained by WM lesion volumes than by focal thalamic lesions [Citation149,Citation150] suggesting a network-based neurodegeneration due to progressive structural disconnection and Wallerian degeneration.
5.6.3. Connectivity, disconnectome, and network collapse
The concept that neurodegeneration may also be network-mediated was further suggested by studies using source-based morphometry (SBM) and independent component analysis (ICA). These have shown regions of cortical atrophy are nonrandom and co-vary in distinct anatomical patterns, some consistent with known neural networks, as well as being associated with clinical disability [Citation151]. Indeed, some baseline regional patterns of GM atrophy identified using ICA may better predict disability than single regional or global atrophy measures [Citation152]. SBM has been applied longitudinally to identify covarying patterns of GM atrophy associated with confirmed disability progression over 10 years in RRMS patients [Citation153].
There has been growing interest in comprehensively studying connections between brain regions’, by mapping either structural or functional connectivity between different brain GM regions [Citation154]. Using resting state functional MRI, functional connectivity appears to increase early in MS as part of network reorganization [Citation155,Citation156] and decreases with greater disease duration and disability progression [Citation157,Citation158]. Structural connectivity studies have shown that patients with MS have a more random cortical topology [Citation159] which may be associated with cognitive dysfunction [Citation160]. Limited longitudinal analyses of structural cortical networks have so far revealed both adaptive and maladaptive changes in network connectivity, efficiency, and network reorganization that similarly appear to evolve at different timepoints in the disease [Citation161–163], while baseline connectivity disruption may predict worse future cognition [Citation164].
Conversely, ‘disconnectome’ approaches have been employed to assess how WM lesions disrupt WM tracts connecting GM regions. The effects of WM lesions on global network properties, regional connectivity (e.g., the proportion of WM tracts to a given GM region affected by WM lesions) and connectivity between pairs of regions (individual WM tracts most likely affected by WM lesions) can then be derived [Citation164]. Disconnection measures, while directly related to WM lesion volumes, are associated with disability independent of WM lesion volumes [Citation165]. Models combining disconnectome metrics of region-pairs with GM atrophy better predicted future processing speed (symbol digit modalities test) compared with models based on global or regional disconnection with GM atrophy or GM atrophy alone, but overall prognostic associations remain poorly understood [Citation164].
5.6.4. Atrophied lesion volume
Recently, the volume of T2-weighted lesional tissue subsequently replaced by CSF has been posited as an imaging biomarker of disease progression [Citation166]. Although histological correlation has yet to be confirmed, atrophied T2 lesion volume is associated with both baseline WM lesion volumes and percentage brain volume changes, capturing aspects of both inflammation and neurodegeneration [Citation167]. It is greater in people with progressive MS versus relapse-onset MS and increases with disease duration [Citation166,Citation168]. Furthermore, atrophied T2 lesion volume correlates with disability, explaining addition variance beyond whole brain atrophy and WM lesion volumes [Citation166,Citation169], and differentiates patients showing disease progression better than global and regional atrophy measures [Citation167,Citation168]. Prognostically, atrophied T2 lesion volume has been associated with conversion to SPMS [Citation168] and appears to predict time to disease progression earlier than whole brain, central or cortical atrophy measures [Citation169].
5.7. Microstructural disease in the normal appearing brain tissue
Pathology in MS may extend beyond lesion borders into macroscopically normal-appearing brain tissue [Citation114,Citation170], and so quantitative MRI techniques may be useful in detecting subtle microstructural abnormalities [Citation171] not visible on conventional MRI sequences [Citation172,Citation173]. In addition to increased sensitivity to MS pathology in normal-appearing brain tissue, quantitative MRI techniques may help to identify and monitor biological processes occurring in vivo by exploring microstructural damage in various tissue components (such as myelin, axons, and iron).
5.7.1. Axonal degeneration
Diffusion-tensor imaging (DTI) has been widely used in the research setting and DTI metrics (fractional anisotropy and mean diffusivity) correlate with myelin content and axonal counts in NAWM [Citation174] and axonal density, but not myelin in normal-appearing cortex [Citation91]. Measures of diffusivity have shown deterioration in WM tract integrity in patients with progressive MS [Citation175] and similar worsening of DTI parameters in WM tracts can be seen in patients with no evidence of disease activity, suggesting DTI metrics may be sensitive to an underlying neurodegenerative process [Citation176]. DTI metrics may also have some utility in predicting cognitive decline [Citation177] and disability progression [Citation178]. Although sensitive to pathology, DTI metrics lack biological specificity as they are easily affected by any changes to the underlying tissue microstructure or organization and are difficult to interpret at voxels where fibers or tissue types cross [Citation179].
An emerging technique, neurite orientation dispersion and density imaging (NODDI) overcomes the latter by modeling water diffusion in three different compartments to provide more precise microstructural information, including metrics of intracellular volume fraction, neurite density index (NDI) and orientation dispersion index (ODI) [Citation180]. The utility of these metrics has yet to be fully elucidated. NDI appears to be reduced in NAWM and even more so in WM lesions, with potentially similar findings in NAGM and cortical lesions [Citation180,Citation181]. ODI appears to be more heterogenous and is dependent on the underlying tissue type, for example being increased in GM relative to WM, which has more compacted fibers. ODI changes could also reflect changes in underlying pathology; compared to healthy WM, ODI may be increased in NAWM and early lesions due to tissue damage disrupting highly parallel fibers (and increasing dispersion) and decreased in chronic lesional tissue as a result of severe axonal loss [Citation180]. NODDI metrics have been associated with disease severity [Citation182,Citation183] but further work is required to observe the longitudinal evolution of these parameters and evaluate their value in prognosticating disease progression.
5.7.2. Iron accumulation
The utility of iron accumulation in identifying chronically active WM lesions has been discussed earlier (see section 4.2.2) but iron accumulation in extralesional tissues may also be relevant. Early MRI studies noted T2-hypointensities, thought to reflect iron deposition, within deep GM structures [Citation184,Citation185], which were subsequently found to correlate with brain atrophy [Citation186,Citation187], disability [Citation187–190] and clinical course [Citation187,Citation189], as well as cognitive impairment [Citation191]. Baseline measure of GM T2-hypointensity were even predictive of future disability progression [Citation192,Citation193] and atrophy [Citation194]. Over the past decade, advanced MRI techniques such as QSM and R2* have been developed to estimate brain iron load. Histological work has shown that QSM is positively correlated with the paramagnetic properties of iron leading to an increase in susceptibility, while the diamagnetic effects of myelin lead to a decrease in susceptibility and negative correlation; while increases in R2* signal may be due to increases in iron or myelin concentration [Citation195].
Using these methods, iron accumulation within deep GM structures can be seen in the earliest stages of MS [Citation196] and is increased in the progressive forms of the disease [Citation197]. Higher deep GM R2* signal has been linked to EDSS and motor scores while higher basal ganglia susceptibility (both reflecting higher iron concentration) has been associated with clinical disability [Citation198]. Interestingly the same study found lower thalamic susceptibility in MS, associated with greater disease duration, disability and SPMS [Citation198]. It has been proposed that there may be thalamic iron deposition in early MS followed by depletion of iron from oligodendrocytes and reduced thalamic susceptibility [Citation199]. Similar low iron concentrations are seen in NAWM in iron-imaging studies of MS consistent with histopathology, where iron depletion also correlated with disease duration [Citation200]. Iron levels within tissues and lesions are not stationary, but subject to fluctuations depending on inflammatory activity [Citation201] and may also be involved in tissue regeneration [Citation202]. Monitoring iron changes to track neurodegeneration is therefore likely to be complex, and more work needs to be done to fully establish the consequences of iron deposition and dysregulation in MS.
5.7.3. Myelination
Several MRI techniques have been shown to be sensitive to myelin density [Citation203,Citation204] of which magnetization transfer ratio (MTR) and myelin water fraction (MWF) have the highest correlation with histological verification in clinical studies [Citation203,Citation204]. In both WM and GM, lesional tissue MTR values are abnormally lower than in normal-appearing brain tissue [Citation205], while a more severe baseline NAWM MTR abnormalities also appears to predict poorer clinical outcomes in MS patients 5 years later [Citation206]. However, in patients with SPMS compared with RRMS, MTR abnormalities in cortical lesions and NAGM are more pronounced and NAGM MTR most consistently associated with clinical outcomes independent of WM lesion volume and brain atrophy [Citation207]. Similarly, normal-appearing cortex MTR can distinguish MS phenotypes and is a significant contributor to long-term cognitive outcomes [Citation48,Citation208]. GM MTR has been shown to correlate with physical disability [Citation209,Citation210] while baseline GM MTR independently predicted disability worsening over 3–8 years [Citation211,Citation212]. In contrast, in another study, MTR within lesions rather than MTR within NAWM and NAGM contributed to concurrent EDSS in a cohort of predominantly RRMS patients, with less overall disability [Citation205]. More recently, Varma and colleagues [Citation213] revised existing MTR methods to develop inhomogenous magnetization transfer ratio (ihMTR) techniques, which are thought to be more sensitive to myelin, and so in quantifying demyelination, than conventional MTR methods alone. Subsequent studies have since demonstrated a greater correlation of ihMTR with EDSS compared to conventional MTR techniques [Citation214], and that may be more sensitive (compared with MTR) to distinguish between WM in controls and NAWM tissue in people with MS [Citation215].
The volume of NAWM deficient in MWF has been shown to correlate with EDSS disability and discriminate SPMS patients from those with RRMS [Citation216]. Myelin-heterogeneity (measured by increased variance of MWF) within the NAWM may be a more sensitive marker of myelin change and has been associated with decreased cognitive processing speed [Citation217] and EDSS [Citation172]. Over time the MWF of NAWM appears to reduce and this may be more in patients with progressive disease (10% decrease over 2 years observed in PPMS patients [Citation218] vs 8% decrease in RRMS patients over 3–5 years [Citation219]. Such changes in NAWM over time are not seen in other neuroinflammatory disorders (such as neuromyelitis optica) and are suggestive of an ongoing neurodegeneration that appears to be specific to MS [Citation220].
5.7.4. Surface-in gradients
Extralesional abnormalities are not uniformly distributed but instead show surface-in gradients in both periventricular WM and cortical GM, with greater abnormality seen the closer the distance from the ventricular surface [Citation53]. Surface-in gradients have been mostly demonstrated on MTR sequences [Citation221–224], but can also be seen on quantitative T1 [Citation225], T2* [Citation226] and diffusion-weighted imaging [Citation227], while pathological of gradients of neuronal loss and meningeal inflammation have been demonstrated in cortical gray matter [Citation44].
As highlighted in a recent review [Citation53], the cause of surface-in gradients remains unclear, but they are most likely mediated by CSF soluble factors released from meningeal inflammation. However, it is clear that surface-in gradients occur early in MS [Citation222,Citation224]) and are most severe in progressive stages [Citation221,Citation224] correlating with disability [Citation225,Citation228–230] and disease duration [Citation229]. Longitudinal studies are lacking, but surface-in gradients appear to in part predict on the risk of future relapses [Citation222], treatment response [Citation231] and a recent study has suggested that baseline gradients may predict future disability in people with early MS [Citation225].
5.8. Tissue sodium accumulation
More recently, sodium (23Na) MRI has been identified as a marker of cellular integrity and tissue viability [Citation232], with an increased sodium concentration (suggestive of axonal damage) within both focal MS lesions on T2 sequences and the NAWM [Citation233–239] that correlates with increased clinical disability and disability progression [Citation237,Citation239]. In a subsequent radiological study conducted by Weber and colleagues [Citation232] comparing lesional and NAWM total sodium concentrations and sodium concentrations were greater among the NAWM and NAGM of MS patients when compared to healthy controls. While total sodium concentrations were similar in both T2 lesions and NAWM, total sodium concentrations were significantly higher in T1 hypointense and isointense lesions compared to T2 lesions.
5.9. Remyelination
Myelin-sensitive MRI metrics can detect longitudinal changes in myelination within lesions. Longitudinal study of MWF changes has shown that while some lesions show decreases in MWF over time, others show increase in MWF over time and capacity for remyelination [Citation240,Citation241]. Similar changes have been observed using MTR, with an increase in MTR observed to correlate with the return to T1 isointensity [Citation242] and the MTR of WM lesions follow different temporal evolutions of demyelination and remyelination [Citation243].
Despite some evidence that active RRMS patients with greater remyelination potential have lower disability levels [Citation244], we still know little about the extent to which remyelination failure contributes to disease progression [Citation245]. Clinical trials of potential remyelinating agents in MS have started to show effects on electrophysiology and MRI (in particular GM lesions) [Citation246,Citation247], but we have not yet identified the right MRI metric that can predict disability worsening within a sufficient time-frame for remyelination clinical trials [Citation248].
5.10. Artificial intelligence and machine learning
Machine learning applications in MS research have been recently reviewed [Citation249], and so will be not discussed in detail here. However, it is worth noting that this is a rapidly advancing area, both in terms of technical developments in machine learning approaches and their applications to MS, including use in the assessment of lesion accrual [Citation250], automating lesion and brain tissue segmentation [Citation251], distinguishing between acute versus chronic lesions [Citation252], and quantifying cortical atrophy [Citation253].
Machine learning techniques may also allow us to derive measures previously only possible using dedicated imaging, for example, synthesizing DIR and PSIR images from standard sequences (such as T1-, T2-weighted and FLAIR images) [Citation254]. In another study, Barnett and colleagues explored the application of AI-based MRI monitoring techniques in MS toward real-world clinical practice and found that these demonstrated superior sensitivity in detecting new, enlarging or contrast-enhancing lesions (subclinical features of MS disease activity) when compared to qualitative reporting techniques [Citation255].
There is also considerable interest in the use of machine learning algorithms for their ability to assemble multiple sources of information to predict clinical disability and future disease progression [Citation256]. Machine learning may also be useful in identifying prognostically relevant features that are otherwise clinically overlooked. For example, in one study conducted by Eshaghi and colleagues [Citation257], unsupervised machine learning was found to be capable of stratifying people with MS based on MRI features (such as the prominence of WM lesion accrual or brain atrophy at a given timepoint) into different subtypes that may better predict disability progression and treatment response than standard clinical phenotypic definitions.
6. Conclusion
The potential role of MRI in predicting and monitoring MS progression has increased significantly with the development of new methods seeking to assess specific elements of MS pathology that are not captured by conventional MRI outcome measures such as WM lesion accrual. However, it remains to be shown which of the new MRI measures are of greatest clinical relevance, and it is still proving very challenging to use advanced MRI acquisitions and analysis protocols in clinical practice, although such methods are being adopted as exploratory outcome measures in clinical trials.
7. Expert opinion
Our understanding of the mechanisms underlying MS progression lags behind relapses, as do the therapeutic options available to treat it, but over the past decade there have been substantial advances in both areas. MRI research has contributed significantly to this, complementing other lines of investigation such as histopathology and PET imaging, allowing us to assess the evolution of pathology in life and its association with clinical outcomes. Importantly, there has been a clear evolution in the way we view relapses and progressive MS as separate entities to one where they can occur simultaneously, and that progression independent of relapses is a major contributor to disability even in people with relapsing-remitting MS. This has important implications for the way treat MS, suggesting that there may be considerable scope for therapies designed to slow or prevent progression to have meaningful impact on disability long before someone transitions from relapsing-remitting to secondary progressive MS.
Neurodegeneration is thought to ultimately underlie irreversible progressive disability in MS, but the processes leading to it remain unclear. Focal WM inflammation, as assessed by lesion counts or volumes only partially predicts neurodegeneration (as reflected by brain atrophy), however it is now clear that this only captures a fraction of inflammatory activity in MS. Significant progress has been made with methods to assess chronic WM and GM lesion activity, meningeal and perivascular inflammation, and other factors that may promote neuronal damage such as iron and sodium accumulation, and work is ongoing trying to determine how these relate to neurodegeneration and each other. This requires long-term studies, given that the clinical manifestations of progressive MS may take decades to unfold, and to date there have been very few MRI studies spanning 10 or more years. Longitudinal studies will allow us to map the evolution of different pathological processes over time, as it is likely that multiple mechanisms will have significant contributory effects to disease progression, and these may change over time and differ between people with MS even if they appear to be running the same clinical course. Ultimately, a combined assessment of multiple MRI or other biomarkers capturing different pathogenic processes may well be required to effectively monitor individual disease progression and assess treatment efficacy.
Analyses methods considering the effects of pathology on neural networks (rather than the brain as a whole) have helped bridge the apparent disconnect between MRI measures and clinical outcomes, but to date have mainly considered effects on WM and GM, and structural and functional measures, separately. There is likely to be further value in combining them, although this a far from simple challenge.
There also remain significant technical barriers in translating advanced MRI research tools, often developed using data from a single research scanner, into routine clinical practice, including the availability and harmonization of MRI acquisition sequences across scanners from multiple manufacturers, and the complexity of image post-processing required. For example, while brain atrophy measures were shown to be clinically relevant more than two decades ago, they have yet to become a universal part of clinical practice, in part due to MRI acquisition and processing factors. Translating newer MRI measures into clinically useable tools will still be more difficult, although as with brain atrophy measures, many are now being adopted in clinical trials, and in doing so they are being refined for use in longitudinal studies undertaken using multiple different MRI scanners. Another barrier to adoption is the need for advanced MRI to deliver clinically actionable information, and so we need clear thresholds that would inform decisions, and we need treatments that target the associated pathological processes.
Machine learning, although relatively recently applied to the study of progressive MS, has already shown great promise allowing us to combine data in new ways to identify previously overlooked features that may help us to better explain clinical progression and its genesis, clinical heterogeneity between people with MS, and overcome some of the challenges in deriving advanced MRI measures from clinical MRI. It also has great potential to help interpret and use the results, while being able to distill multiple sources of information to refine prognostic models.
Article highlights
Multiple sclerosis (MS) is a chronic, inflammatory demyelinating neurodegenerative disease of the central nervous system (CNS) affecting over 130,000 people in the UK.
Rather than relapsing-remitting and progressive MS being considered distinct phenotypes, there is a growing recognition that there is considerable overlap between them, and that substantial progression independent of relapses can occur in relapsing-remitting MS.
There is increasing interest in MRI measures that assess specific pathological processes that may underpin disease progression, for example, compartmentalized inflammation.
Mapping the effects pathology has on neural networks may help bridge the gap between MRI measures and clinical outcomes, but to date studies have mainly considered effects on white matter and gray matter separately rather than together.
There is an emerging role for machine learning in optimizing prognostic models and identifying new or previously overlooked clinically relevant predictive markers of disease progression.
Declaration of interest
N Sahi is a clinical research fellow funded by an MRC grant (Ref: MR/W019906/1) and was previously in a post supported by Merck & Co. (supervised by D Chard and SA Trip). P Ananthavarathan is a clinical research fellow funded by an MS Society grant and was previously in a post supported by Merck & Co. (supervised by D Chard and SA Trip). D Chard is a consultant for Hoffmann-La Roche. In the last three years he has been a consultant for Biogen Idec, has received research funding from Hoffmann-La Roche, the International Progressive MS Alliance, the MS Society, the Medical Research Council, and the National Institute for Health Research (NIHR) University College London Hospitals (UCLH) Biomedical Research Centre, and a speaker’s honorarium from Novartis. He co-supervises a clinical fellowship at the National Hospital for Neurology and Neurosurgery, London, which is supported by Merck & Co. The authors have no other relevant affiliations or financial involvement with any organization or entity with a financial interest in or financial conflict with the subject matter or materials discussed in the manuscript apart from those disclosed.
Reviewer disclosures
Peer reviewers on this manuscript have no relevant financial or other relationships to disclose.
Additional information
Funding
References
- Filippi M, Bar-Or A, Piehl F, et al. Multiple sclerosis. Nat Rev Dis Primers. 2018 Nov 08;4(1):43. doi: 10.1038/s41572-018-0041-4
- Compston A, Coles A. Multiple sclerosis. Lancet. 2002 Apr 6;359(9313):1221–31.
- Mackenzie IS, Morant SV, Bloomfield GA, et al. Incidence and prevalence of multiple sclerosis in the UK 1990–2010: a descriptive study in the general practice research database. J Neurol Neurosurg Psychiatry. 2014;85(1):76–84. doi: 10.1136/jnnp-2013-305450
- Society M. MS in the UK 2023. [cited 2023 Nov 9]. Available from: https://www.mssociety.org.uk/what-we-do/our-work/our-evidence/ms-in-the-uk
- Confavreux C, Vukusic S, Moreau T, et al. Relapses and progression of disability in multiple sclerosis. N Engl J Med. 2000;343(20):1430–1438. doi: 10.1056/NEJM200011163432001
- Lassmann H, van Horssen J, Mahad D. Progressive multiple sclerosis: pathology and pathogenesis. Nat Rev Neurol. 2012 Nov 5;8(11):647–56.
- Cree BAC, Arnold DL, Chataway J, et al. Secondary progressive multiple sclerosis: new insights. Neurology. 2021 Aug 24;97(8):378–388. doi: 10.1212/WNL.0000000000012323
- Antonio S, Anneke N, Martin D, et al. Onset of secondary progressive phase and long-term evolution of multiple sclerosis. J Neurol Neurosurg Psychiatr. 2014;85(1):67.
- Ziemssen T, Bhan V, Chataway J, et al. Secondary progressive multiple sclerosis: a review of clinical characteristics, definition, prognostic tools, and disease-modifying therapies. Neurol(r) Neuroimmunol Neuroinflammation. 2023 Jan;10(1). doi: 10.1212/NXI.0000000000200064
- Tur C, Carbonell-Mirabent P, Cobo-Calvo Á, et al. Association of early progression independent of relapse activity with long-term disability after a first demyelinating event in multiple sclerosis. JAMA Neurol. 2023;80(2):151–160. doi: 10.1001/jamaneurol.2022.4655
- Thompson AJ, Banwell BL, Barkhof F, et al. Diagnosis of multiple sclerosis: 2017 revisions of the McDonald criteria. Lancet Neurol. 2018;17(2):162–173. doi: 10.1016/S1474-4422(17)30470-2
- Brown JW, Chard DT. The role of MRI in the evaluation of secondary progressive multiple sclerosis. Expert Rev Neurother. 2016;16(2):157–71. doi: 10.1586/14737175.2016.1134323
- Combes AJE, Clarke MA, O’Grady KP, et al. Advanced spinal cord MRI in multiple sclerosis: current techniques and future directions. NeuroImage Clin. 2022;36:103244. doi: 10.1016/j.nicl.2022.103244
- Correale J, Gaitán MI, Ysrraelit MC, et al. Progressive multiple sclerosis: from pathogenic mechanisms to treatment. Brain. 2017 Mar 1;140(3):527–546. doi: 10.1093/brain/aww258
- Lassmann H. Pathogenic mechanisms associated with different clinical courses of multiple sclerosis. Front Immunol. 2019;9:3116. doi: 10.3389/fimmu.2018.03116
- Lublin FD, Coetzee T, Cohen JA, et al. The 2013 clinical course descriptors for multiple sclerosis. Neurology. 2020;94(24):1088–1092. doi: 10.1212/WNL.0000000000009636
- Lublin FD, Häring DA, Ganjgahi H, et al. How patients with multiple sclerosis acquire disability. Brain. 2022 Sep 14;145(9):3147–3161. doi: 10.1093/brain/awac016
- van Munster CE, Uitdehaag BM. Outcome measures in clinical trials for multiple sclerosis. CNS Drugs. 2017 Mar;31(3):217–236. doi: 10.1007/s40263-017-0412-5
- Cadavid D, Cohen JA, Freedman MS, et al. The EDSS-Plus, an improved endpoint for disability progression in secondary progressive multiple sclerosis. Mult Scler J. 2017;23(1):94–105. doi: 10.1177/1352458516638941
- Kappos L, Wolinsky JS, Giovannoni G, et al. Contribution of relapse-independent progression vs relapse-associated worsening to overall confirmed disability accumulation in typical relapsing multiple sclerosis in a pooled analysis of 2 randomized clinical trials. JAMA Neurol. 2020 Sep 1;77(9):1132–1140. doi: 10.1001/jamaneurol.2020.1568
- Sorensen PS, Sellebjerg F, Hartung H-P, et al. The apparently milder course of multiple sclerosis: changes in the diagnostic criteria, therapy and natural history. Brain. 2020;143(9):2637–2652. doi: 10.1093/brain/awaa145
- Chung KK, Altmann D, Barkhof F, et al. A 30-year clinical and magnetic resonance imaging observational study of multiple sclerosis and clinically isolated syndromes. Ann Neurol. 2020 Jan;87(1):63–74.
- Haider L, Chung K, Birch G, et al. Linear brain atrophy measures in multiple sclerosis and clinically isolated syndromes: a 30-year follow-up. J Neurol Neurosurg Psychiatry. 2021 Mar 30;92(8):839–846. doi: 10.1136/jnnp-2020-325421
- Confavreux C. Early clinical predictors and progression of irreversible disability in multiple sclerosis: an amnesic process. Brain. 2003 Apr;126(4):770–782. doi: 10.1093/brain/awg081
- Tremlett H, Yousefi M, Devonshire V, et al. Impact of multiple sclerosis relapses on progression diminishes with time. Neurology. 2009 Nov 17;73(20):1616–1623. doi: 10.1212/WNL.0b013e3181c1e44f
- Barnett M, Barnett Y, Reddel S. MRI and laboratory monitoring of disease-modifying therapy efficacy and risks. Curr Opin Neurol. 2022;35(3):278–285. doi: 10.1097/WCO.0000000000001067
- Kalincik T, Diouf I, Sharmin S, et al. Effect of disease-modifying therapy on disability in relapsing-remitting multiple sclerosis over 15 years. Neurology. 2021 Feb 2;96(5):e783–e797. doi: 10.1212/WNL.0000000000011242
- Brown JWL, Coles A, Horakova D, et al. Association of initial disease-modifying therapy with later conversion to secondary progressive multiple sclerosis. JAMA. 2019;321(2):175–187. doi: 10.1001/jama.2018.20588
- Iaffaldano P, Lucisano G, Butzkueven H, et al. Early treatment delays long-term disability accrual in RRMS: results from the BMSD network. Mult Scler. 2021 Sep;27(10):1543–1555.
- Kavaliunas A, Manouchehrinia A, Stawiarz L, et al. Importance of early treatment initiation in the clinical course of multiple sclerosis. Mult Scler. 2017 Aug;23(9):1233–1240.
- Selmaj K, Cree BAC, Barnett M, et al. Multiple sclerosis: time for early treatment with high-efficacy drugs. J Neurol. 2024 Oct 18;271(1):105–115. doi: 10.1007/s00415-023-11969-8
- Mahad DH, Trapp BD, Lassmann H. Pathological mechanisms in progressive multiple sclerosis. Lancet Neurol. 2015 Feb;14(2):183–93. doi: 10.1016/S1474-4422(14)70256-X
- Trapp BD, Peterson J, Ransohoff RM, et al. Axonal transection in the lesions of multiple sclerosis. N Engl J Med. 1998 Jan 29;338(5):278–85. doi: 10.1056/NEJM199801293380502
- Kornek B, Storch MK, Weissert R, et al. Multiple sclerosis and chronic autoimmune encephalomyelitis: a comparative quantitative study of axonal injury in active, inactive, and remyelinated lesions. Am J Pathol. 2000 Jul;157(1):267–726.
- Frischer JM, Weigand SD, Guo Y, et al. Clinical and pathological insights into the dynamic nature of the white matter multiple sclerosis plaque. Ann Neurol. 2015 Nov;78(5):710–721.
- Luchetti S, Fransen NL, van Eden CG, et al. Progressive multiple sclerosis patients show substantial lesion activity that correlates with clinical disease severity and sex: a retrospective autopsy cohort analysis. Acta Neuropathol. 2018 Apr;135(4):511–528.
- Frischer JM, Bramow S, Dal-Bianco A, et al. The relation between inflammation and neurodegeneration in multiple sclerosis brains. Brain. 2009 May;132(5):1175–1189.
- Chard DT, Brex PA, Ciccarelli O, et al. The longitudinal relation between brain lesion load and atrophy in multiple sclerosis: a 14 year follow up study. J Neurol Neurosurg Psychiatry. 2003 Nov;74(11):1551–1554.
- Lassmann H. Cortical lesions in multiple sclerosis: inflammation versus neurodegeneration. Brain. 2012 Oct;135(10):2904–2905. doi: 10.1093/brain/aws260
- Calabrese M, De Stefano N, Atzori M, et al. Detection of cortical inflammatory lesions by double inversion recovery magnetic resonance imaging in patients with multiple sclerosis. Arch Neurol. 2007;64(10):1416–1422. doi: 10.1001/archneur.64.10.1416
- Sethi V, Yousry TA, Muhlert N, et al. Improved detection of cortical MS lesions with phase-sensitive inversion recovery MRI. J Neurol Neurosurg Psychiatry. 2012 Sep;83(9):877–82.
- Bø L, Vedeler CA, Nyland HI, et al. Subpial demyelination in the cerebral cortex of multiple sclerosis patients. J Neuropathol Exp Neurol. 2003 Jul;62(7):723–732.
- Lassmann H. Axonal and neuronal pathology in multiple sclerosis: what have we learnt from animal models. Exp Neurol. 2010 Sep;225(1):2–8. doi: 10.1016/j.expneurol.2009.10.009
- Magliozzi R, Howell OW, Reeves C, et al. A gradient of neuronal loss and meningeal inflammation in multiple sclerosis. Ann Neurol. 2010 Oct;68(4):477–493.
- Filippi M, Brück W, Chard D, et al. Association between pathological and MRI findings in multiple sclerosis. Lancet Neurol. 2019 Feb;18(2):198–210.
- Calabrese M, Rocca MA, Atzori M, et al. A 3-year magnetic resonance imaging study of cortical lesions in relapse-onset multiple sclerosis. Ann Neurol. 2010 Mar;67(3):376–383.
- Chard DT, Miller DH. What lies beneath grey matter atrophy in multiple sclerosis? Brain. 2016 Jan;139(1):7–10. doi: 10.1093/brain/awv354
- Haider L, Prados F, Chung K, et al. Cortical involvement determines impairment 30 years after a clinically isolated syndrome. Brain. 2021 Jun 22;144(5):1384–1395. doi: 10.1093/brain/awab033
- Yong HYF, Yong VW. Mechanism-based criteria to improve therapeutic outcomes in progressive multiple sclerosis. Nat Rev Neurol. 2022 Jan;18(1):40–55. doi: 10.1038/s41582-021-00581-x
- Prineas JW, Kwon EE, Cho E-S, et al. Immunopathology of secondary-progressive multiple sclerosis. Ann Neurol. 2001 Nov 01;50(5):646–657. doi: 10.1002/ana.1255
- van Horssen J, Singh S, van der Pol S, et al. Clusters of activated microglia in normal-appearing white matter show signs of innate immune activation. J Neuroinflammation. 2012 Jul 02;9(1):156. doi: 10.1186/1742-2094-9-156
- Howell OW, Reeves CA, Nicholas R, et al. Meningeal inflammation is widespread and linked to cortical pathology in multiple sclerosis. Brain. 2011 Sep;134(9):2755–2771.
- Pardini M, Brown JWL, Magliozzi R, et al. Surface-in pathology in multiple sclerosis: a new view on pathogenesis? Brain. 2021;144(6):1646–1654. doi: 10.1093/brain/awab025
- Hochmeister S, Grundtner R, Bauer J, et al. Dysferlin is a new marker for leaky brain blood vessels in multiple sclerosis. J Neuropathol Exp Neurol. 2006 Sep;65(9):855–865.
- Magliozzi R, Howell O, Vora A, et al. Meningeal B-cell follicles in secondary progressive multiple sclerosis associate with early onset of disease and severe cortical pathology. Brain. 2006;130(4):1089–1104. doi: 10.1093/brain/awm038
- Magliozzi R, Columba-Cabezas S, Serafini B, et al. Intracerebral expression of CXCL13 and BAFF is accompanied by formation of lymphoid follicle-like structures in the meninges of mice with relapsing experimental autoimmune encephalomyelitis. J Neuroimmunol. 2004 Mar 01;148(1–2):11–23. doi: 10.1016/j.jneuroim.2003.10.056
- Kuerten S, Schickel A, Kerkloh C, et al. Tertiary lymphoid organ development coincides with determinant spreading of the myelin-specific T cell response. Acta Neuropathol. 2012 Dec 01;124(6):861–873. doi: 10.1007/s00401-012-1023-3
- Petzold A. Intrathecal oligoclonal IgG synthesis in multiple sclerosis. J Neuroimmunol. 2013 Sep 15;262(1–2):1–10.
- Absinta M, Vuolo L, Rao A, et al. Gadolinium-based MRI characterization of leptomeningeal inflammation in multiple sclerosis. Neurology. 2015 Jul 7;85(1):18–28. doi: 10.1212/WNL.0000000000001587
- Lucchinetti CF, Popescu BF, Bunyan RF, et al. Inflammatory cortical demyelination in early multiple sclerosis. N Engl J Med. 2011 Dec 8;365(23):2188–2197. doi: 10.1056/NEJMoa1100648
- Serafini B, Rosicarelli B, Magliozzi R, et al. Detection of ectopic B-cell follicles with germinal centers in the meninges of patients with secondary progressive multiple sclerosis. Brain Pathol. 2004 Apr;14(2):164–74.
- Choi SR, Howell OW, Carassiti D, et al. Meningeal inflammation plays a role in the pathology of primary progressive multiple sclerosis. Brain. 2012 Oct;135(10):2925–2937.
- Jessen NA, Munk AS, Lundgaard I, et al. The Glymphatic System: a beginner’s guide. Neurochem Res. 2015 Dec;40(12):2583–2599.
- Taoka T, Masutani Y, Kawai H, et al. Evaluation of glymphatic system activity with the diffusion MR technique: diffusion tensor image analysis along the perivascular space (DTI-ALPS) in Alzheimer’s disease cases. Jpn J Radiol. 2017 Apr;35(4):172–178.
- McKnight CD, Trujillo P, Lopez AM, et al. Diffusion along perivascular spaces reveals evidence supportive of glymphatic function impairment in parkinson disease. Parkinsonism Relat Disord. 2021 Aug;89:98–104.
- Carotenuto A, Cacciaguerra L, Pagani E, et al. Glymphatic system impairment in multiple sclerosis: relation with brain damage and disability. Brain. 2022 Aug 27;145(8):2785–2795. doi: 10.1093/brain/awab454
- Zierfuss B, Wang Z, Jackson AN, et al. Iron in multiple sclerosis - neuropathology, immunology, and real-world considerations. Mult Scler Relat Disord. 2023 Aug 9;78:104934.
- Hametner S, Wimmer I, Haider L, et al. Iron and neurodegeneration in the multiple sclerosis brain. Ann Neurol. 2013 Dec 01;74(6):848–861. doi: 10.1002/ana.23974
- Haider L, Simeonidou C, Steinberger G, et al. Multiple sclerosis deep grey matter: the relation between demyelination, neurodegeneration, inflammation and iron. J Neurol Neurosurg Psychiatry. 2014;85(12):1386–1395. doi: 10.1136/jnnp-2014-307712
- Filippi M, Rocca MA, Ciccarelli O, et al. MRI criteria for the diagnosis of multiple sclerosis: MAGNIMS consensus guidelines. Lancet Neurol. 2016;15(3):292–303. doi: 10.1016/S1474-4422(15)00393-2
- Paty DW, Oger JJ, Kastrukoff LF, et al. MRI in the diagnosis of MS: a prospective study with comparison of clinical evaluation, evoked potentials, oligoclonal banding, and CT. Neurology. 1988 Feb;38(2):180–185.
- Fazekas F, Offenbacher H, Fuchs S, et al. Criteria for an increased specificity of MRI interpretation in elderly subjects with suspected multiple sclerosis. Neurology. 1988 Dec;38(12):1822–1825.
- Barkhof F, Filippi M, Miller DH, et al. Comparison of MRI criteria at first presentation to predict conversion to clinically definite multiple sclerosis. Brain. 1997 Nov;120(11):2059–2069.
- Silver N, Lai M, Symms M, et al. Serial gadolinium-enhanced and magnetization transfer imaging to investigate the relationship between the duration of blood-brain barrier disruption and extent of demyelination in new multiple sclerosis lesions. J Neurol. 1999 Aug;246(8):728–730.
- Giorgio A, Stromillo ML, Bartolozzi ML, et al. Relevance of hypointense brain MRI lesions for long-term worsening of clinical disability in relapsing multiple sclerosis. Mult Scler. 2014 Feb;20(2):214–219.
- Tintoré M, Rovira A, Río J, et al. Baseline MRI predicts future attacks and disability in clinically isolated syndromes. Neurology. 2006 Sep 26;67(6):968–972. doi: 10.1212/01.wnl.0000237354.10144.ec
- Fisniku LK, Brex PA, Altmann DR, et al. Disability and T2 MRI lesions: a 20-year follow-up of patients with relapse onset of multiple sclerosis. Brain. 2008 Mar;131(3):808–817.
- Minneboo A, Barkhof F, Polman CH, et al. Infratentorial lesions predict long-term disability in patients with initial findings suggestive of multiple sclerosis. Arch Neurol. 2004;61(2):217–221. doi: 10.1001/archneur.61.2.217
- Swanton JK, Fernando KT, Dalton CM, et al. Early MRI in optic neuritis: the risk for disability. Neurology. 2009 Feb 10;72(6):542–550. doi: 10.1212/01.wnl.0000341935.41852.82
- Chard D, Trip SA. Resolving the clinico-radiological paradox in multiple sclerosis. F1000Res. 2017;6:1828. doi: 10.12688/f1000research.11932.1
- Clarke MA, Pareto D, Pessini-Ferreira L, et al. Value of 3T susceptibility-weighted imaging in the diagnosis of multiple sclerosis. AJNR Am J Neuroradiol. 2020 Jun;41(6):1001–1008.
- Ng Kee Kwong KC, Mollison D, Meijboom R, et al. The prevalence of paramagnetic rim lesions in multiple sclerosis: a systematic review and meta-analysis. PLoS One. 2021;16(9):e0256845. doi: 10.1371/journal.pone.0256845
- Dal-Bianco A, Grabner G, Kronnerwetter C, et al. Slow expansion of multiple sclerosis iron rim lesions: pathology and 7 T magnetic resonance imaging. Acta Neuropathol. 2017 Jan;133(1):25–42.
- Absinta M, Sati P, Schindler M, et al. Persistent 7-tesla phase rim predicts poor outcome in new multiple sclerosis patient lesions. J Clin Invest. 2016 Jul 1;126(7):2597–2609. doi: 10.1172/JCI86198
- Kutzelnigg A, Lucchinetti CF, Stadelmann C, et al. Cortical demyelination and diffuse white matter injury in multiple sclerosis. Brain. 2005;128(11):2705–2712. doi: 10.1093/brain/awh641
- Elliott C, Belachew S, Wolinsky JS, et al. Chronic white matter lesion activity predicts clinical progression in primary progressive multiple sclerosis. Brain. 2019;142(9):2787–2799. doi: 10.1093/brain/awz212
- Hametner S, Dal Bianco A, Trattnig S, et al. Iron related changes in MS lesions and their validity to characterize MS lesion types and dynamics with Ultra-high field magnetic resonance imaging. Brain Pathol. 2018 Sep;28(5):743–749.
- Mehta V, Pei W, Yang G, et al. Iron is a sensitive biomarker for inflammation in multiple sclerosis lesions. PLoS One. 2013;8(3):e57573. doi: 10.1371/journal.pone.0057573
- Absinta M, Sati P, Masuzzo F, et al. Association of chronic active multiple sclerosis lesions with disability in vivo. JAMA Neurol. 2019 Dec 1;76(12):1474–1483. doi: 10.1001/jamaneurol.2019.2399
- Elliott C, Wolinsky JS, Hauser SL, et al. Slowly expanding/evolving lesions as a magnetic resonance imaging marker of chronic active multiple sclerosis lesions. Mult Scler. 2019 Dec;25(14):1915–1925.
- Preziosa P, Pagani E, Meani A, et al. Slowly expanding lesions predict 9-year multiple sclerosis disease progression. Neurol(r) Neuroimmunol Neuroinflammation. 2022 Mar;9(2). doi: 10.1212/NXI.0000000000001139
- Klistorner S, Barnett MH, Yiannikas C, et al. Expansion of chronic lesions is linked to disease progression in relapsing-remitting multiple sclerosis patients. Mult Scler. 2021 Sep;27(10):1533–1542.
- Geurts JJ, Bö L, Pouwels PJ, et al. Cortical lesions in multiple sclerosis: combined postmortem MR imaging and histopathology. AJNR Am J Neuroradiol. 2005 Mar;26(3):572–577.
- Klaver R, De Vries HE, Schenk GJ, et al. Grey matter damage in multiple sclerosis. Prion. 2013 Jan 01;7(1):66–75. doi: 10.4161/pri.23499
- Geurts JJG, Pouwels PJW, Uitdehaag BMJ, et al. Intracortical lesions in multiple sclerosis: improved detection with 3D double inversion-recovery MR imaging. Radiology. 2005 Jul 01;236(1):254–260. doi: 10.1148/radiol.2361040450
- Bouman PM, Steenwijk MD, Pouwels PJW, et al. Histopathology-validated recommendations for cortical lesion imaging in multiple sclerosis. Brain. 2020 Oct 1;143(10):2988–2997. doi: 10.1093/brain/awaa233
- Seewann A, Kooi EJ, Roosendaal SD, et al. Postmortem verification of MS cortical lesion detection with 3D DIR. Neurology. 2012 Jan 31;78(5):302–308. doi: 10.1212/WNL.0b013e31824528a0
- Springer E, Dymerska B, Cardoso PL, et al. Comparison of routine brain imaging at 3 T and 7 T. Invest Radiol. 2016 Aug;51(8):469–482.
- Madsen MAJ, Wiggermann V, Bramow S, et al. Imaging cortical multiple sclerosis lesions with ultra-high field MRI. NeuroImage Clin. 2021 Jan 01;32:102847.
- Kilsdonk ID, Jonkman LE, Klaver R, et al. Increased cortical grey matter lesion detection in multiple sclerosis with 7 T MRI: a post-mortem verification study. Brain. 2016;139(5):1472–1481. doi: 10.1093/brain/aww037
- Pitt D, Boster A, Pei W, et al. Imaging cortical lesions in multiple sclerosis with ultra-high-field magnetic resonance imaging. Arch Neurol. 2010 Jul;67(7):812–818.
- Harrison DM, Roy S, Oh J, et al. Association of Cortical Lesion Burden on 7-T magnetic resonance imaging with cognition and disability in multiple sclerosis. JAMA Neurol. 2015 Sep;72(9):1004–1112.
- Granberg T, Fan Q, Treaba CA, et al. In vivo characterization of cortical and white matter neuroaxonal pathology in early multiple sclerosis. Brain. 2017 Nov 1;140(11):2912–2926. doi: 10.1093/brain/awx247
- Sethi V, Yousry T, Muhlert N, et al. A longitudinal study of cortical grey matter lesion subtypes in relapse-onset multiple sclerosis. J Neurol Neurosurg Psychiatry. 2016 Jul;87(7):750–753.
- Treaba CA, Granberg TE, Sormani MP, et al. Longitudinal characterization of Cortical Lesion Development and evolution in multiple sclerosis with 7.0-T MRI. Radiology. 2019 Jun;291(3):740–749.
- Calabrese M, Rocca MA, Atzori M, et al. A 3-year magnetic resonance imaging study of cortical lesions in relapse-onset multiple sclerosis. Ann Neurol. 2010 Mar 01;67(3):376–383. doi: 10.1002/ana.21906
- Mike A, Glanz BI, Hildenbrand P, et al. Identification and clinical impact of multiple sclerosis cortical lesions as assessed by routine 3T MR Imaging. Am J Neuroradiol. 2011;32(3):515–521. doi: 10.3174/ajnr.A2340
- Treaba CA, Herranz E, Barletta VT, et al. The relevance of multiple sclerosis cortical lesions on cortical thinning and their clinical impact as assessed by 7.0-T MRI. J Neurol. 2021 Jul 01;268(7):2473–2481. doi: 10.1007/s00415-021-10400-4
- Calabrese M, Agosta F, Rinaldi F, et al. Cortical lesions and atrophy associated with cognitive impairment in relapsing-remitting multiple sclerosis. Arch Neurol. 2009 Sep;66(9):1144–1150.
- Curti E, Graziuso S, Tsantes E, et al. Correlation between cortical lesions and cognitive impairment in multiple sclerosis. Brain Behav. 2018 Jun;8(6):e00955.
- Treaba CA, Conti A, Klawiter EC, et al. Cortical and phase rim lesions on 7 T MRI as markers of multiple sclerosis disease progression. Brain Commun. 2021;3(3):fcab134. doi: 10.1093/braincomms/fcab134
- Ziccardi S, Pisani AI, Schiavi GM, et al. Cortical lesions at diagnosis predict long-term cognitive impairment in multiple sclerosis: a 20-year study. Euro J of Neurol. 2023 May 01;30(5):1378–1388. doi: 10.1111/ene.15697
- Pisani AI, Scalfari A, Crescenzo F, et al. A novel prognostic score to assess the risk of progression in relapsing-remitting multiple sclerosis patients. Eur J Neurol. 2021 Aug;28(8):2503–2512.
- Peterson JW, Bö L, Mörk S, et al. Transected neurites, apoptotic neurons, and reduced inflammation in cortical multiple sclerosis lesions. Ann Neurol. 2001 Sep;50(3):389–400.
- Kooi EJ, Strijbis EM, van der Valk P, et al. Heterogeneity of cortical lesions in multiple sclerosis: clinical and pathologic implications. Neurology. 2012 Sep 25;79(13):1369–1376. doi: 10.1212/WNL.0b013e31826c1b1c
- Pitt D, Boster A, Pei W, et al. Imaging cortical lesions in multiple sclerosis with ultra–high-Field magnetic resonance imaging. Arch Neurol. 2010;67(7):812–818. doi: 10.1001/archneurol.2010.148
- Castellaro M, Magliozzi R, Palombit A, et al. Heterogeneity of cortical lesion susceptibility mapping in multiple sclerosis. AJNR Am J Neuroradiol. 2017 Jun;38(6):1087–1095.
- Bodini B, Tonietto M, Airas L, et al. Positron emission tomography in multiple sclerosis — straight to the target. Nat Rev Neurol. 2021 Nov 01;17(11):663–675. doi: 10.1038/s41582-021-00537-1
- Herranz E, Giannì C, Louapre C, et al. Neuroinflammatory component of gray matter pathology in multiple sclerosis. Ann Neurol. 2016 Nov;80(5):776–790.
- Fischer MT, Sharma R, Lim JL, et al. NADPH oxidase expression in active multiple sclerosis lesions in relation to oxidative tissue damage and mitochondrial injury. Brain. 2012 Mar;135(3):886–899.
- Airas L, Yong VW. Microglia in multiple sclerosis - pathogenesis and imaging. Curr Opin Neurol. 2022 Jun 1;35(3):299–306.
- Datta G, Colasanti A, Rabiner EA, et al. Neuroinflammation and its relationship to changes in brain volume and white matter lesions in multiple sclerosis. Brain. 2017 Nov 1;140(11):2927–2938. doi: 10.1093/brain/awx228
- Harrison DM, Wang KY, Fiol J, et al. Leptomeningeal enhancement at 7T in multiple sclerosis: frequency, morphology, and relationship to cortical volume. J Neuroimaging. 2017 Sep;27(5):461–468.
- Makshakov G, Magonov E, Totolyan N, et al. Leptomeningeal contrast enhancement is associated with disability progression and Grey Matter Atrophy in multiple sclerosis. Neurol Res Int. 2017 Oct 02;2017:1–7.
- Zivadinov R, Ramasamy DP, Vaneckova M, et al. Leptomeningeal contrast enhancement is associated with progression of cortical atrophy in MS: a retrospective, pilot, observational longitudinal study. Mult Scler. 2017 Sep 01;23(10):1336–1345. doi: 10.1177/1352458516678083
- Jonas SN, Izbudak I, Frazier AA, et al. Longitudinal persistence of meningeal enhancement on postcontrast 7T 3D-FLAIR MRI in multiple sclerosis. Am J Neuroradiol. 2018;39(10):1799. doi: 10.3174/ajnr.A5796
- Hildesheim FE, Ramasamy DP, Bergsland N, et al. Leptomeningeal, dura mater and meningeal vessel wall enhancements in multiple sclerosis. Multi Sclerosis Relat Disord. 2021;47:47. doi: 10.1016/j.msard.2020.102653
- Zivadinov R, Bergsland N, Carl E, et al. Effect of Teriflunomide and dimethyl fumarate on cortical atrophy and leptomeningeal inflammation in multiple sclerosis: a retrospective, observational, case-control Pilot study. J Clin Med. 2019;8(3):344. doi: 10.3390/jcm8030344
- Bhargava P, Wicken C, Smith MD, et al. Trial of intrathecal rituximab in progressive multiple sclerosis patients with evidence of leptomeningeal contrast enhancement. Multi Sclerosis Relat Disord. 2019;30:136–140. doi: 10.1016/j.msard.2019.02.013
- Zivadinov R, Jakimovski D, Ramanathan M, et al. Effect of ocrelizumab on leptomeningeal inflammation and humoral response to Epstein-Barr virus in multiple sclerosis. A pilot study. Multi Sclerosis Relat Disord. 2022;67:67. doi: 10.1016/j.msard.2022.104094
- Favaretto A, Lazzarotto A, Riccardi A, et al. Enlarged Virchow Robin spaces associate with cognitive decline in multiple sclerosis. PLoS One. 2017;12(10):e0185626. doi: 10.1371/journal.pone.0185626
- Conforti R, Cirillo M, Sardaro A, et al. Dilated perivascular spaces and fatigue: is there a link? magnetic resonance retrospective 3Tesla study. Neuroradiology. 2016 Sep 01;58(9):859–866. doi: 10.1007/s00234-016-1711-0
- Wuerfel J, Haertle M, Waiczies H, et al. Perivascular spaces—MRI marker of inflammatory activity in the brain? Brain. 2008;131(9):2332–2340. doi: 10.1093/brain/awn171
- Kilsdonk ID, Steenwijk MD, Pouwels PJW, et al. Perivascular spaces in MS patients at 7 tesla MRI: a marker of neurodegeneration? Mult Scler. 2015 Feb 01;21(2):155–162. doi: 10.1177/1352458514540358
- Absinta M, Lassmann H, Trapp BD. Mechanisms underlying progression in multiple sclerosis. Curr Opin Neurol. 2020 Jun;33(3):277–285. doi: 10.1097/WCO.0000000000000818
- Popescu V, Klaver R, Voorn P, et al. What drives MRI-measured cortical atrophy in multiple sclerosis? Mult Scler. 2015 Sep;21(10):1280–1290.
- Klaver R, Popescu V, Voorn P, et al. Neuronal and axonal loss in normal-appearing gray matter and subpial lesions in multiple sclerosis. J Neuropathol Exp Neurol. 2015 May;74(5):453–458.
- Popescu V, Klaver R, Versteeg A, et al. Postmortem validation of MRI cortical volume measurements in MS. Hum Brain Mapp. 2016 Jun;37(6):2223–2233.
- Sastre-Garriga J, Pareto D, Battaglini M, et al. MAGNIMS consensus recommendations on the use of brain and spinal cord atrophy measures in clinical practice. Nat Rev Neurol. 2020 Mar;16(3):171–182.
- Cree BAC, Hollenbach JA, Bove R, et al. Silent progression in disease activity-free relapsing multiple sclerosis. Ann Neurol. 2019 May;85(5):653–666.
- Ghione E, Bergsland N, Dwyer MG, et al. Brain atrophy is associated with disability progression in patients with MS followed in a clinical routine. AJNR Am J Neuroradiol. 2018 Dec;39(12):2237–2242.
- Ghione E, Bergsland N, Dwyer MG, et al. Disability improvement is associated with less brain atrophy development in multiple sclerosis. AJNR Am J Neuroradiol. 2020 Sep;41(9):1577–1583.
- Zivadinov R, Bergsland N, Korn JR, et al. Feasibility of brain atrophy measurement in clinical routine without prior standardization of the MRI protocol: results from MS-MRIUS, a longitudinal observational, multicenter real-world outcome study in patients with relapsing-remitting MS. AJNR Am J Neuroradiol. 2018 Feb;39(2):289–295.
- Eshaghi A, Prados F, Brownlee WJ, et al. Deep gray matter volume loss drives disability worsening in multiple sclerosis. Ann Neurol. 2018 Feb;83(2):210–222. doi: 10.1002/ana.25145
- Rocca MA, Mesaros S, Pagani E, et al. Thalamic damage and long-term progression of disability in multiple sclerosis. Radiology. 2010 Nov;257(2):463–469.
- Schoonheim MM, Pinter D, Prouskas SE, et al. Disability in multiple sclerosis is related to thalamic connectivity and cortical network atrophy. Mult Scler. 2022 Jan 01;28(1):61–70. doi: 10.1177/13524585211008743
- Hänninen K, Viitala M, Paavilainen T, et al. Thalamic atrophy predicts 5-year disability progression in multiple sclerosis. Front Neurol. 2020;11:606. doi: 10.3389/fneur.2020.00606
- Hänninen K, Viitala M, Paavilainen T, et al. Thalamic atrophy without whole brain atrophy is associated with absence of 2-year NEDA in multiple sclerosis [original research]. Front Neurol. 2019 May 03;10:10.
- Gaetano L, Häring DA, Radue EW, et al. Fingolimod effect on gray matter, thalamus, and white matter in patients with multiple sclerosis. Neurology. 2018 Apr 10;90(15):e1324–e1332. doi: 10.1212/WNL.0000000000005292
- Mehndiratta A, Treaba CA, Barletta V, et al. Characterization of thalamic lesions and their correlates in multiple sclerosis by ultra-high-field MRI. Mult Scler. 2021 Apr;27(5):674–683.
- Steenwijk MD, Geurts JJG, Daams M, et al. Cortical atrophy patterns in multiple sclerosis are non-random and clinically relevant. Brain. 2016;139(1):115–126. doi: 10.1093/brain/awv337
- Elisa C, Jonathan S, Carmen T, et al. Predicting disability progression and cognitive worsening in multiple sclerosis using patterns of grey matter volumes. J Neurol Neurosurg Psychiatry. 2021;92(9):995. doi: 10.1136/jnnp-2020-325610
- Bergsland N, Horakova D, Dwyer MG, et al. Gray matter atrophy patterns in multiple sclerosis: a 10-year source-based morphometry study. NeuroImage Clin. 2018 Jan 01;17:444–451.
- Chard DT, Alahmadi AAS, Audoin B, et al. Mind the gap: from neurons to networks to outcomes in multiple sclerosis. Nat Rev Neurol. 2021 Mar 01;17(3):173–184. doi: 10.1038/s41582-020-00439-8
- Roosendaal SD, Schoonheim MM, Hulst HE, et al. Resting state networks change in clinically isolated syndrome. Brain. 2010 Jun;133(6):1612–1621.
- Faivre A, Rico A, Zaaraoui W, et al. Assessing brain connectivity at rest is clinically relevant in early multiple sclerosis. Mult Scler. 2012 Sep;18(9):1251–1258.
- Liu Y, Wang H, Duan Y, et al. Functional brain network alterations in clinically isolated syndrome and multiple sclerosis: a graph-based connectome Study. Radiology. 2017 Feb;282(2):534–541.
- Faivre A, Robinet E, Guye M, et al. Depletion of brain functional connectivity enhancement leads to disability progression in multiple sclerosis: a longitudinal resting-state fMRI study. Mult Scler. 2016 Nov;22(13):1695–1708.
- Tewarie P, Steenwijk MD, Tijms BM, et al. Disruption of structural and functional networks in long-standing multiple sclerosis. Hum Brain Mapp. 2014 Dec;35(12):5946–5961.
- Rimkus CM, Schoonheim MM, Steenwijk MD, et al. Gray matter networks and cognitive impairment in multiple sclerosis. Mult Scler. 2019 Mar;25(3):382–391.
- Fleischer V, Koirala N, Droby A, et al. Longitudinal cortical network reorganization in early relapsing–remitting multiple sclerosis. Ther Adv Neurol Disord. 2019 Jan 01;12:1756286419838673.
- Tur C, Kanber B, Eshaghi A, et al. Clinical relevance of cortical network dynamics in early primary progressive MS. Mult Scler. 2020 Apr 01;26(4):442–456. doi: 10.1177/1352458519831400
- Schoonheim MM, Broeders TAA, Geurts JJG. The network collapse in multiple sclerosis: an overview of novel concepts to address disease dynamics. NeuroImage Clin. 2022;35:103108. doi: 10.1016/j.nicl.2022.103108
- Kuceyeski A, Monohan E, Morris E, et al. Baseline biomarkers of connectome disruption and atrophy predict future processing speed in early multiple sclerosis. NeuroImage Clin. 2018 Jan 01;19:417–424.
- Rise HH, Brune S, Chien C, et al. Brain disconnectome mapping derived from white matter lesions and serum neurofilament light levels in multiple sclerosis: a longitudinal multicenter study. NeuroImage Clin. 2022 Jan 01;35:103099.
- Dwyer MG, Bergsland N, Ramasamy DP, et al. Atrophied brain lesion volume: a new imaging biomarker in multiple sclerosis. J Neuroimaging. 2018 Sep;28(5):490–495.
- Tavazzi E, Bergsland N, Kuhle J, et al. A multimodal approach to assess the validity of atrophied T2-lesion volume as an MRI marker of disease progression in multiple sclerosis. J Neurol. 2020 Mar 01;267(3):802–811. doi: 10.1007/s00415-019-09643-z
- Genovese AV, Hagemeier J, Bergsland N, et al. Atrophied brain T2 lesion volume at MRI is associated with disability progression and conversion to secondary progressive multiple sclerosis. Radiology. 2019 Nov;293(2):424–433.
- Zivadinov R, Horakova D, Bergsland N, et al. A serial 10-year follow-up study of atrophied brain lesion volume and disability progression in patients with relapsing-remitting MS. AJNR Am J Neuroradiol. 2019 Mar;40(3):446–452.
- Allen IV, McKeown SR. A histological, histochemical and biochemical study of the macroscopically normal white matter in multiple sclerosis. J Neurolog Sci. 1979 Mar;41(1):81–91. doi: 10.1016/0022-510X(79)90142-4
- Granziera C, Wuerfel J, Barkhof F, et al. Quantitative magnetic resonance imaging towards clinical application in multiple sclerosis. Brain. 2021;144(5):1296–1311. doi: 10.1093/brain/awab029
- Kolind S, Matthews L, Johansen-Berg H, et al. Myelin water imaging reflects clinical variability in multiple sclerosis. Neuroimage. 2012 Mar;60(1):263–270.
- Bodini B, Khaleeli Z, Cercignani M, et al. Exploring the relationship between white matter and gray matter damage in early primary progressive multiple sclerosis: an in vivo study with TBSS and VBM. Hum Brain Mapp. 2009 Sep;30(9):2852–2861.
- Schmierer K, Wheeler-Kingshott CA, Boulby PA, et al. Diffusion tensor imaging of post mortem multiple sclerosis brain. Neuroimage. 2007 Apr 1;35(2):467–477. doi: 10.1016/j.neuroimage.2006.12.010
- Bodini B, Cercignani M, Toosy A, et al. A novel approach with “skeletonised MTR” measures tract-specific microstructural changes in early primary-progressive MS. Hum Brain Mapp. 2014 Feb;35(2):723–733.
- Harel A, Sperling D, Petracca M, et al. Brain microstructural injury occurs in patients with RRMS despite ‘no evidence of disease activity’. J Neurol Neurosurg Psychiatry. 2018 Sep;89(9):977–982.
- Eijlers AJC, van Geest Q, Dekker I, et al. Predicting cognitive decline in multiple sclerosis: a 5-year follow-up study. Brain. 2018 Sep 1;141(9):2605–2618. doi: 10.1093/brain/awy202
- Rocca MA, Sormani MP, Rovaris M, et al. Long-term disability progression in primary progressive multiple sclerosis: a 15-year study. Brain. 2017 Nov 1;140(11):2814–2819. doi: 10.1093/brain/awx250
- Schneider T, Brownlee W, Zhang H, et al. Sensitivity of multi-shell NODDI to multiple sclerosis white matter changes: a pilot study. Funct Neurol. 2017 Apr;32(2):97–101.
- Caranova M, Soares JF, Batista S, et al. A systematic review of microstructural abnormalities in multiple sclerosis detected with NODDI and DTI models of diffusion-weighted magnetic resonance imaging. Magn Reson Imaging. 2023 Dec 01;104:61–71.
- Seyedmirzaei H, Nabizadeh F, Aarabi MH, et al. Neurite orientation dispersion and density imaging in multiple sclerosis: a systematic review. J Magn Reson Imaging. 2023 Oct 01;58(4):1011–1029. doi: 10.1002/jmri.28727
- Spanò B, Giulietti G, Pisani V, et al. Disruption of neurite morphology parallels MS progression. Neurol(r) Neuroimmunol Neuroinflammation. 2018 Nov;5(6):e502.
- Johnson D, Ricciardi A, Brownlee W, et al. Comparison of neurite orientation dispersion and density imaging and two-compartment spherical mean technique parameter maps in multiple sclerosis. Front Neurol. 2021;12:662855. doi: 10.3389/fneur.2021.662855
- Drayer B, Burger P, Hurwitz B, et al. Reduced Signal Intensity on MR images of thalamus and putamen in multiple sclerosis: increased iron content? Am J Neuroradiol. 1987;8(3):413–419.
- Grimaud J, Millar J, Thorpe JW, et al. Signal intensity on MRI of basal ganglia in multiple sclerosis. J Neurol Neurosurg Psychiatry. 1995;59(3):306–308. doi: 10.1136/jnnp.59.3.306
- Bakshi R, Dmochowski J, Shaikh ZA, et al. Gray matter T2 hypointensity is related to plaques and atrophy in the brains of multiple sclerosis patients. J Neurol Sci. 2001 Mar 15;185(1):19–26. doi: 10.1016/S0022-510X(01)00477-4
- Bakshi R, Benedict RHB, Bermel RA, et al. T2 hypointensity in the deep gray matter of patients with multiple sclerosis: a quantitative magnetic resonance imaging study. Arch Neurol. 2002;59(1):62–68. doi: 10.1001/archneur.59.1.62
- Zhang Y, Zabad RK, Wei X, et al. Deep grey matter `black T2` on 3 tesla magnetic resonance imaging correlates with disability in multiple sclerosis. Mult Scler. 2007 Aug 01;13(7):880–883. doi: 10.1177/1352458507076411
- Bakshi R, Shaikh ZA, Janardhan V. MRI T2 shortening (‘black T2’) in multiple sclerosis: frequency, location, and clinical correlation. Neuroreport. 2000;11(1):15–21. doi: 10.1097/00001756-200001170-00004
- Ceccarelli A, Filippi M, Neema M, et al. T2 hypointensity in the deep gray matter of patients with benign multiple sclerosis. Mult Scler. 2009 Jun 01;15(6):678–686. doi: 10.1177/1352458509103611
- Brass SD, Benedict RH, Weinstock-Guttman B, et al. Cognitive impairment is associated with subcortical magnetic resonance imaging grey matter T2 hypointensity in multiple sclerosis. Mult Scler. 2006 Aug 01;12(4):437–444. doi: 10.1191/135248506ms1301oa
- Zhang Y, Metz LM, Yong VW, et al. 3T deep gray matter T2 hypointensity correlates with disability over time in stable relapsing–remitting multiple sclerosis: a 3-year pilot study. J Neurolog Sci. 2010 Oct 15;297(1–2):76–81. doi: 10.1016/j.jns.2010.07.014
- Neema M, Arora A, Healy BC, et al. Deep gray matter involvement on brain MRI scans is associated with clinical progression in multiple sclerosis. J Neuroimaging. 2009 Jan 01;19(1):3–8. doi: 10.1111/j.1552-6569.2008.00296.x
- Bermel RA, Puli SR, Rudick RA, et al. Prediction of longitudinal brain atrophy in multiple sclerosis by gray matter magnetic resonance imaging T2 hypointensity. Arch Neurol. 2005;62(9):1371–1376. doi: 10.1001/archneur.62.9.1371
- Hametner S, Endmayr V, Deistung A, et al. The influence of brain iron and myelin on magnetic susceptibility and effective transverse relaxation - a biochemical and histological validation study. Neuroimage. 2018 Oct 1;179:117–133.
- Al-Radaideh AM, Wharton SJ, Lim S-Y, et al. Increased iron accumulation occurs in the earliest stages of demyelinating disease: an ultra-high field susceptibility mapping study in clinically isolated syndrome. Mult Scler. 2013 Jun 01;19(7):896–903. doi: 10.1177/1352458512465135
- Elkady AM, Cobzas D, Sun H, et al. Progressive iron accumulation across multiple sclerosis phenotypes revealed by sparse classification of deep gray matter. J Magn Reson Imaging. 2017 Nov 01;46(5):1464–1473. doi: 10.1002/jmri.25682
- Zivadinov R, Tavazzi E, Bergsland N, et al. Brain iron at quantitative MRI is associated with disability in multiple sclerosis. Radiology. 2018 Nov 01;289(2):487–496. doi: 10.1148/radiol.2018180136
- Schweser F, Raffaini Duarte Martins AL, Hagemeier J, et al. Mapping of thalamic magnetic susceptibility in multiple sclerosis indicates decreasing iron with disease duration: a proposed mechanistic relationship between inflammation and oligodendrocyte vitality. Neuroimage. 2018 Feb 15;167:438–452.
- Paling D, Tozer D, Wheeler-Kingshott C, et al. Reduced R2’ in multiple sclerosis normal appearing white matter and lesions may reflect decreased myelin and iron content. J Neurol Neurosurg Psychiatry. 2012 Aug;83(8):785–792.
- Chen W, Zhang Y, Mu K, et al. Quantifying the susceptibility variation of normal-appearing white matter in multiple sclerosis by quantitative susceptibility mapping. AJR Am J Roentgenol. 2017 Oct;209(4):889–894.
- Möller HE, Bossoni L, Connor JR, et al. Iron, myelin, and the brain: neuroimaging meets neurobiology. Trends Neurosci. 2019 Jun;42(6):384–401.
- Lazari A, Lipp I. Can MRI measure myelin? Systematic review, qualitative assessment, and meta-analysis of studies validating microstructural imaging with myelin histology. Neuroimage. 2021 Apr 15;230:117744. doi: 10.1016/j.neuroimage.2021.117744
- van der Weijden CWJ, García DV, Borra RJH, et al. Myelin quantification with MRI: a systematic review of accuracy and reproducibility. Neuroimage. 2021 Feb 01;226:117561.
- Amann M, Papadopoulou A, Andelova M, et al. Magnetization transfer ratio in lesions rather than normal-appearing brain relates to disability in patients with multiple sclerosis. J Neurol. 2015 Aug 01;262(8):1909–1917. doi: 10.1007/s00415-015-7793-5
- Santos AC, Narayanan S, de Stefano N, et al. Magnetization transfer can predict clinical evolution in patients with multiple sclerosis. J Neurol. 2002 Jun;249(6):662–8.
- Yaldizli Ö, Pardini M, Sethi V, et al. Characteristics of lesional and extra-lesional cortical grey matter in relapsing-remitting and secondary progressive multiple sclerosis: a magnetisation transfer and diffusion tensor imaging study. Mult Scler. 2016 Feb;22(2):150–159.
- Filippi M, Preziosa P, Copetti M, et al. Gray matter damage predicts the accumulation of disability 13 years later in MS. Neurology. 2013 Nov 12;81(20):1759–1767. doi: 10.1212/01.wnl.0000435551.90824.d0
- Hayton T, Furby J, Smith KJ, et al. Grey matter magnetization transfer ratio independently correlates with neurological deficit in secondary progressive multiple sclerosis. J Neurol. 2009 Mar;256(3):427–435.
- Rovaris M, Judica E, Sastre-Garriga J, et al. Large-scale, multicentre, quantitative MRI study of brain and cord damage in primary progressive multiple sclerosis. Mult Scler. 2008 May;14(4):455–464.
- Agosta F, Rovaris M, Pagani E, et al. Magnetization transfer MRI metrics predict the accumulation of disability 8 years later in patients with multiple sclerosis. Brain. 2006;129(10):2620–2627. doi: 10.1093/brain/awl208
- Khaleeli Z, Altmann DR, Cercignani M, et al. Magnetization transfer ratio in gray matter: a potential surrogate marker for progression in early primary progressive multiple sclerosis. Arch Neurol. 2008 Nov;65(11):1454–1459.
- Varma G, Duhamel G, de Bazelaire C, et al. Magnetization transfer from inhomogeneously broadened lines: a potential marker for myelin. Magn Reson Med. 2015 Feb 01;73(2):614–622. doi: 10.1002/mrm.25174
- Van Obberghen E, McHinda S, le Troter A, et al. Evaluation of the sensitivity of inhomogeneous magnetization transfer (ihMT) MRI for multiple sclerosis. AJNR Am J Neuroradiol. 2018 Apr;39(4):634–641.
- Zhang L, Wen B, Chen T, et al. A comparison study of inhomogeneous magnetization transfer (ihMT) and magnetization transfer (MT) in multiple sclerosis based on whole brain acquisition at 3.0 T. Magn Reson Imaging. 2020 Jul 01;70:43–49.
- Kitzler HH, Su J, Zeineh M, et al. Deficient MWF mapping in multiple sclerosis using 3D whole-brain multi-component relaxation MRI. Neuroimage. 2012 Feb 1;59(3):2670–2677. doi: 10.1016/j.neuroimage.2011.08.052
- Abel S, Vavasour I, Lee LE, et al. Myelin damage in normal appearing white matter contributes to impaired cognitive processing speed in multiple sclerosis. J Neuroimaging. 2020 Mar 01;30(2):205–211. doi: 10.1111/jon.12679
- Laule C, Vavasour IM, Zhao Y, et al. Two-year study of cervical cord volume and myelin water in primary progressive multiple sclerosis. Mult Scler. 2010 Jun;16(6):670–677.
- Vavasour IM, Huijskens SC, Li DKB, et al. Global loss of myelin water over 5 years in multiple sclerosis normal-appearing white matter. Mult Scler. 2018 Oct 01;24(12):1557–1568. doi: 10.1177/1352458517723717
- Matthews L, Kolind S, Brazier A, et al. Imaging surrogates of disease activity in Neuromyelitis Optica allow distinction from multiple sclerosis. PloS One. 2015;10(9):e0137715. doi: 10.1371/journal.pone.0137715
- Liu Z, Pardini M, Yaldizli Ö, et al. Magnetization transfer ratio measures in normal-appearing white matter show periventricular gradient abnormalities in multiple sclerosis. Brain. 2015;138(5):1239–1246. doi: 10.1093/brain/awv065
- Brown JWL, Pardini M, Brownlee WJ, et al. An abnormal periventricular magnetization transfer ratio gradient occurs early in multiple sclerosis. Brain. 2017;140(2):387–398. doi: 10.1093/brain/aww296
- Matteo P, Carole HS, Ferran P, et al. Relationship of grey and white matter abnormalities with distance from the surface of the brain in multiple sclerosis. J Neurol Neurosurg Psychiatry. 2016;87(11):1212. doi: 10.1136/jnnp-2016-313979
- Samson RS, Cardoso MJ, Muhlert N, et al. Investigation of outer cortical magnetisation transfer ratio abnormalities in multiple sclerosis clinical subgroups. Mult Scler. 2014 Sep 01;20(10):1322–1330. doi: 10.1177/1352458514522537
- Vaneckova M, Piredda GF, Andelova M, et al. Periventricular gradient of T1 tissue alterations in multiple sclerosis. NeuroImage Clin. 2022 Jan 01;34:103009.
- Mainero C, Benner T, Radding A, et al. In vivo imaging of cortical pathology in multiple sclerosis using ultra-high field MRI. Neurology. 2009;73(12):941. doi: 10.1212/WNL.0b013e3181b64bf7
- Pardini M, Gualco L, Bommarito G, et al. CSF oligoclonal bands and normal appearing white matter periventricular damage in patients with clinically isolated syndrome suggestive of MS. Multi Sclerosis Relat Disord. 2019 Jun 01;31:93–96.
- Mainero C, Louapre C, Govindarajan ST, et al. A gradient in cortical pathology in multiple sclerosis by in vivo quantitative 7 T imaging. Brain. 2015;138(4):932–945. doi: 10.1093/brain/awv011
- Brown JWL, Chowdhury A, Kanber B, et al. Magnetisation transfer ratio abnormalities in primary and secondary progressive multiple sclerosis. Mult Scler. 2020 May;26(6):679–687.
- Kearney H, Yiannakas MC, Samson RS, et al. Investigation of magnetization transfer ratio-derived pial and subpial abnormalities in the multiple sclerosis spinal cord. Brain. 2014 Sep;137(9):2456–2468.
- Brown JWL, Prados Carrasco F, Eshaghi A, et al. Periventricular magnetisation transfer ratio abnormalities in multiple sclerosis improve after alemtuzumab. Mult Scler. 2020 Aug 01;26(9):1093–1101. doi: 10.1177/1352458519852093
- Weber CE, Nagel K, Ebert A, et al. Diffusely appearing white matter in multiple sclerosis: insights from sodium (23Na) MRI. Multi Sclerosis Relat Disord. 2021 Apr 01;49:102752.
- Eisele P, Konstandin S, Griebe M, et al. Heterogeneity of acute multiple sclerosis lesions on sodium (23Na) MRI. Mult Scler. 2016 Jul 01;22(8):1040–1047. doi: 10.1177/1352458515609430
- Eisele P, Konstandin S, Szabo K, et al. Temporal evolution of acute multiple sclerosis lesions on serial sodium (23Na) MRI. Mult Scler Relat Disord. 2019 Apr 01;29:48–54.
- Huhn K, Mennecke A, Linz P, et al. 23Na MRI reveals persistent sodium accumulation in tumefactive MS lesions. J Neurolog Sci. 2017 Aug 15;379:163–166.
- Inglese M, Madelin G, Oesingmann N, et al. Brain tissue sodium concentration in multiple sclerosis: a sodium imaging study at 3 tesla. Brain. 2010;133(3):847–857. doi: 10.1093/brain/awp334
- Zaaraoui W, Konstandin S, Audoin B, et al. Distribution of brain sodium accumulation correlates with disability in multiple sclerosis: a cross-sectional 23Na MR imaging study. Radiology. 2012 Sep 01;264(3):859–867. doi: 10.1148/radiol.12112680
- Paling D, Solanky BS, Riemer F, et al. Sodium accumulation is associated with disability and a progressive course in multiple sclerosis. Brain. 2013;136(7):2305–2317. doi: 10.1093/brain/awt149
- Maarouf A, Audoin B, Konstandin S, et al. Topography of brain sodium accumulation in progressive multiple sclerosis. Magn Reson Mater Phy. 2014 Feb 01;27(1):53–62. doi: 10.1007/s10334-013-0396-1
- Vargas WS, Monohan E, Pandya S, et al. Measuring longitudinal myelin water fraction in new multiple sclerosis lesions. NeuroImage Clin. 2015 Jan 01;9:369–375.
- Vavasour IM, Laule C, Li DK, et al. Longitudinal changes in myelin water fraction in two MS patients with active disease. J Neurol Sci. 2009 Jan 15;276(1–2):49–53. doi: 10.1016/j.jns.2008.08.022
- van Waesberghe JH, van Walderveen MA, Castelijns JA, et al. Patterns of lesion development in multiple sclerosis: longitudinal observations with T1-weighted spin-echo and magnetization transfer MR. AJNR Am J Neuroradiol. 1998 Apr;19(4):675–683.
- Chen JT, Collins DL, Atkins HL, et al. Magnetization transfer ratio evolution with demyelination and remyelination in multiple sclerosis lesions. Ann Neurol. 2008 Feb;63(2):254–262.
- Bodini B, Veronese M, García-Lorenzo D, et al. Dynamic imaging of individual remyelination profiles in multiple sclerosis. Ann Neurol. 2016 May;79(5):726–738. doi: 10.1002/ana.24620
- Klistorner A, Barnett M. Remyelination trials: are we expecting the unexpected? Neurol Neuroimmunol Neuroinflammation. 2021 Nov;8(6). doi: 10.1212/NXI.0000000000001066
- Klotz L, Antel J, Kuhlmann T. Inflammation in multiple sclerosis: consequences for remyelination and disease progression. Nat Rev Neurol. 2023 May 01;19(5):305–320.
- Cunniffe N, Coles A. Promoting remyelination in multiple sclerosis. J Neurol. 2021 Jan;268(1):30–44. doi: 10.1007/s00415-019-09421-x
- Schwartzbach CJ, Grove RA, Brown R, et al. Lesion remyelinating activity of GSK239512 versus placebo in patients with relapsing-remitting multiple sclerosis: a randomised, single-blind, phase II study. J Neurol. 2017 Feb;264(2):304–315.
- Vázquez-Marrufo M, Sarrias-Arrabal E, García-Torres M, et al. A systematic review of the application of machine-learning algorithms in multiple sclerosis. Neurologia (Engl Ed). 2021 Feb 3. doi: 10.1016/j.nrl.2020.10.017
- McKinley R, Wepfer R, Grunder L, et al. Automatic detection of lesion load change in multiple sclerosis using convolutional neural networks with segmentation confidence. NeuroImage Clin. 2020 Jan 01;25:102104.
- McKinley R, Wepfer R, Aschwanden F, et al. Simultaneous lesion and brain segmentation in multiple sclerosis using deep neural networks. Sci Rep. 2021 Jan 13;11(1):1087. doi: 10.1038/s41598-020-79925-4
- Caba B, Cafaro A, Lombard A, et al. Single-timepoint low-dimensional characterization and classification of acute versus chronic multiple sclerosis lesions using machine learning. Neuroimage. 2023 Jan;265:119787.
- Conti A, Treaba CA, Mehndiratta A, et al. An interpretable machine learning model to predict cortical atrophy in multiple sclerosis. Brain Sci. 2023 Jan 24;13(2):198. doi: 10.3390/brainsci13020198
- Bouman PM, Noteboom S, Nobrega Santos FA, et al. Multicenter evaluation of AI-generated DIR and PSIR for cortical and juxtacortical multiple sclerosis lesion detection. Radiology. 2023 Apr;307(2):e221425.
- Barnett M, Wang D, Beadnall H, et al. A real-world clinical validation for AI-based MRI monitoring in multiple sclerosis. NPJ Digit Med. 2023 Oct 19;6(1):196. doi:10.1038/s41746-023-00940-6
- Branco D, Martino B, Esposito A, et al. Machine learning techniques for prediction of multiple sclerosis progression. Soft Comput. 2022 Nov 01;26(22):12041–12055. doi: 10.1007/s00500-022-07503-z
- Eshaghi A, Young AL, Wijeratne PA, et al. Identifying multiple sclerosis subtypes using unsupervised machine learning and MRI data. Nat Commun. 2021 Apr 06;12(1):2078. doi: 10.1038/s41467-021-22265-2