Abstract
In response to the need for inexpensive high throughput assays for anti-cancer drug screening, a 1536-well microtiter plate based assay utilizing the Alamar Blue fluorescent dye as a measure of cellular growth was validated in 10 μL assay volume. Its robustness was assessed in a screen against a library of 2000 known bioactives; with an overall Z′ value of 0.89 for assay robustness, several known cytotoxic agents were identified including and not limited to anthracyclines, cardiac glycosides, gamboges, and quinones. To further test the sensitivity of the assay, IC50 determinations were performed in both 384-well and 1536-well formats and the obtained results show a very good correlation between the two density formats. These findings demonstrate that this newly developed assay is simple to set up, robust, highly sensitive and inexpensive. It could potentially provide a rapid way to screen established and primary tumor cell lines against large chemical libraries.
Introduction
Cancer accounts for a significant portion of the increase in non-communicable disease in the developing world. In 2000, an estimated 10 million new cancers were diagnosed in new patients and 6 million cancer deaths occurred worldwide. By 2020, the number of new cancers will reach 15 million people, and the number of deaths could potentially double to as many as 12 million [Citation1]. Oncological processes are characterized by an uncontrolled increase in cellular proliferation; hence, the availability of a suitable in vitro cytotoxicity assay in the early discovery efforts of screening large chemical libraries would provide an important advantage in identifying novel agents. These would then constitute the starting point for further characterization and development as small molecule therapeutics for intervention and control of cancers as the latter remains an important public health challenge. Thus, rapid assessment and identification of novel anti-cancer agents remain the major bottleneck.
The selection of one assay type over another for primary screening for cytotoxic agents can be complicated due to the availability of several assay types from various vendors that rely on a wide variety of physiological mechanisms and endpoint measurements. Their costs should also been taken into consideration when screening large chemical libraries. There are several cytotoxic assay types that are commonly used by both academic researchers and the pharmaceutical industry; these include and are not limited to ATP quantification [Citation2], XTT/MTT [Citation3], LDH release [Citation4], and glutathione depletion [Citation5].
However, the ideal assay type for in vitro cytotoxicity profiling must be a simple, rapid, efficient, sensitive, safe and cost effective measure of cellular viability. Obviously for chemical screening purposes, it should not interfere with the chemicals to be tested. One such assay type has already been established by Fields and Lancaster in 1993 as a continuous assay for monitoring both cell proliferation and cytotoxicity [Citation6]; it is based on a dye called resazurin and commercially sold as Alamar Blue (AB) [Citation7,8], a non-fluorescent and blue dye which upon reduction to resorufin becomes pink and highly fluorescent. It is the most simple and rapid test, whereby 10% (v/v) of the AB solution is added to the cell medium and measured by fluorimetry. Greater sensitivity of as many as 80 cells per test has been reported [Citation8]. It has been successfully used on different cell types for its reliable cytotoxicity measurements including fibroblasts [Citation9], immortalized and cancer cell lines [Citation10–13], tumor necrosis factor-hypersensitive cells [Citation14], and for its cell proliferation reliability on mouse and human lymphocytes [Citation15,16].
We have taken advantage of this widely utilized non-radioactive reagent to develop the basis of our miniaturized cytotoxicity screening platform. The AB assay is based on the addition of the dye at a final concentration of 10% (v/v) to seeded cells, and their proliferation for a period of time in the continuous presence of the dye. No washing steps are required for this method, which makes it easily amenable to miniaturization and automation. This agent is widely used to measure cytotoxicity indirectly by prompt fluorescence (excitation: 531 nm, emission: 595 nm) [Citation15]. AB fluorescence can be easily detected using standard equipment such as a microtiter plate reader or a CCD based imaging camera systems, and it is comparable to 3H-thymidine incorporation in recording proliferation rates [Citation15,16].
In this work, we have miniaturized the AB assay to 10 μL in 1536-well microtiter plates. We performed pilot screens against a library of 2000 chemicals to assess robustness and performance in identifying cytotoxic agents using the 1536-well plate based assay. We present here the results of this newly miniaturized assay and report the identification of several cytotoxic agents identified in both screening densities and exhibiting potent anti-proliferative activity against the well established MCL cell line NCEB1.
Materials and methods
Materials
The 384-well microtiter plates and 1536-well microtiter plates are both tissue culture treated and purchased from Corning (Corning, NY). The Alamar Blue reagent (AB) was obtained from Serotec Ltd (Raleigh, NC). Staurosporine was purchased from LC Laboratories (Woburn, MA).
Cytotoxicity assay in 384-well microtiter plates
The NCEB1 cell line was used as a model line for our studies, and cultured as follows: the cells were maintained in RPMI 1640 medium supplemented with 10% fetal bovine serum, non-essential amino acids, penicillin, streptomycin and were grown under an atmosphere of 5% CO2-95% air at 37°C. Cells were seeded at different cell densities in 45μL medium with 5μL of compound in 1% DMSO (v/v) and grown for 36 to 48 h in 384-well microtiter plates. Next, 5 μL AB was added to the cells and incubated for another 24 h. The resulting fluorescence intensity was read on the Victor3 V Multilabel Plate Reader (Perkin Elmer, USA) or LEADseeker™ Multimodality Imaging System (GE Healthcare, USA).
Cytotoxicity assay in 1536-well microtiter plates
The cells were seeded at different densities in 8 μL medium into 1536-well microtiter plates for 36 to 48 h containing 1μL of compound in 1% DMSO (v/v), then 1 μL AB was added. They were further incubated for another 24 h, and the fluorescence intensity was read on the Victor3 V Multilabel Plate Reader or LEADseeker™ Multimodality Imaging System.
Dose response studies
The signal inhibition induced by the compounds was expressed as a percentage compared to high and low controls located on the same plate, as defined as % Inhibition = (high control average − read value)/(high control average − low control average) × 100. The dose response was assessed in duplicate and using 12 point doubling dilutions with 100 μM compound concentration as the upper limit. The dose response curve for each set of data was fitted separately, and the two obtained IC50 values were averaged. For compounds having an IC50 below 1 μM, the dose response study was repeated using dilutions starting at 10 μM compound concentration for more accurate determination of the IC50 value.
Assessment of compound optical interference
Optical interference tests were performed by measuring the fluorescence output of wells with cells grown in the same assay conditions, pre- and post-addition of the compounds. The compounds were tested at a concentration of 10 μM in 1% DMSO (v/v) in duplicate. Practically, the NCEB1 cells were incubated for 48 h after which, 5 μL of AB was added and allowed to incubate for an additional 24 h. The plates were first read for total fluorescence intensity, and then read again for a second time immediately after addition of compounds; the addition will not have any immediate effects on cellular growth thus providing a window to assess optical interference, namely fluorescence quenching. Compound interference was calculated by percent change in fluorescence intensity (post-addition fluorescence/pre-addition fluorescence × 100). Compounds inducing a variation of fluorescence greater than 20% were flagged as optically active compounds.
Statistical analysis
The Z′ factor was used to assess assay performance. The Z′ factor constitutes a dimensionless parameter that ranges from 1 (infinite separation) to < 0. It is defined as: Z′ = 1 − (3σc + +3σc − )/|μc + − μc − | where σc + , σc − , μc + and μc − are the standard deviations (σ) and averages (μ) of the high (c + ) and low (c − ) control [18].
Chemical libraries
The library used for the pilot screen was purchased from MicroSource (MicroSource Discovery Systems, USA). The library contains 2000 biologically active and structurally diverse compounds from known drugs, experimental bioactives, and pure natural products. The library includes a reference collection of 160 synthetic and natural toxic substances (inhibitors of DNA/RNA synthesis, protein synthesis, cellular respiration, and membrane integrity), a collection of 80 compounds representing classical and experimental pesticides, herbicides, and endocrine disruptors, a unique collection of 720 natural products and their derivatives. The collection includes simple and complex oxygen heterocycles, alkaloids, sequiterpenes, diterpenes, pentercyclic triterpenes, sterols, and many other diverse representatives.
Liquid dispensing systems
Two different liquid dispensing devices were used in this study. Compounds were plated at a volume of 1 μL or 5 μL using a custom designed 384 head on a TPS-384 Total Pipetting Solution (Apricot Designs, USA). The addition of both cell suspensions and the AB reagent were performed using a FlexDrop IV (Perkin Elmer, USA).
Automation system & screening data management
The assays were performed on a fully automated linear track robotic platform (CRS F3 Robot System, Thermo CRS, Canada) using several integrated peripherals for plate handling, cell incubators, liquid dispensing, and fluorescence detection. Screening data files from the Victor3 V Multilabel Plate Reader or LEADseeker™ Multimodality Imaging System were loaded into the HTS Core Screening Data Management System, a custom built suite of modules for compound registration, plating, data management, and powered by ChemAxon Cheminformatic tools (ChemAxon, Hungary). Data was analyzed for compounds exhibiting 50% inhibition or greater, and the summary of the identified positives was exported as structure data files (SDF) for further analysis and reporting.
Results
Establishing cell growth conditions in 384-well microtiter plates
We have used the established MCL cell line, NCEB1, as a model cell line for our studies [Citation17]. In order to determine the optimal cell density per well in a 384-well microtiter plate, cells were diluted at various densities and seeded using a FlexDrop liquid dispenser into plates to achieve a range from 250 to 3000 cells per well in a 45 μL volume of medium. Next, 5 μL of the AB solution was added to the cells and the lidded plates were placed into the incubator located on the robotic platform. The robot performed a time course reading of the fluorescence generated by the AB reagent over 72 h using the Victor3 V plate reader (). We observed that the best signal output started to emerge after an incubation period of 24 h, where linearity of growth with time seems to have been achieved with cell densities in the range of 500 to 3000 cells. Interestingly, the no cell control wells showed very little change in the AB fluorescence over the 72 h time course, potentially due to slow reduction of the dye in the RPMI based cell culture medium. This result further validates the ease of use and stability of the AB reagent (). We conclude that AB is non-toxic, stable in culture medium and allows continuous monitoring of cell growth for periods up to 72 h.
Figure 1. (a) Growth curve of NCEB1 cell line with various cell densities as assessed by the AB reagent over a time course of 72 h after AB addition. Cells were seeded into 384-well microtiter plates. An average of 48 wells was used for each data point. (b) Effect of DMSO on the growth of NCEB1 cell line as assessed by the AB reagent over a time course of 48 h. Cells were seeded into 384-well microtiter plates. An average of 96 wells was used for each data point. (c) Assessment of assay performance and robustness. Cells were seeded into 384-well microtiter plates and incubated for 36 h prior to addition of the AB reagent. High control wells contained 1% DMSO (v/v). Low control wells contained 25 μM staurosporine in 1% DMSO (v/v).
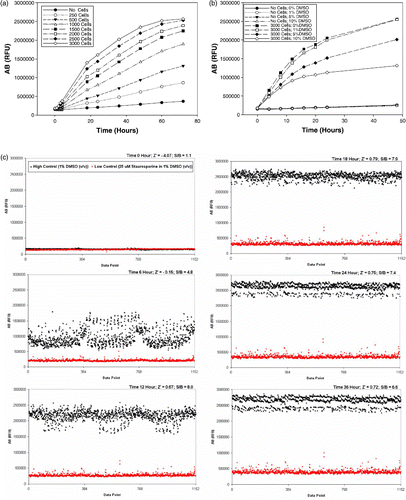
Using a density of 3000 cells per well in 384-well microtiter plates, the effects of the compound carrier DMSO on the cells and the AB dye were investigated. DMSO could either interfere with the AB signal output or induce cytotoxicity. Cells were seeded to wells containing increasing concentrations of DMSO ranging from 0 to 10% (v/v). We have also included a no cell control to assess any effects of DMSO on spontaneous reduction of the AB reagent. Upon addition of the AB reagent, plates were immediately read at time zero and then over a 48 h time course using the Victor3 V plate reader (). We found that the NCEB1 cells seem to tolerate DMSO up to a 1% (v/v) final concentration and well within range of what we typically use for screening. DMSO concentrations of 5% and 10% (v/v) caused substantial reduction in cellular growth (). In addition, DMSO does not quench nor causes spontaneous reduction of AB as observed through the inclusion of the no cells controls. We conclude that the NCEB1 cells can tolerate up to 1% DMSO (v/v) and that the AB reagent is not sensitive to quenching or reduction by the compound carrier DMSO; furthermore, the AB reagent was stable for the duration of the assay.
To assess performance and signal window, NCEB1 cells were seeded into six 384-well microtiter plates at a density of 3000 cells per well in the presence of 1% DMSO (v/v) for high control or 25 μM staurosporine in 1% DMSO (v/v) for low control wells. The NCEB1 cells were incubated for 36 h, after which 5 μL of AB solution was added and readings were taken every 6 h for a total of 36 h using the Victor3 V plate reader (). Our measurements indicated that the AB signal started to emerge after 6 h of incubation time. Within 12 h and up to 36 h, the AB reagent had a signal to background (S/B) separation of at least 6 fold. The Z′ values ranged from 0.67 after 12 h to 0.72 after 36 h indicating the tightness of data, good dynamic separation and S/B ratio. The Z′ factor has been widely used by the screening industry as a very useful way of assessing the statistical performance of an assay [Citation18]. Z′ is an elegant combination of signal window and variability, the main parameters used in the evaluation of assay quality and performance. Z′ factor is a dimensionless parameter that ranges from 1 (infinite separation) to < 0. High and low control populations start to overlap when Z′ converges towards zero (lower panel). Z′ values of 0.4 and above are acceptable and tend to correlate well with assay performance; these represent at least an S/B ratio of 3 and a coefficient of variation (CV) of 10% [Citation19].
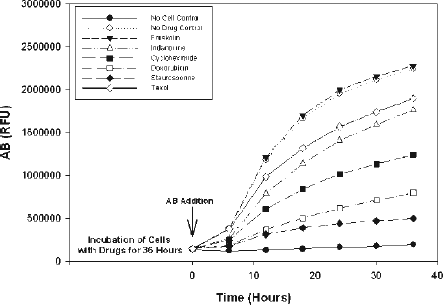
To assess assay sensitivity for the identification of cytotoxic agents, we investigated the action of known agents on the growth of the NCEB1 cell line. Doxorubicin is a chemotherapeutic agent currently used in the clinic for the treatment of MCL either as standard therapy or in combination with other anti-metabolites [Citation20]. Indanocine and taxol belong to a known class of anti-mitotic agents acting specifically on either tubulin polymerization or de-polymerization, respectively and have been reported to have anti-tumor activity [Citation21]. Forskolin, a natural product isolated from the herb Coleus forskohlii, increases intracellular levels of cAMP resulting in apoptosis [Citation22]. Cycloheximide, a natural product isolated from the bacterium Streptomyces griseus, is protein synthesis inhibitor with significant toxicity. Staurosporine is a natural product originally isolated in 1977 from the bacterium Streptomyces staurosporeus [Citation23]. One biological activity of staurosporine is the inhibition of protein kinases resulting in anti-tumor effects through induction of apoptosis in these cancer cells. All drugs were tested at a final concentration of 10 μM in 1% DMSO (v/v). Cells were seeded into the 384-well microtiter plates containing drugs and incubated for 36 h, after which 5 μL of the AB solution was added. The AB signal was measured every six h for 36 h using the Victor3 V plate reader on the robotic platform (). We found that cycloheximide, doxorubicin and staurosporine showed the most drastic inhibitory effects on cellular growth. These observations further validate our assay strategy in identifying novel cytotoxic agents against well established tumor cell lines. Forskolin, indanocine and taxol, on the other hand, had little or no effects on the NCEB1 cells; and further validating the assay sensitivity in picking up modulators specific for inhibiting NCEB1 cellular growth. We typically score as positive any compound exhibiting an inhibitory activity of >50%. By tabulating the data from at a 24 h incubation period; cycloheximide, doxorubicin and staurosporine would have been picked up as hits during screening with percent inhibitions of 52%, 75% and 85%, respectively.
Figure 2. Effects of known cytotoxic agents on the growth of the NCEB1 cell line as assessed by the AB reagent over a time course of 36 h. Cells were seeded into 384-well microtiter plates and incubated for 36 h prior to the addition of the AB reagent. Negative control wells contained no cells. Positive control wells contained 1% DMSO (v/v). All drugs were screened at a 10 μM final concentration in 1% DMSO (v/v). An average of 48 wells was used for each data point.
Assay miniaturization to higher density format in 1536-well microtiter plates
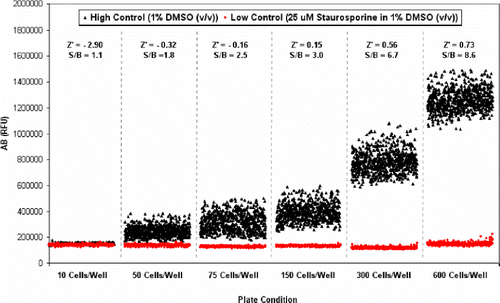
Having established conditions in 384-well microtiter plates and shown sensitivity to identifying cytotoxic agents, we engaged on a further miniaturization of the assay to a final volume of 10 μL in 1536-well microtiter plate format. In order to determine the optimal cell density per well, cells were diluted at various densities and seeded using a FlexDrop liquid dispenser into plates to achieve a range from 10 to 600 cells per well in 8 μL medium. The NCEB1 cells were seeded into 1536-well microtiter plates pre-plated with half of the wells containing 1% DMSO (v/v) for high control and the other containing 25 μM staurosporine in 1% DMSO (v/v) for low control wells. Cells were incubated for 48 h prior to the addition of 1 μL of the AB reagent and further incubated for another 24 h period before reading the AB fluorescence on the Victor3 V plate reader (). We found that at cell densities of below 300 cells per well, there does not seem to be a good separation between the high and low control wells, and calculated Z′ values were below the acceptable range of 0.4. However, Z′ values of 0.56 and 0.73 and good S/B ratio of 6.7 and 8.6 were obtained for cell densities of 300 and 600, respectively (). Based on these results, cytotoxicity assays can be developed for use in 1536-well microtiter plate format in a total assay volume of 10 μL.
Figure 3. Assay miniaturization in 1536-well microtiter plate. Cells were seeded into 1536-well microtiter plates and incubated for 36 h prior to the addition of the AB reagent and further incubated for 24 h prior to reading the AB fluorescence. High control wells contained 1% DMSO (v/v). Low control wells contained 25 μM staurosporine in 1% DMSO (v/v).
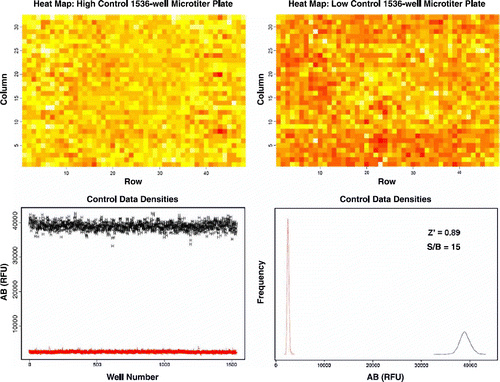
To further evaluate assay robustness and performance, we used two control 1536-well microtiter plates with one plate filled with 1% DMSO (v/v) for high control and the other plate containing 25 μM staurosporine in 1% DMSO (v/v) for low control wells. The analysis of the control well data provides us with: (1) the S/B ratio as an indication of good dynamic separation, (2) a measure for the CV, and (3) a calculated Z′ value. NCEB1 cells were seeded at 500 cells per well into the 1536-well microtiter plates and incubated for a period of 48 h, after which the AB dye was added. The NCEB1 cells were incubated for another 24 h before taking the final fluorescence reading. We chose to measure the AB signal for the high density 1536-well microtiter plate using the LEADseeker™ Multimodality Imaging System in order to increase efficiency and lower data read acquisition times. With this imaging system, we lowered acquisition time to less than one minute as compared to 10 min measuring time with the Victor3 V plate reader. Under these assay conditions, we observed a S/B ratio of 15 and both high and low controls exhibit a tight set of data with CVs in the range of 3% to 7%, respectively. The calculated Z′ value of 0.89 was indicative of robust assay conditions which enabled us to easily identify active compounds with 50% or more inhibitory activity on the cellular growth of NCEB1 cells. Heat map analysis of wells showed very little variability between wells in both control plates and the absence of patterns shows no systematic errors especially edge effects ().
Figure 4. Control experiment to evaluate assay robustness and performance in 1536-well microtiter format. Top panel shows heat map analysis of the high and low control plate. Bottom panel shows AB signal and distribution of high and low control points. High control wells contained 1% DMSO (v/v). Low control wells contained 25 μM staurosporine in 1% DMSO (v/v).
Screening for cytotoxic agents using the 1536-well assay
The developed assay was used in a high throughput pilot screen of a library of 2000 compounds. The collection is composed of known and FDA approved drugs from MicroSource Discovery Systems. The library was plated in two 1536-well microtiter plates with columns 25 to 28 left empty for addition of high and low control wells, which allowed monitoring of assay performance during the automated screening run. The pilot screen was carried out exactly the same way the full scale HTS will be performed (e.g. same robotic platform and imagers). The pilot screen was performed on two separate days against the same set of compounds in order to assess day to day variability. The compound screening concentration was 10 μM in 1% DMSO (v/v). shows an example of a 1536-well microtiter plate imaged using the LEADseeker™ imaging system and showing no edge effects for screening in 10 μL total assay volume. This validation step allows us to obtain field data on assay performance such as: 1) an estimate of the initial hit rate, 2) an overall assessment of compound optical interference, and 3) an evaluation of assay reproducibility. A scatter plot of the two data sets examines the correlation between percent inhibitions for each compound and allows us to evaluate the number of outliers which hit on one day but not on the other (). From the scatter plot, there seems to be a good overall correlation between compounds screened in duplicate as depicted by the pattern of points and the slope from the lower left to upper right. For the data sets from Day 1 and Day 2, 7 and 5 positives compounds were identified as outliers, respectively. The Z′ value for each plate was calculated and translates into an overall Z′ factor of 0.8, indicative of the excellent robustness of the assay during fully automated screening.
Figure 5. Sample images of 384-well microtiter plate and 1536-well microtiter plate as imaged by the LEADseeker™ Multimodality Imaging System.
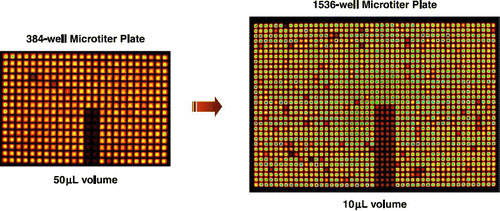
Figure 6. Scatter plot of 2000 compound validation of the NCEB1 cell line. Scatter plot shows percent inhibition of duplicate values for each compound.
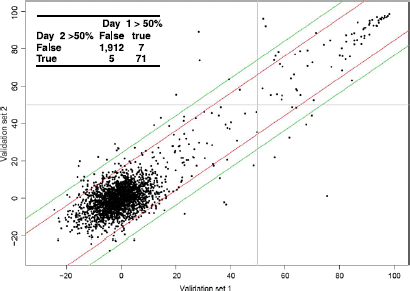
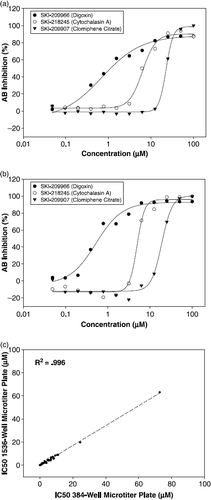
The sensitivity of the 1536-well assay was further demonstrated by its ability to identify known cytotoxic compounds such as protein synthesis inhibitors and mitochondria poisons in the commercial libraries. The evaluation of our assay conditions described above suggested that we have developed a robust and reliable assay to screen for cytotoxic agents that would impede cellular growth. We have identified a total of 71 compounds scoring at least 50% inhibition and yielding an initial hit rate of 3.55% against this library of known bioactive compounds. Of these 71 positives, 55 positives scored at least 70% inhibition or greater on both days of the screen. We selected 36 compounds from our positive list for dose response studies using doubling dilutions starting from 100 μM compound concentration in 1% DMSO (v/v). To further test the robustness of the assay, we performed IC50 determinations in both 384-well microtiter and 1536-well microtiter formats following the same conditions for drug and incubation with modifications only to volumes to account for changes in assay format. With this assay, we were able to detect IC50 values ranging from nanomolar to micromolar in both formats further demonstrating its sensitivity to identify anti-proliferative agents (). Dose response curves are shown for three selected hits: SKI-209966 (Digoxin), SKI-218245 (Cytochalasin A), and SKI-209907 (Clomiphene Citrate) ( and b). We also found that the IC50 values obtained in both assay formats show a very good correlation with an R2 of .996 (). Based on these findings, miniaturization of the assay from 384-well microtiter plate to 1536-well microtiter plate did not distort the obtained signal and clearly reinforces that our assay is practical for use in high throughput screening applications.
Table I. Comparison of IC50 values in both 384-well microtiter plate and 1536-well microtiter plate. NCEB1 cells were seeded into 384-well microtiter plates and 1536-well microtiter plates and incubated with drugs for 48 h prior to addition of AB reagent. Cells were then incubated for another 24 h with AB reagent before readings were taken. High control wells contained 1% DMSO (v/v). Low control wells contained 25μM staurosporine in 1% DMSO (v/v).
Figure 7. (a) IC50 curves of each compound in 384-well microplate format: Digoxin, 0.8 μM; Cytochalasin A, 8.5 μM; and Clomiphene Citrate, 24.5 μM. (b) IC50 curves of each compound in 1536-well microplate format: Digoxin, 0.6 μM; Cytochalasin A, 5.8 μM; and Clomiphene Citrate, 19.8 μM. (c) Correlation plot of IC50 values in 384-well microtiter plate versus 1536-well microtiter plate. NCEB1 cells were incubated with compounds for 48 h and then incubated with AB reagent for another 24 h. High control wells contained 1% DMSO (v/v). Low control wells contained 25 μM staurosporine in 1% DMSO (v/v). IC50 values are an average of two independently fitted dose response curves for each data set.
Discussion
The aim of this study was to investigate the feasibility of miniaturizing the AB assay into 10 μL volume and with the use of the minimum number of cells in higher density formats, namely the 1536-well microtiter format. We assessed the miniaturized assay robustness, amenability to automation, proneness to false positives and sensitivity in identifying cytotoxic agents when used in high throughput screening.
We first set out to establish cell growth conditions in 384-well microtiter format; we found that the compound carrier DMSO was tolerated by the cell line NCEB1 up to 1% (v/v). We also found that the AB dye is stable in cell culture media over a time course of 72 h () and resistant to DMSO, a highly oxidative agent, up to concentrations of 10% (v/v) (). We opted for an optimal cell density of 3000 cells per well for this assay in 384-well microtiter format. Assay development kinetics revealed that the minimum time required for the dye to be taken up by cells and to yield a robust (Z′ = 0.67) fluorescence output signal after reduction by the mitochondria was 12 h (). Doxorubicin (DNA alkylating agent and currently being used in the clinic [Citation20]), cycloheximide (protein synthesis inhibitor), and staurosporine (pan-active kinase inhibitor) were identified as inhibitors of cellular growth for NCEB1 whereas the anti-mitotic agents indanocine and taxol only partially affected growth at 10 μM screening concentration (). Forskolin, an adenylate cyclase activator, did not have any effect on the growth of NCEB1, suggesting that cAMP signaling in this lineage is more anti-apoptotic [Citation21,24].
Having established robust and sensitive assay conditions in the 384-well microtiter plate, we progressed to miniaturize the assay into 10 μl in 1536-well microtiter plate. Assay development over a cell density range from 10 to 600 cells per well showed that the minimum number of cells required to achieve acceptable Z′ values was 300 cells with the NCEB1 cell line (). Below 300 cells per well, poor S/B ratios were observed with calculated Z′ values below 0.15. This finding is somehow surprising as O'Brien and coworkers reported that they can detect as fewer as 80 HepG2 cells per well using the same assay [Citation8]. However, our observations were made from 768 data points; 10 μl volume in 1536-well microtiter plate whereas theirs were made from only 8 data points recorded from a 200 μl volume in 96-well plate and using a Fluoroskan Ascent plate reader for detection (LabSystems International). We conclude that the minimum required cells in a 1536-well microtiter format to achieve good assay robustness is 300 cells per well in a volume of 10 μl. The optimal cell density may well vary from cell line to cell line.
Using a cell density of 500 cells per well, the assay was fully automated on the robotic platform and validated in a pilot screen against a collection of 2000 compounds. An overall Z′ value of 0.89 was obtained for the control plates; one for high and one for low control plates. A Z′ value of 0.8 was obtained from the control wells in the pilot screen. These results reinforce the robustness and amenability to automation of this newly miniaturized assay. We identified a total of 71 compounds with inhibitory effects in the AB assay of greater than 50%. Within this set, 55 positive compounds had at least 70% inhibition further demonstrating the assays ability to find potent active compounds. To test the sensitivity and the performance of the assay, we selected 36 compounds for dose response studies in 384-well microtiter format and 1536-well microtiter format. The calculated IC50 values ranged from 100 nM to 73 μM () with all 36 compounds reproducing with good correlation between formats. In and b, IC50 curves of SKI-209966 (Digoxin), SKI-218245 (Cytochalasin A) and SKI-209907 (Clomiphene Citrate) are shown for both 384-well microtiter and 1536-well microtiter formats. A correlation plot of the 384-well microtiter data against the 1536-well microtiter data shows the tightness of our IC50 data with a R2 of .996 (). This indicated that as we moved towards a miniaturized format, our assay maintained sensitivity and robustness with little or no signal distortion.
For this assay, we recognized that the AB fluorescent signal may be susceptible to optically active compounds. However, these compounds can be easily filtered out by subjecting the positives to a compound optical interference test. In our pilot set, SKI-210511 (Brucine) was identified to spontaneously quench the AB signal by 30% and flagged in our analysis.
We conclude that the AB reagent is simple, highly sensitive and robust for use in our miniaturized NCEB1 assay. We have demonstrated that our miniaturized assay is: (1) amenable to automation, (2) able to identify compounds with inhibition activity and (3) determine IC50 with little or no distortion. In addition, the use of the LEADseeker™ Multimodality Imaging System greatly reduces reading time and prevents assay lag time that is generally associated with higher density formats. The rationale behind this miniaturization is also relevant to growing large number of cells for screening. If we use 300 cells per data point, to screen a 100,000 compound library we would need 50 million cells in comparison to 550 million cells if we were to perform it in the 384-well microtiter plate formats. Furthermore, the cost of the AB reagent would be $206 compared to $1030, respectively. This methodology would allow us to screen several of these well established leukemic and lymphoma cell lines at a relatively cheaper cost and in record times as we can fully automate the assays on the robotic platform.
Acknowledgements
Support from “Mr. William H. Goodwin and Mrs. Alice Goodwin and the Commonwealth Foundation for Cancer Research”, “The William Randolph Hearst Foundation” and “The Experimental Therapeutics Center of Memorial Sloan-Kettering Cancer Center” is greatly acknowledged. We also thank the members of the High Throughput Screening Core Facility for their help during the course of this study, and especially Dr. Christophe Antczak for critically reading the manuscript.
References
- SF Sener. (2005). Disease without borders. CA Cancer J Clin 55:7–9.
- M Untch, BU Sevin, JP Perras, R Angioli, A Untch, RD Hightower, O Koechli, and HE Averette. (1994). Evaluation of paclitaxel (taxol), cisplatin, and the combination paclitaxel–cisplatin in ovarian cancer in vitro with the ATP cell viability assay. Gyn Oncol 53:44–49.
- T Mosmann. (1983). Rapid colorimetric assay for the cellular growth and survival: Application to proliferation and cytotoxicity assays. J Immunol Meth 65:55–63.
- C Korzeniewski, and DM Callewaert. (1983). An enzyme release assay for natural cytotoxicity. J Immunol Meth 64:313–320.
- MA Baker, GJ Cerniglia, and A Zaman. (1990). Microtiter plate assay for the measurement of glutathione and glutathione disulfide in large numbers of biological samples. Anal Biochem 190:360–365.
- RD Fields, and MV Lancaster. (1993). Dual-attribute continuous monitoring of cell proliferation/cytotoxicity. Am Biotechnol Lab 11:48–50.
- RW Horobin. (2001). The problem of proprietary dyes, with special reference to Alamar blue, a proprietary dye revealed. Biotechnic Histochem 76:163–164.
- J O'Brien, I Wilson, T Orton, and F Pognan. (2000). Investigation of the Alamar blue (resazurin) fluorescent dye for the assessment of mammalian cell cytotoxicity. Eur J Biochem 267:5421–5426.
- SL Voytik-Harbin, AO Brightman, B Waisner, CH Lamar, and SF Badylak. (1998). Application and evaluation of the Alamar blue assay for cell growth and survival of fibroblasts. In Vitro Cell Dev Biol Anim 34:239–246.
- H Mueller, MU Kassack, and M: Wiese. (2004). Comparison of the usefulness of MTT, ATP, and Calcein assays to predict the potency of cytotoxic agents in various human cancer cell lines. J Biomol Screen 9:506–515.
- B Pagé, M Pagé, and C:A Noël. (1993). new fluorometric assay for cytotoxicity measurements in vitro. Int J Oncol 3:473–476.
- GR Nakayama, MC Caton, MP Nova, and Z Parandoosh. (1997). Assessment of the Alamar blue assay for cellular growth and viability in vitro. J Immunol Meth 204:205–208.
- R Hamid, Y Rotshteyn, L Rabadi, R Parikh, and P: Bullock. (2004). Comparsion of Alamar blue and MTT assays for high through-put screening. Toxicol In Vitro 18:703–710.
- TA Shahan, PD Siegel, WG Sorenson, WG Kuschner, and DM Lewis. (1994). A sensitive new bioassay for tumor necrosis factor. J Immunol Meth 175:181–187.
- SA Ahmed, RM GogalJr, and JE Walsh. (1994). A new rapid and simple non-radioactive assay to monitor and determine the proliferation of lymphocytes: An alternative to [3H]thymidine incorporation assay. J Immunol Meth 170:211–224.
- R De Fries, and M Mitsuhashi. (1995). Quantification of mitogen induced human lymphocyte proliferation: Comparison of Alamar blue assay to 3H-thymidine incorporation assay. J Clin Lab Anal. 9:89–95.
- DL Saltman, PG Cachia, AE Dear, FM Ross, AS Krajewski, C Ludham, and CM Steel. (1988). Characterization of a new non-Hodgkin's lymphoma cell line (NCEB1) with a chromosomal (11:14) translocation [t(11:14)(q13;q32)]. Blood 72:2026–2030.
- C Antcak, D Shum, S Escobar, B Bassit, E Kim, E Venkatraman, N Wu, G Yang, O Ouerfelli, Y-M Li, DA Scheinberg, and H Djaballah. (2007). High-throughput identification of inhibitors of human mitochondrial peptide deformylase. J Biomol Screen 12:521–535.
- R Macarron, and RP Hertzberg. (2002). Design and implementation of high throughput screening assays. Meth Mol Biol 190:1–29.
- TE Witzig. (2005). Current treatment approaches for Mantle-cell lymphoma. J Clin Oncol 23:6409–6411.
- LM Leoni, E Hamel, D Genini, H Shih, CJ Carrera, HB Cottam, and DA: Carson. (2000). Indanocine, a microtubule binding indanone and a selective inducer of apoptosis in multidrug-resistant cancer cells. J Natl Cancer Inst 92:217–224.
- JH Myklebust, D Josefsen, HK Blomhoff, FO Levy, S Naderi, JC Reed, and EB Smeland. (1999). Activation of the cAMP signaling pathway increases apoptosis in human B-precursor cells and is associated with downregulation of mcl-1 expression. J Cell Physiol 180:71–80.
- S Omura, Y Iwai, A Hirano, A Nakagawa, J Awaya, H Tsuchya, Y Takahashi, and R Masuma. (1977). A new alkaloid AM-2282 of Streptomyces origin. Taxonomy, fermentation, isolation and preliminary characterization. J Antibiot 30:275–282.
- EY Moon, and A Lerner. (2003). PDE4 inhibitors activate a mitochondrial apoptotic pathway in chronic lymphocytic leukemia cells that is regulated by protein phosphatase 2A. Blood 101:4122–4130.