
 ?Mathematical formulae have been encoded as MathML and are displayed in this HTML version using MathJax in order to improve their display. Uncheck the box to turn MathJax off. This feature requires Javascript. Click on a formula to zoom.
Abstract
We report computer-aided design of new lactone–chalcone and isatin–chalcone (HLCIC) inhibitors of the falcipain-2 (PfFP-2). 3D models of 15 FP-2:HLCIC1-15 complexes with known observed activity (IC50exp) were prepared to establish a quantitative structure–activity (QSAR) model and linear correlation between relative Gibbs free energy of enzyme:inhibitor complex formation (ΔΔGcom) and IC50exp: pIC50exp = −0.0236 × ΔΔGcom+5.082(#); R2 = 0.93. A 3D pharmacophore model (PH4) derived from the QSAR directed our effort to design novel HLCIC analogues. During the design, an initial virtual library of 2621440 HLCIC was focused down to 18288 drug-like compounds and finally, PH4 screened to identify 81 promising compounds. Thirty-three others were added from an intuitive substitution approach intended to fill better the enzyme S2 pocket. One hundred and fourteen theoretical IC50 (IC50pre) values were predicted by means of (#) and their pharmacokinetics (ADME) profiles. More than 30 putative HLCICs display IC50pre 100 times superior to that of the published most active training set inhibitor HLCIC1.
1. Introduction
Malaria remains the main cause of death all over the world and we are unable to reverse this sad morbidity statistic. Indeed, during the year 2015, 212 million cases of malaria and 429 thousand death cases were reported by the WHOCitation1. Plasmodium falciparum (Pf), the most virulent causative agent of malaria, is developing resistance rapidly so that the future of the Artemisinin Combined Therapy (ACT, available since 2006) is compromisedCitation2. For almost a decade the development of novel antimalarials concerned mainly ACT, as recently exemplified by introduction of the combination of artemether and lumefantrine referred to as novametherCitation3. Luckily, this alarming dark picture has been illuminated by the reported new antimalarial candidatesCitation4–6. Relatively low level of structural knowledge of novel and validated pharmacological targets of the Pf on one side and the lack of inhibition pharmacophores on the other, remain the drawbacks of antimalarial drug design (ADD) and development. One of the recent ADD strategies was to design hybrids molecules containing artemisinin (ART) or other antimalarial combined with another structural fragmentCitation6–8. Falcipains have drawn the attention of ADD due to their important role in the haemoglobin degradation (along with plasmepsins) while their inhibition is lethal to the PfCitation9–11. Lactone–chalcone and isatin–chalcone (HLCIC) hybrid molecules have been mentioned in this context, their experimental FP-2 inhibitory activities were reportedCitation12. They essentially target the bipartite motifs of falcipain-2 (FP-2) and falcipain-3 (FP-3), the papain-family cysteine proteases of Pf, which are involved in the degradation of host’s haemoglobin within the food vacuole during the blood-stage of the parasiteCitation13,Citation14. Due to their specific features, falcipains represent promising targets for the development of next-generation antimalarialsCitation10,Citation14.
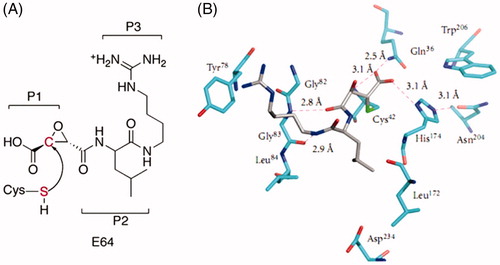
In this work, we design new analogues of HLCIC starting from a series of 15 known HLCIC hybrids with determined experimental inhibition potencies (IC50exp), which were used as a training setCitation12. We build on our design and new analogue activity prediction relies on a reliable descriptor, namely standard Gibbs free energy (GFE) of enzyme:inhibitor (E:I) complex formation (ΔGcom), quantitative structure–activity relationships (QSAR), 3D structural model of the FP-2 and analysis of the inhibitor–enzyme interactions. Relative changes in the GFE of E:I complex formation were computed in order to build a linear regression QSAR model utilising the published IC50exp Citation12. Each complex was carefully built by in situ modification of the reference crystal structure of FP-2 (3BPF)Citation15 in complex with epoxysuccinate E64 (). The 3D models of inhibitors bound to FP-2, QSAR and pharmacophore (PH4) models derived for the training set compounds provided the necessary structural information needed to improve inhibitor interactions at pockets S1, S2, and S3 of the FP-2 active site. Screening of designed virtual library (VL) of analogues by the PH4 led to the identification of potent HLCIC, which are predicted to be hundreds of times more potent than the best training set inhibitor HLCIC1 (IC50exp = 6.8 µM).
Figure 1. (a) Molecular structure of epoxysuccinate E64 with indicated P1, P2, and P3 positions. (b) 3D depiction of E64 interactions with the FP-2 active site residues involving residues that occupy S1, S2, and S3 pockets of the active siteCitation15.
2. Materials and methods
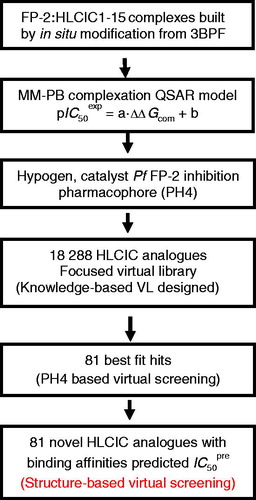
The methodology of computer-assisted molecular design based on 3D models of E:I complexes and QSAR analysis of a training set of known inhibitors has been successfully applied to optimisation of antiviral, antibacterial, and anti-protozoan compounds including peptidomimetic, hydroxynaphthoic, thymidine, triclosan, pyrrolidine carboxamide derivatives, peptidic, and ART hybrids inhibitorsCitation8,Citation16–26. The workflow shown in describes the series of steps of virtual design of novel HLCIC analogues.
Figure 2. Workflow describing the multistep approach to virtually designed novel HLCIC analogues with higher predicted potencies against the FP-2 of Pf.
2.1. Training sets
The chemical structures of the training set compounds comprising 15 HLCIC hybrids and their experimental biological activities (IC50exp = 6.8–90 µM) are taken from the literatureCitation12. The IC50exp values of the HLCIC compounds cover a relatively wide concentration range, which is needed to build a reliable QSAR model.
2.2. Model building and calculation of binding affinity
Molecular modelling was carried out for the E:I (FP-2:HLCIC) complexes, the free enzyme FP-2, and the free HLCIC inhibitors starting from the high-resolution crystal structure of FP-2 co-crystallised with epoxysuccinate E64 inhibitor (PDB code 3BPF, resolution 2.9 Å) using Insight II molecular modelling programCitation27. Initially, all crystallographic waters were removed, then hydrogens were added to the residues of the FP-2 and FP-2:HLCIC complex with the protonisation/ionisation state corresponding to the pH of 7 keeping the N- and C-terminal groups neutral. Inhibitors were modelled from the 3BPF reference crystal structure by in situ modification of functional groups in the molecular scaffold of the endogenous E64 inhibitor. All rotatable bonds of the replacing fragments were subjected to an exhaustive conformational search coupled with a careful gradual energy-minimisation of the modified inhibitor and active-site residues of FP-2 located in the immediate vicinity (5 Å radius) in order to identify low-energy bound conformations of the modified inhibitors. The resulting low-energy structures of the E:I complexes were then carefully refined by energy-minimisation procedure of the entire complex to obtain stable structures of the binary FP-2:HLCIC complexes. The complete description of the computation of relative ligand binding affinity (ΔΔGcom) is described in Ref. [Citation25]:
(1)
(1)
The ΔΔHMM describes the relative enthalpic contribution to the GFE change corresponding to the intermolecular interactions in the E:I complex estimated by molecular mechanics (MM), ΔΔGsol, and ΔΔTSvib represent the relative solvation and vibrational entropy contributions to the GFE of the E:I complex formation, respectively.
2.3. Molecular mechanics
Modelling of the inhibitors and their complexes were carried out in all-atom representation using atomic parameters and charges of the class II consistent force field CFF91Citation22. A dielectric constant of 4 was used for all MM calculations in order to take into account the dielectric shielding effect in proteins. Minimisations of the E:I complexes, free E and I were carried out by relaxing the structures gradually, starting with added hydrogen atoms, continued with residue side chain heavy atoms and followed by the protein backbone relaxation. Geometry optimisations were performed using the sufficient number of steepest descent and conjugate gradient iterative cycles and average gradient convergence criterion of 0.01 kcal·mol−1·Å−1.
2.4. Solvation GFE
The electrostatic component of the solvation GFE, which includes also the effect of ionic strength of the solvent by solving the non-linear Poisson–Boltzmann equationCitation28,Citation29 was computed by the DelPhi module of the Discovery Studio (DS 2.5)Citation30. The program represents the solvent by a continuous medium of high dielectric constant (εro = 80) and the solute as a charge distribution filling a low dielectric cavity (εri = 4) with boundaries linked to the solute’s molecular surface. The program numerically solves for the molecular electrostatic potential and reaction field around the solute using finite difference method. DelPhi calculations were done on a (235 × 235 × 235) cubic lattice grid for the E:I complexes and free E and on a (65 × 65 × 65) grid for the free I. Full coulombic boundary conditions were employed. Two subsequent focusing steps led to a similar final resolution of about 0.3 Å per grid unit at 70% filling of the grid by the solute. Physiological ionic strength of 0.145 mol·dm−3, atomic partial charges and radii defined in the CFF force field parameter setCitation30 and a probe sphere radius of 1.4 Å were used. The electrostatic component of the Poisson–Boltzmann solvation GFE was calculated as the reaction field energyCitation21,Citation24,Citation29,Citation31,Citation32.
2.5. Interaction energy
The molecular mechanic interaction energy (Eint) calculation protocol available in DS 2.5Citation30 was used to compute the non-bonded interactions (van der Walls and electrostatic interatomic potential terms) between two sets of atoms belonging either to the E or I in the E:I complexes. All pairs of interactions of the total enzyme–inhibitor interaction energy were evaluated using CFF force field parameters with a relative permittivity of 4Citation30. In particular, the breakdown of Eint into contributions from individual active site residues allows a quantitative analysis, which permits identification of residues with the highest contribution to the ligand binding. It also helps with the identification of favourable structural modifications and suggests molecular moieties in the inhibitor structure which are primarily responsible for the biological activity of the compoundCitation22.
2.6. 3D-QSAR pharmacophore generation
Pharmacophore (PH4) modelling assumes that a set of key structural features responsible for biological activity of the compound is recognised by the active site during receptor binding. In this work, the pharmacophore was prepared by the 3D-QSAR pharmacophore protocol of Catalyst HypoGen algorithmCitation33 implemented in DS 2.5Citation30. Bound conformations of HLCIC inhibitors taken from the refined E:I complexes were considered for construction of the PH4. The top scoring pharmacophore hypothesis was prepared in three stages: constructive, subtractive, and optimisation step, from a set of most active HLCIC inhibitors. The inactive compounds served for the definition of excluded volume. During the PH4 generation, five features available in the HypoGen algorithm were used: hydrophobic aromatic (HYdAr), hydrophobic aliphatic (HYd), hydrogen-bond donor (HBD), acceptor (HBA), and ring aromatic (Ar) feature. Default values of the adjustable parameters were kept during the PH4 generation, except the uncertainty on the biological activity, which was reduced to 1.25 instead of 3. This adjustment modified the uncertainty interval of experimental activity from a wide span [IC50exp/3, 3×IC50exp] to a relatively narrow one] [4×IC50exp/5, 5×IC50exp/4], due to accuracy and homogeneity of the measured activities originating from the same laboratoryCitation12. The top ten pharmacophores were generated with the number of missing features set to zero. Finally, the best PH4 model was selected. Generally, a PH4 model, as the one described here, can be used to estimate the pIC50pre of new analogues on the basis of their mapping to its features. In this study, priority was given to PH4 based screening of ADME focused VL of HLCIC analogues.
2.7. ADME-related properties
Properties that determine the pharmacokinetics profile of a compound, besides octanol/water partitioning coefficient, aqueous solubility, blood/brain partition coefficient, Caco-2 cell permeability, serum protein binding, number of likely metabolic reactions and other 18 descriptors related to adsorption, distribution, metabolism and excretion (ADME properties) of the inhibitors were computed by the QikProp programCitation34 based on the methods of JorgensenCitation35–37. According to these methods, experimental results of more than 710 compounds including about 500 drugs and related heterocycles, were correlated with computed physico-chemical descriptors, resulting in an accurate prediction of molecule’s pharmacokinetic profile. Drug likeness (#stars) is represented by the number of descriptors that exceed the range of values determined for 95% of known drugs out of 24 selected descriptors computed by the QikPropCitation34. Drug-likeness was used as the global compound selection criterion related to ADME properties. The selected ADME descriptors were calculated from 3D structures of compounds considered. They were used to assess the pharmacokinetics profile of designed compounds and served also for the VL focusing.
2.8. Virtual combinatory library generation
The analogue model building was performed with Molecular Operating Environment (MOE) programCitation38. The library of analogues was enumerated by attaching R-groups (fragments, building blocks) onto HLCIC scaffold using the Quasar CombiDesign module of MOECitation38. Reagents and chemicals considered in this paper were selected from the directories of chemicals available from the commercial sources. Each analogue was built as a neutral molecule in the MOE programCitation38, its geometry was refined by MM optimisation through smart minimiser of DS 2.5Citation30 meeting high convergence criteria (threshold on energy difference of 10−4 kcal·mol−1 and root mean square deviation (RMSD) of 10−5 Å), dielectric constant of 4, using class II consistent force field CFFCitation39.
2.9. ADME-based library focusing
Twenty-four pharmacokinetics-related molecular descriptors available in QikPropCitation34, which characterise a wide spectrum of molecular properties as described in Section 2.7, were used. Optimum ranges of these 24 descriptors were defined in terms of upper and lower bounds according to QikPropCitation34. Among them predicted drug-likeness (#stars, Section 2.7) was used to retain drug-like HLCIC analogues in the focused VL.
2.10. Pharmacophore-based library focusing
The pharmacophore model (PH4) described in Section 2.6 was derived from the bound conformations of HLCIC at the active site of FP-2. The enumerated and ADME-focused VL was further evaluated by using the pharmacophore mapping protocol available of DS 2.5Citation30. Within this protocol, each generated conformer of the analogues was geometry optimised by means of the CFF force field for a maximum of 500 energy minimisation steps and subsequently aligned and mapped to the PH4 model in order to select the top ranking overlaps. Twenty best-fitting inhibitor conformers were saved and clustered into 10 conformational families according to their mutual RMSD by Jarvis-Patrick complete linkage clustering methodCitation40. The best representative of each cluster was considered for the virtual screening of analogues. Only those analogues mapping to all PH4 features were retained for the in silico screening.
2.11. In silico screening
The conformer with the best match to the PH4 pharmacophore in each cluster of the focused library subset was selected for in silico screening by the complexation QSAR model. The relative GFE of E:I complex formation in water ΔΔGcom was computed for each selected new analogue and then used for prediction of FP-2 inhibitory potencies (IC50pre) of the focused VL of HLCIC analogues by inserting this parameter into the target-specific scoring function. The scoring function, which is specific for the FP-2 receptor of Pf inhibition, is given in EquationEquation (2)(2)
(2) , was parameterised using the QSAR model of training set of HLCIC inhibitorsCitation12.
(2)
(2)
3. Results and discussion
A series of 18 [15 training set HLCIC and 3 validation set (VS) HLCIV] of HLCIC inhibitors and their experimental activities (IC50exp) from the same laboratoryCitation12 were selected (). These activities cover a relatively wide range 6.8 µM ≤ IC50exp ≤ 90 µM and allowed building of a valid QSAR model.
Table 1. Training set (HLCIC) and validation set (HLCIV) of FP-2 inhibitorsCitation12 used in the preparation of QSAR model of inhibitor binding to the FP-2 of Pf.
3.1. Results
The relative GFE of E:I complex formation ΔΔGcom was calculated for the FP-2: HLCIC complexes as described in Section 2. shows GFE and their components (EquationEquation (1)(1)
(1) ). The ΔΔGcom reflects the mutual affinity between the enzyme and the inhibitor. Since it is calculated via an approximate approach, the relevance of the binding model is evaluated by a linear regression with experimentally observed activity data (IC50exp)Citation12 (EquationEquation (2)
(2)
(2) ), which led to a linear correlation and QSAR model for the training set of HLCIC inhibitors. Two correlation equations obtained for the GFE of E:I complex formation ΔΔGcom (Equation (B)) and its enthalpic component ΔΔHMM (Equation (A)), respectively are presented in with the relevant statistical data plotted in . The relatively high values of the regression coefficient R2 and the Fischer F-test of the correlation involving ΔΔGcom indicate that there is a strong relationship between the binding model and the experimental inhibitory potencies of the HLCIC.
Figure 3. (left): Plot of correlation between pIC50exp and relative enthalpic contribution to the GFE ΔΔHMM; (right) similar plot for relative complexation GFE ΔΔGcom of the training set of HLCIC, all in kcal·mol−1. Validation set data is shown in red colour.
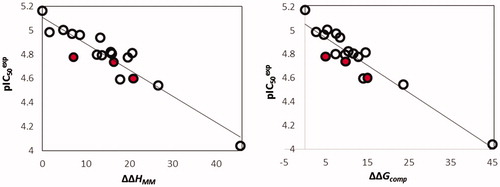
Table 2. GFE of E:I complex formation (ΔΔGcom binding affinity) and its components for the training set of FP-2 inhibitors HLCIC1-15 and the validation set of inhibitors HLCIV1-3.
Table 3. Regression analysis of computed binding affinities ΔΔGcom, its enthalpic component ΔΔHMM and observed activity pIC50exp = −log10IC50exp Citation12 of hybrid lactone–chalcone and isatin–chalcone HLCIC.
The bound conformation of the most potent FP-2 inhibitor HLCIC1Citation12 in this QSAR model is displayed in (). The enzyme–inhibitor overall intermolecular interaction energy Eint in FP-2:HLClCx complexes is listed in along with its correlation between that energy with observed inhibitory potency (IC50exp) plotted in . According to the statistical data in , some 85% of the IC50exp variation is explained by Eint drop while moving from the best active HLClC1 to the less active one HLClC6. The quality of this correlation opens the gate to a deeper analysis of the intermolecular interaction energy Eint variation in light with structural requirement of FP-2 inhibition namely the active site pockets filling.
Figure 4. (Top) 2D schematic interaction diagram of the most potent inhibitor HLCIC1 () at the active-site of FP-2 of Pf; (Middle, Bottom) 3D structure of the active-site with bound HLCIC1.
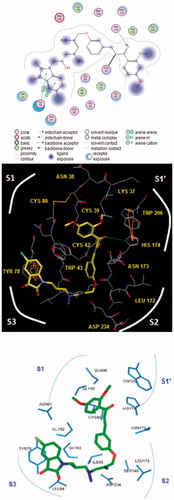
Figure 5. Plot of correlation between pIC50exp and overall intermolecular interaction energy Eint in complexes FP-2:HLCICx.
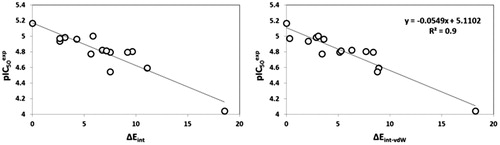
Table 4 Enzyme–inhibitor FP-2:HLCICx overall intermolecular interaction energy Eint (kcal·mol−1).
Table 5. Regression analysis of computed interaction energies Eint and observed activities pIC50exp of hybrid lactone–chalcone and isatin–chalcone HLCIC.
The prominent role of the van der Waals (vdW) component of Eint in the binding affinity of HLCIC to FP-2 of Pf is highlighted by the correlation between individual contributions to the overall Eint. In addition, to assess the impact of the residues occupying individual active site pockets (S1, S2, S3, and S1’; ) we have analyzed their contribution to the overall Eint (; ). The contribution of all the four pockets together explained 88% of the FP-2 inhibitory potencies of the training set inhibitors. This fell down to 31% when removing the contribution of the S2 pocket (67%). The filling of the S2 pocket by function groups of the inhibitors is therefore crucial for the FP-2:HLCIC1-15 affinity. Thus, our virtual FP-2 inhibitor design prioritised optimal filling of the S2 pocket by the HLCIC analogues.
Figure 6. Plot of the correlation between interaction energies of residues belonging to individual active site pockets (S1, S2, S3, and S’1) and observed activities pIC50exp.
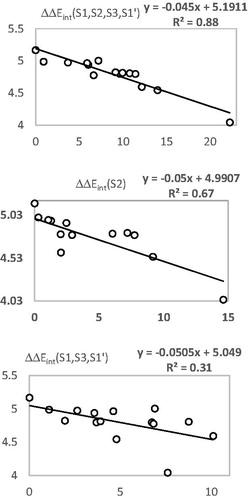
Table 6. Active site residue contribution to Eint in FP-2:HLCIC1 complex (kcal·mol−1).
The PH4 pharmacophore model of FP-2 inhibition elaborated from QSAR model and training set of HLCICCitation12 is presented in and and . The 3D-QSAR PH4 generation was carried out in three steps: constructive, subtractive, and optimisation step (Section 2). During the constructive phase of HypoGen the most active HLCIC, for which IC50exp ≤ 2 × 6.8 µM, was selected as the leads. Thus, HLCIC1-3,7,13,14 (IC50exp ≤ 13.6 µM) were used to generate the starting PH4 features and those matching these leads were retained. During the subsequent subtractive phase, features which were present in more than half of the inactive HLCIC were removed. The PH4 models which contained all features were retained. None of the training set compounds was found to be inactive (IC50exp> 6.8 × 103.5 = 21503.4 µM). During the final optimisation phase, the score of the PH4 hypotheses was improved. Hypotheses were scored via simulated annealing protocol according to errors in the activity estimates from the regression and complexity. At the end of optimisation, 10 best scoring unique hypotheses () displaying five features were kept. The reliability of the generated PH4 models was then assessed using the calculated cost parameters ranging from 74.8 (Hypo1) to 94.7 (Hypo10). Their statistical data (costs, root-mean-square deviation 2.056 ≤ RMSD ≤ 2.777 and 0.89 ≤ R2 ≤ 0.94) are listed in . The PH4 Hypo1, with the best RMSD and highest R2 was retained for screening. Its regression equation pIC50exp = 0.9958·pIC50pre + 0.0192 (; ), both R2 and Rxv2 greater than 0.9 and F-test of 111.25 attest the predictive capacity of the PH4. The fixed cost of Hypo1 (74.8), lower than the null cost (296.7) by Δ = 221.9, is a chief indicator of the PH4 model predictability (Δ > 70 corresponds to a probability higher than 90% that the model represents a valid correlationCitation22). The difference Δ ≥ 202 for the set of 10 hypotheses confirms the high quality of the PH4 model. The best-selected hypothesis Hypo1 represents a PH4 model with a similar level of predictive power as the QSAR model utilising the GFE of E:I complex formation with a probability of 98%.
Figure 7. Distances (a), angles (b), features (c), and mapping (d) of the pharmacophore of the Pf FP-2 inhibition with the best training set inhibitor HLCIC1 (yellow)Citation12. The correlation plot of experimental vs. predicted inhibitory activity (e) is displayed. The features are coloured blue for hydrophobic aliphatic (HYd), green for hydrogen-bond (HB) acceptor (HBA), purple for HB donor (HBD) and orange for Aromatic (Ar). The arrows represent the projection of donor and acceptor features.
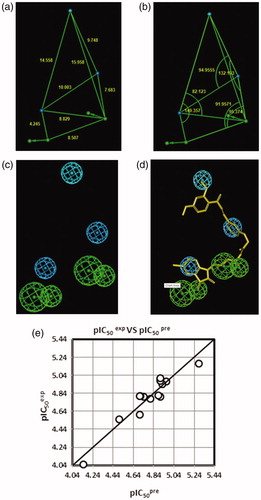
Table 7. Output parameters of 10 generated PH4 hypotheses for test set HLCIC FP-2 inhibitorsCitation12 after CatScramble validation procedure.
Table 8. Regression analysis of pIC50exp Citation12 and computed pIC50pre of HLCIC towards the FP-2 of Pf.
The substantial predictive power of the generated PH4 model was also checked through the computed ratio of PH4-predicted and experimentally observed activities (pIC50pre/pIC50exp) for the VS, (). The computed ratios are as follows: HLCIV1:1.006, HLCIV2:1.057, HLCIV3:0.97; all of them close to one.
We have built a VL of new HLCIC analogues compounds with a variety of substitutions in ortho, meta, and para positions of the benzene rings with the goal to identify more potent orally bioavailable inhibitors of the FP-2 of Pf.
During the VL enumeration, the R-groups listed in were attached to positions R1–R6 of the HLCIC scaffold to form a virtual combinatorial library of the size: R1 × R2 × R3 × R4 × R5 × R6 = 128 × 10 × 128 × 2 × 2 × 2 = 1,310,720 analogues for the scaffold SC1 () and R1 × R2 × R3 × R4 × R5 × R6 = 2 × 2 × 2 × 128 × 10 × 28 = 1,310,720 for SC2 () resulting together in 1,310,720 × 2 = 2,621,440 analogues. In order to match the substitution pattern of the best training set inhibitor HLCIC1 and taking into account the reported structural information about S pockets filling suitable for substitutionCitation12 not excluded through the Lipinski’s rule violation (Mw > 500 g/mol)Citation41, the VL underwent a focusing.
Table 9. R-groups (fragments, building blocks, substituents) used in the design of the diversity VL of HLCIC analogues.
To increase the content of drug-like and orally bioavailable analogues, the initial VL was filtered in an ADME-based focusing step. Only those molecules that satisfied the Lipinski’s rule of fiveCitation41 computed using QikPropCitation16, were kept.
From the initial set of 2,621,440 (1,310,720 × 2) analogues, 18,288 (9144 × 2) fulfilled the Lipinski test (except the restriction Mw < 500 g/mol). Out of them, 141 analogues mapped to the 5 feature PH4 pharmacophore. The 81 best fitting analogues (PH4 hits) were retained and submitted to structure-based screening using the QSAR model and computed GFE of the FP-2:HLCIC complex formation. The calculated ΔΔGcom of the FP-2:HLCIC complexes of the hits, their components as well as predicted half-maximal inhibitory concentrations IC50pre estimated from the correlation equation (B) () are listed in . Thirty-three others HLClC new analogues were added from an intuitive substitution approach intended to fill better the enzyme S2 pocket; they are listed in . In the majority of new HLCIC analogues, the estimated inhibitory potencies are better than that for the most active training set inhibitor HLCIC1 (IC50exp = 6.8 µM)Citation12.
Table 10. GFE of FP-2:HLCIC complex formation and its components for the 81 virtually designed HLCIC exploring the pockets S1, S1’, and S3.
Table 11. GFE of FP-2:HLCIC complex formation and its components for the 33 virtually designed HLCIC with intuitive P2 substitution (R6-group) exploring the S2 pocket in addition to S1, S1’, and S3.
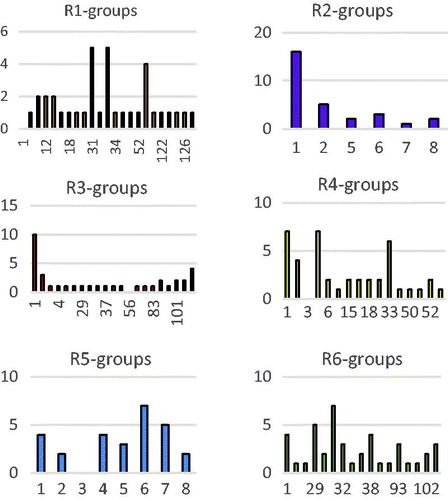
In order to identify which substituents from lead to new inhibitor candidates with high predicted potencies towards the FP-2, we have prepared histograms of the frequency of occurrence of the R1 to R6 groups in these 81 HLCIC virtual hits (). Analysis of the histograms showed that the highest frequency of occurrence among the R1-groups displayed the fragments 31, 33, and 53 (). In case of R2-groups fragments 1 and 2; for the R3-groups fragments 1, 2, and 106; for the R4-groups fragments 1, 2, 4, and 33 against 1 (4), 4 (4), 6 (7), and 7 (5) for R5 while the R6 group include chiefly fragments 1 (4), 29 (5), 31 (7), and 38 (4).
Figure 8. Histograms of frequency of occurrence of individual R1–R6 groups in the 81 selected analogues mapping to the five-feature pharmacophore hypothesis Hypo1 (for fragments numbering see ).
3.2. Discussion
Training set of 15 HLCIC inhibitors and observed half-maximal inhibitory concentrations IC50exp Citation12 were employed to derive QSAR model of FP-2 inhibition, which uses a single descriptor determined by molecular modelling (GFE of FP-2:HLCIC complex formation, ΔΔGcom) and crystal structure of the FP-2 of Pf in complex with epoxysuccinate E64 (3BPF)Citation15. This statistically significant QSAR model confirmed the validity of our 3D models of HLCIC inhibitors and the mode of their binding to the active site of the FP-2 of Pf. Then a 3D pharmacophore (PH4) model of FP-2 inhibition was prepared for the bound conformations of HLCIC and was further used for screening of a large virtual combinatorial library of HLCIC analogues with the aim to identify more potent and bioavailable FP-2 inhibitors. The activities of the identified putative inhibitors and analogues proposed by structure-based design (IC50pre) were predicted by linear QSAR regression equation (B) () and cross-checked by the PH4 regression equation (D) ().
3.2.1. QSAR model
The robustness of the single descriptor QSAR model was analyzed by assessing the role of the individual components of GFE of the FP-2:HLCIC complex formation ΔΔGcom, namely the enthalpic, solvation and approximate entropic contributions. The relevance of the enthalpic contribution ΔΔHMM to GFE was well confirmed by the quality of the regression (A) (), indicating that a large part (91%) of the variation of the IC50exp can be explained by intermolecular interactions, which can be traced back to contributions of active site pockets (Sn) as well as individual residues, Eint (; ). Addition of the solvation term ΔΔGsol maintained the relationship level between the experimental data and the modelling results. Finally, the validity of the model was increased by adding the ΔΔTSvib term that describes the loss of the inhibitor vibrational entropy upon enzyme binding, which explained 93% of the variation of the IC50exp. This last contribution is considered to be one of the most reliable indicators of the predictive power of QSAR models as reported by Freire et al.Citation43. The VS of 3 HLCICV inhibitors not included into the training set () confirmed good correlation between the ΔΔGcom and the observed activities IC50exp Citation12 since the ratio between computed and experimental potencies pIC50pre/pIC50exp was close to one. Therefore, the QSAR correlation equation (B) and computed relative GFE ΔΔGcom can be used for prediction of inhibitory potencies IC50pre of new HLCIC analogues against the FP-2 of Pf, since they share the same binding mode as the training setCitation12.
3.2.2. Binding mode of FP-2 inhibitors
Besides the robustness of the QSAR model, the analysis of the interactions between the HLCIC and active site residues revealed the key interactions responsible for the HLCIC affinity to FP-2, such as hydrogen bonds, van der Waals interactions, hydrophobic contacts, etc. As displayed in the 2D and 3D schemes of , the binding of HLCIC1 to the active site of FP-2 is supported by the following interactions: HB with His174 and stacking interaction with Tyr78. To verify whether also other stronger interactions co-determine the binding mode of HLCIC to FP-2 active site and aid structure-based design of new analogues, interaction energies Eint between active site residues and HLCIC were computed (). The peptidyl structure of HLCIC shed some light on the structural features required for the binding affinity improvement, taking advantage of the S pockets filling (). The computed overall interaction energy complexes FP-2:HLCICx correlated with the observed inhibitory potencies IC50exp of the training set HLCIC inhibitors (; ). In particular, the correlation between the van der Waals component of Eint and IC50exp pointed to the π–π stacking interaction involving the isatin moiety of the inhibitor and Tyr78.
The S2 pocket filling and interaction energy contribution shows dominant effect on the FP-2 inhibition as reported previouslyCitation10. On the other hand, comparison of the contributions to Eint between the most active inhibitor HLCIC1 and less active one HLCIC6, corresponds to the trend of activities, but cannot explain the large gap in their inhibitory potencies (1224%). However, in a recent work, we succeeded in justifying the observed 37.5% jump in experimental biological activity between methylphosphonic arginine and hydroxamic acid derivative, both Pf Leucyl aminopeptidase (PfA-M17) inhibitors by the enzyme active site residues contribution to Eint at a level of 35%Citation44. Therefore, essential structural information needed for the design of novel potent HLCIC analogues was derived from a more predictive descriptor ΔΔGcom. New inhibitor candidates were selected according to the workflow (), by virtual screening from a diverse VL of analogues with the active site pockets filling as the central structural requirement displayed by the pharmacophore model of FP-2 inhibition provided by the one descriptor (GFE) QSAR model (; ).
3.2.3. Analysis of new inhibitors from in silico screening
An analysis of structural requirement for FP-2 inhibition at the level of hydrophobic contacts with the active site revealed that the P2 substituent, namely the R6-group in the training set insufficiently explored the S2 pocket of the FP-2 active site. Therefore, new HLCIC analogues that match the FP-2 inhibition pharmacophore and fill better the S2 pocket may form potent FP-2 inhibitors ().
The top scoring virtual hits are HLCIC analogues: 125–1–1–H–lki–H (IC50pre = 30 nM), 127–1–1–H–lki–H (IC50pre = 30 nM) without any specific P2 substitution; 125–1–1–H–lki–128 (IC50pre = 13 nM), 125–1–1–H–lki–129 (IC50pre = 15 nM), 127–1–1–H–lki–128 (IC50pre = 13 nM), 127–1–1–H–lki–129 (IC50pre = 15 nM), 125–1–1–H–lki–137 (IC50pre = 16 nM), and 127–1–1–H–lki–137 (IC50pre = 15 nM) with specific substitution targeting S2 pocket filling (R6 substituent). While the first set displays predicted potency approximately 200 times better than the training set (HLCIC1; ), the last set of new analogues reached IC50pre 500 times better (). Despite this exceedingly optimistic picture, our approach helped to identify interesting hydrophobic side chains (R6-groups) such as (tetrahydro-2H-pyran)Me (128), (piperidin-4-yl)Me (129) and n-butane (137) for the S2 pocket filling with a bulkier group compared to the E64 which is decorated only with a short propyl chain at the P2 position. Indeed, from superimposition of the most active training set HLCIC () and the less active ones (), we can see that E64 remains the only inhibitor to map the S2 pocket. The superimposition of the best-designed analogues () highlights the significance of hydrophobic contact with the S2 pocket. In fact, an additional pharmacophore derived from these new HLCIC analogues suggests an additional hydrophobic feature located at the S2 pocket (). shows the interactions of one of the best-designed analogues 125–1-1–H–lki-128 (IC50pre = 13 nM) with the FP-2 and the Connolly surface of the binding site shows the lipophilic S2 pocket accommodating a bulkier substituent contributing to better stabilisation and greater affinity. These results are in good agreement with the reported structural information from experimental structure–activity relationship on FP-2 and FP-3 pyrimidine-carbonitrile inhibitorsCitation45 as well as QSAR model and in silico design of dipeptide nitriles inhibitors of FP-3Citation26 and FP-2Citation46. These conclusions are also in line with the recent SAR study on synthesis and molecular docking of coumarin containing pyrazoline derivatives as promising inhibitors of in vitro development of a chloroquine-sensitive (MRC-02) and chloroquine-resistant (RKL-2) strain of PfCitation47.
Figure 9. (a) Superposition of most active training set HLClC inhibitors in bound conformation to crystallographic E64 (E64-RX: yellow; HLCIC1: green; HLCIC2: red; HLCIC7: violet; HLCIC13: blue; HLCIC14: orange). (b) Same superposition of less active training set HLClC (E64-RX: yellow; HLCIC4: white; HLCIC8: cyan; HLCIC6: brown).
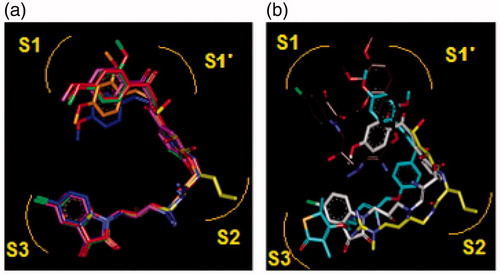
Figure 10. Superimposition of the best analogues exploring the S2 pocket of FP-2 active site; 125–1-1-H-lki-128 (green, IC50pre = 13 nM), 125–1-1-H-lki-129 (red, IC50pre = 15 nM), 125–1-1-H-lki-134 (orange, IC50pre = 18 nM), 127–1-1-H-lki-128 (purple, IC50pre = 13 nM), 127–1-1-H-lki-129 (blue, IC50pre = 15 nM), 127–1-1-H-lki-134 (white, IC50pre = 15 nM).
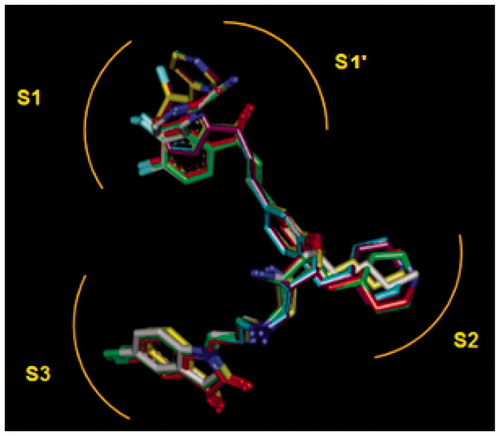
Figure 11. The inhibition pharmacophore filling the S2 pocket of the FP-2 active site derived from the bound conformation of the best analogues with P2 substitution such as 125–1-1-H-lki-128 (IC50pre=13 nM) (green): distances (a), angles (b), features (c), and 125–1-1-H-lki-128 mapping (d). Compared with the 3D QSAR complexation PH4, a supplementary hydrophobic feature corresponding to S2 pocket filling appeared. The features are coloured blue for hydrophobic aliphatic (HYd), green for hydrogen-bond acceptor (HBA), purple for hydrogen-bond donor (HBD) and orange for aromatic (Ar). The arrows represent the projection for the donor and acceptor features.
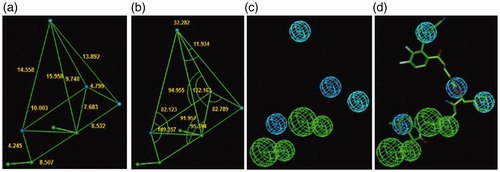
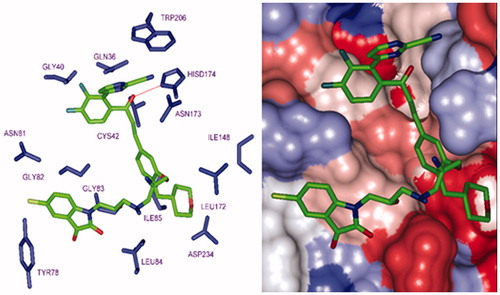
Figure 12. P2 substitution for the S2 pocket filling. (Left): Close up of 125–1-1–H–lki–128 (IC50pre = 13 nM) at the FP-2 active site. Carbon atoms of interacting residue side chains are coloured blue and those of ligand in green. (Right): Connolly surface of the FP-2 active site for 125–1-1–H–lki–128. The binding site surface is coloured according to residue hydrophobicity: red – hydrophobic, blue – hydrophilic and white – intermediate.
The ADME-related properties were also computed for the best active designed HLCIC as well as for drug used for the treatment of malaria (). The chief descriptor, the number of stars (*) deviation of the computed values from the optimum ranges for 95% of known drugs is close to those for known antimalarials. It can be noticed that the human oral absorption in gastrointestinal tract (HOA) is low for the new HLCIC analogues suggesting non-oral delivery. The blood–brain barrier descriptor is in the appropriate range.
Table 12. Predicted ADME-related properties of the best designed HLCIC analogues and known antimalarial agents either in clinical use or currently undergoing clinical testing, as computed by QikPropCitation34
4. Conclusion
Natural-product-like hybrids design for pfFP-2 inhibition stems from the multiple need to provide naturally occurring, resistance overcoming, and favourable pharmacokinetic profile compounds mimicking in this way, how nature synthesise by exploring efficiently chemical space. HLCIC antimalarials structural requirement for falcipain 2 inhibition has been assessed from the complexation “one descriptor” QSAR correlating GFE upon pfFP-2:HLCIC complex formation with activity. Moreover the derived 3D QSAR Pharmacophore was augmented to S2 pocket filling in order to provide a complete PH4 able to guide synthesis of novel potent isatin–chalcone inhibitors. Virtual screening of large and diverse VL of HLCIC analogues by the PH4 led to identification of 125–1–1–H–lki–H (30 nM), 127–1–1–H–lki–H (30 nM) 125–1–1–H–lki–128 (13 nM), 125–1–1–H–lki–129 (15 nM), 127–1–1–H–lki–128 (13 nM), 127–1–1–H–lki–129 (15 nM), 125–1–1–H–lki–137 (16 nM) and 127–1–1–H–lki–137 (15 nM); the best ones according to our design strategy based on S2 hydrophobic contact display predicted potency reaching 200 times that of the most active training set HLCIC1. They are recommended for synthesis and evaluation to check the efficiency of our design approach and guide future discovery of non-peptide, natural product like hybrids FP-2 inhibitors.
Disclosure statement
No potential conflict of interest was reported by the authors.
Additional information
Funding
Related Research Data
References
- OMS. World malaria report 2016. 2016.
- Status report on artemisinin and ACT resistance September 2015. 2015. Available from: http://www.who.int/malaria/publications/atoz/status-rep-artemisinin-resistance-sept2015.pdf [last accessed 28 Jul 2017].
- Foods and Drugs Authority – FDA GHANA. 2015. Available from: https://fdaghana.gov.gh/records/.
- Hartwig CL, Lauterwasser EM, Mahajan SS, et al. Investigating the antimalarial action of 1, 2, 4-trioxolanes with fluorescent chemical probes. J Med Chem 2011;54:156–67.
- Miller LH, Ackerman HC, Su XZ, Wellems TE. Malaria biology and disease pathogenesis: insights for new treatments. Nat Med 2013;19:156–67.
- Sharma N, Mohanakrishnan D, Shard A, et al. Stilbene-chalcone hybrids: design, synthesis and evaluation as a new class of antimalarial scaffolds that trigger cell death through stage specific apoptosis. J Med Chem 2012;55:297–311.
- Capela R, Oliveira R, Goncalves LM, et al. Artemisinin-dipeptidyl vinyl sulfone hybrid molecules: design, synthesis and preliminary SAR for antiplasmodial activity and falcipain-2 inhibition. Bioorg Med Chem Lett 2009;19:3229–32.
- N'Guessan AJB, Megnassan E, Ziao N, et al. Artemisinin-dipeptidyl vinyl sulfone hybrid inhibitors of Plasmodium falciparum falcipain 2 with favorable pharmacokinetic profile. J Drug Des Devel 2017;1:11–28.
- Grelb MH. Drug discovery for malaria: a very challenging and timely endeavor. Curr Opin Chem Biol 2007;11:440–5.
- Bekono BD, Ntie-Kang F, Owono OLC, et al. Targeting cysteine proteases from Plasmodium falciparum: a general overview, rational drug design and computational approaches for drug discovery. Curr Drug Targets 2018;19:501–26.
- Teixeira C, Gomes JRB, Gomes P. Falcipains, Plasmodium falciparum cysteine proteases as key drug targets against malaria. Curr Med Chem 2011;18:1555–72.
- Hans RH, Gut J, Rosenthal PJ, et al. Comparison of the antiplasmodial and falcipain-2 inhibitory activity of b-amino alcohol thiolactone-chalcone and isatin-chalcone hybrids. Bioorg Med Chem Lett 2010;20:2234–7.
- Subramanian S, Sijwali PS, Rosenthal PJ. Falcipain cysteine proteases require bipartite motifs for trafficking to the Plasmodium falciparum food vacuole. J Biol Chem 2007;282:24961–9.
- Hogg T, Nagarajan K, Herzberg S, et al. Structural and Functional Characterization of Falcipain-2, a Hemoglobin from the Malaria Parasite Plasmodium falciparum. J Biol Chem 2006;281:25425–37.
- Kerr ID, Lee JH, Pandey KC, et al. Structures of falcipain-2 and falcipain-3 bound to small molecule inhibitors: implications for substrate specificity. J Med Chem 2009;52:852–7.
- Frecer V, Kabelac M, De Nardi P, et al. Structure-based design of inhibitors of NS3 serine protease of hepatitis C virus. J Mol Graph Model 2004;22:209–20.
- Frecer V, Burello E, Miertus S. Combinatorial design of nonsymmetrical cyclic urea inhibitors of aspartic protease of HIV-1. Bioorg Med Chem 2005;13:5492–501.
- Frecer V, Berti F, Benedetti F, et al. Design of peptidomimetic inhibitors of aspartic protease of HIV-1 containing -Phe Psi Pro- core and displaying favourable ADME-related properties. J Mol Graph Model 2008;27:376–87.
- Dali B, Keita M, Megnassan E, et al. Insight into selectivity of peptidomimetic inhibitors with modified statine core for plasmepsin II of Plasmodium falciparum over human cathepsin D. Chem Biol Drug Des 2012;79:411–30.
- Megnassan E, Keita M, Bieri C, et al. Design of novel dihydroxynaphthoic acid inhibitors of Plasmodium falciparum lactate dehydrogenase. Med Chem 2012;8:970–84.
- Owono Owono LC, Keita M, Megnassan E, et al. Design of thymidine analogues targeting thymidilate kinase of Mycobacterium tuberculosis. Tuberc Res Treat 2013;2013:670836.
- Keita M, Kumar A, Dali B, et al. Quantitative structure-activity relationships and design of thymine-like inhibitors of thymidine monophosphate kinase of Mycobacterium tuberculosis with favourable pharmacokinetic profiles. RSC Adv 2014;4:55853–66.
- Frecer V, Seneci P, Miertus S. Computer-assisted combinatorial design of bicyclic thymidine analogs as inhibitors of Mycobacterium tuberculosis thymidine monophosphate kinase. J Comput Aided Mol Des 2011;25:31–49.
- Owono Owono LC, Ntie-Kang F, Keita M, et al. Virtually designed triclosan-based inhibitors of enoyl-acyl carrier protein reductase of Mycobacterium tuberculosis and of Plasmodium falciparum. Mol Inform 2015;34:292–307.
- Kouassi AF, Kone M, Keita M, et al. Computer-aided design of orally bioavailable pyrrolidine carboxamide inhibitors of enoyl-acyl carrier protein reductase of Mycobacterium tuberculosis with favorable pharmacokinetic profiles. Int J Mol Sci 2015;16:29744–71.
- Esmel A, Keita M, Megnassan E, et al. Insight into binding mode of nitrile inhibitors of Plasmodium falciparum Falcipain-3, QSAR and Pharmacophore models, virtual design of new analogues with favorable pharmacokinetic profiles. J Comput Chem Molec Model 2017;2:103–24.
- Insight-II. Insight-II and Discover molecular modeling and simulation package, Version 2005. San Diego, CA: Accelrys, Inc.; 2005.
- Gilson MK, Honig B. The inclusion of electrostatic hydration energies in molecular mechanics calculations. J Comput Aided Mol Des 1991;5:5–20.
- Rocchia W, Sridharan S, Nicholls A, et al. Rapid grid-based construction of the molecular surface and the use of induced surface charge to calculate reaction field energies: applications to the molecular systems and geometric objects. J Comput Chem 2002;23:128–37.
- Discovery Studio molecular modeling and simulation program. Version 2.5. San Diego, CA: Accelrys, Inc.; 2009.
- Böttcher CJF, Theory of electric polarization. Amsterdam, Netherlands: Elsevier; 1973.
- Miertus S, Scrocco E, Tomasi J. Electrostatic interaction of a solute with a continuum. A direct utilization of ab initio molecular potentials for the prevision of solvent effects. Chem Phys 1981;55:117–29.
- Li H, Sutter J, Hoffmann R. Pharmacophore perception development and use in drug design. In: Güner OF, ed. hypoGen: an automated system for generating 3D predictive pharmacophore model. La Jolla, CA: International University Line; 2000.
- QikProp. QikProp Version 3.7, Release 14. New York, NY: X Schrödinger, LLC; 2014.
- Duffy EM, Jorgensen WL. Prediction of properties from simulations: free energies of solvation in hexadecane, octanol, and water. J Am Chem Soc 2000;122:2878–88.
- Jorgensen WL, Duffy EM. Prediction of drug solubility from Monte Carlo simulations. Bioorg Med Chem Lett 2000;10:1155–8.
- Jorgensen WL, Duffy EM. Prediction of drug solubility from structure. Adv Drug Deliv Rev 2002;54:355–66.
- MOE. Molecular Operating Environment (MOE); H3A 2R7. Montreal, QC,: Chemical Computing Group Inc.; 2014
- Maple JR, Hwang M-J, Stockfisch TP, et al. Derivation of class II force fields. I. Methodology and quantum force field for the alkyl functional group and alkane molecules. J Comput Chem 1994;15:162–82.
- Willett P. Molecular similarity in drug design. In: Dean PM, ed. Similarity-searching and clustering algorithms for processing databases of two-dimensional and three-dimensional chemical structures. Glasgow, UK: Chapman and Hall; 1994:110–137.
- Lipinski CA, Lombardo F, Dominy BW, Feeney PJ. Experimental and computational approaches to estimate solubility and permeability in drug discovery and development settings. Adv Drug Deliv Rev 2001;46:3–26.
- Schechter I, Berger A. On the size of the active site in proteases. I. Papain. Biochem Biophys Res Commun 1967;27:157–62.
- Freire E. Do enthalpy and entropy distinguish first in class from best in class. Drug Discov Today 2008;13:869–74.
- N'Guessan H, Megnassan E. In silico design of phosphonic arginine and hydroxamic acid inhibitors of Plasmodium falciparum M17 leucyl aminopeptidase with favorable pharmacokinetic profile. J Drug Design Med Chem 2017;3:86–113.
- Cotereon JM, Catterick D, Castro J, et al. Falcipain inhibitors: optimization studies of the 2-pyrimidine-carbonitrile lead series. J Med Chem 2010;53:6129–52.
- Fagnidi YKH, Toi B, Megnassan E, et al. In silico design of Plasmodium falciparum cysteine protease falcipain 2 inhibitors with favorable pharmacokinetic profile. J Anal Pharm Res 2018;7:298–309.
- Himangini PDP, Vidushi S, et al. Designing novel inhibitors against falcipain-2 of Plasmodium falciparum. Bioorg Med Chem Lett 2018;28:1566–9.