
 ?Mathematical formulae have been encoded as MathML and are displayed in this HTML version using MathJax in order to improve their display. Uncheck the box to turn MathJax off. This feature requires Javascript. Click on a formula to zoom.
Abstract
Although paraoxonase-1 (PON1) activity has been demonstrated to be a reliable biomarker of various diseases, clinical studies have been based only on relative comparison of specific enzyme activities, which capture differences mainly due to (usually unknown) PON1 concentration. Hence, the aim of this report is to present for the first time the simple evaluation method for determining autonomous kinetic parameter of PON1 that could be also associated with polymorphic forms and diseases; i.e. the Michaelis constant which is enzyme concentration independent quantity. This alternative approach significantly reduces the number of experiments needed, and it yields the results with great accuracy.
Introduction
Paraoxonase-1 (PON1) is a key Ca2+-dependent enzyme of liver-derived high-density lipoproteins (HDLs), which is linked to various pathophysiological disordersCitation1. Although the “physiological” substrates of PON1 appear to be lactones, PON1 has a large number of promiscuous activities towards organophosphate triesters, arylesters, thiolactones and cyclic carbamatesCitation2. Thus, PON1-status can be determined by measuring enzyme activity levels with different substrates, and the latter can vary by over 10-fold between individuals with various PON1 genetic polymorphisms and pathological conditionsCitation3,Citation4.
The most convenient method for determining PON1-status and functional phenotype is based on 2-dimensional enzyme activity plot that displays rates of diazoxonase versus paraoxonase activityCitation5,Citation6. As this 2-substrate assay/plot technique involves the use of two highly toxic organophosphates, identification and characterisation of non-toxic discriminatory substrates for determination of PON1 activity still excites an interest among clinical researchersCitation7. Although current assays may provide substantial diagnostic “PON1 status” values, they are constrained only to the specific enzyme activity measurements which are unavoidably affected by (unknown) PON1 concentration and its affinity to a substrate. Even though if one PON1 alloform has a lower limiting rate Vmax, but it has higher affinity (i.e. lower Michaelis constant Km) for a particular substrate, then the catalytic efficiency (Vmax/Km) and consequently specific enzyme activity measurements of both PON1 alloforms can show nearly the same values. Further, another enzyme can form ternary complex with HDL and PON1; i.e. myeloperoxidase (MPO) which produces highly reactive oxidant hypochlorous acid (HOCl). MPO oxidises PON1 on tyrosine 71, a residue found that is critical for HDL binding which impairs catalytic abilities of PON1Citation8; i.e. substrate affinity to the enzyme active site and its turnover number. Although the latter cannot be determined when active enzyme concentration is unknown, the concentration independent Km value can be more informative and consistent with true PON1 status. Thus, only an evaluation of complete set of PON1 kinetic parameters can provide predictive and conclusive evidence-based use of it as biomarker in health and disease.
Materials and methods
Study design
As our study was designed only for the development of simple and quick methodology for determination of PON1 kinetic characteristics, we selected leftover routine blood samples of six healthy blood-donors. Since the biological material used in this report were obtained from leftover routine specimens, and the samples were not used for any other particular study, informed consent from volunteers and ethical approval was unnecessary because the samples were no longer traceable.
Methods
Blood samples were collected in heparin containing tubes, and the cells were removed by centrifugation for 10 min at 2000×g. Plasma samples were afterward stored in microtubes at 4 °C. Lactonase hydrolytic activities of PON1 with dihydrocoumarin (Δε270 = 1295 M−1 cm−1) were measured spectrophotometrically at 270 nm2 within 4 h after the blood sample collection. In an assay the cuvette contained 100 μM substrate in 50 mM Tris/HCl (pH 8, 1 mM CaCl2, and 1% of methanol) in a total volume of 2 ml. The reaction was initiated by the addition of 20 μL of plasma, and full progress curve runs were carried out in less than 2 min; i.e. unless the entire substrate was converted to product (. The measurements for each sample were carried in duplicate or triplicate.
Figure 1. Fit of kinetic progress curve data for each sample. Symbols represent absorbance readings at the given reaction time. Only one progress curve per sample and only half of the data points per progress curve are shown, for clarity. Smooth lines represent least-square model curves generated by fit of the theoretical equation EquationEquation (2)(2)
(2) with the parameter values obtained by modified model (GraphPad, Lambert W) shown in .
![Figure 1. Fit of kinetic progress curve data for each sample. Symbols represent absorbance readings at the given reaction time. Only one progress curve per sample and only half of the data points per progress curve are shown, for clarity. Smooth lines represent least-square model curves generated by fit of the theoretical equation EquationEquation (2)(2) [P]t=[S]0−Km⋅(1.45869⋅ ln (1.2⋅x ln (2.4⋅x ln (1+2.4⋅x)))−0.45869⋅ ln (2⋅x ln (1+2⋅x)))(2) with the parameter values obtained by modified model (GraphPad, Lambert W) shown in Table 1.](/cms/asset/e5143cd3-6320-4e9c-be95-d2218282e039/ienz_a_1695792_f0001_b.jpg)
Data analysis
Progress curve experimental data were analysed by nonlinear regression fitting programme Dynafit using either numerical integration of differential equations that describe simple Michaelis–Menten reaction model E + S ⇆ ES → E + P or newly described algebraic solution for the Michaelis–Menten equation, which includes the Lambert W(x) functionCitation9,Citation10:
(1)
(1)
Vmax and Km in EquationEquation (1)(1)
(1) represent the limiting velocity and Michaelis constant, respectively. Finally, the approximation to the Lambert W function in EquationEquation (1)
(1)
(1) for the product accumulation was also implemented into the GraphPad Prism (GraphPad Software, San Diego, California, USA) software package as a user-defined built-in explicit model equation for calculating model curvesCitation11:
(2)
(2)
where
(3)
(3)
Results and discussion
The individual time–course data for each sample (), and the nonlinear regression analyses in terms of different computing approaches give the fitted theoretical curves for the Michaelis–Menten reaction model. Progress curves were first analysed by numerical integration approach, which has been the most widely used method for time–course data analysis among enzymologists (, DynaFit numerical integration). Therefore, the best fit to the time–product concentration data obtained by performing DynaFit numerical integration programme yielded the reference values Km, Vmax and [S]0 (see ). However, the latter numerical approach can have drawbacks that are widely ignored and show several weak pointsCitation12, although the most common computing method to progress–curve analysis these days is to use numerical integration solvers linked to nonlinear regression algorithms. Hence, we also estimated the kinetic parameters in terms of an algebraic approach that gives the direct solution of EquationEquation (1)(1)
(1) to the integrated Michaelis–Menten rate equation (, DynaFit Lambert W)Citation9. Unfortunately, the requirement for the Lambert W(x) built-in function in software (e.g. Maplesoft Maple, Mathworks Matlab, BioKin DynaFit) in this alternative explicit expression to the integrated model rate equation for computing product accumulation with EquationEquation (1)
(1)
(1) is another drawback as the most available curve-fitting software packages (e.g. Microsoft Excel, GraphPad Prism, Systat SigmaPlot) are not set up to handle equations that involve W(x), and hence they are of none use for direct time–course data analysis in terms of EquationEquation (1)
(1)
(1) . To avoid this problem, we finally used the solution for [P]t based on an exact approximation EquationEquation (2)
(2)
(2) , which is elementary and consequently easily implemented in any standard softwareCitation11 and calculated kinetic parameters from progress curves (, GraphPad Lambert W). shows a fit of the reaction progress curves data in GraphPad Prism by using EquationEquation (2)
(2)
(2) ; i.e. the approximation to the Lambert W function in EquationEquation (1)
(1)
(1) . summarises all values of the fitted estimates of the kinetics parameters where the best parameter values yielded almost identical good fits to the experimental data for all of the computing methods. The given values are also in agreement with the results obtained by the traditional double-reciprocal Lineweaver-Burk plots methodologyCitation2.
Table 1. Parameters aquired by progress–curve fitting. Comparison of fitted values obtained using the numerical integration approach (DynaFit, see Ref. [Citation9]), the exact algebraic model EquationEquation (1)(1)
(1) with the Lambert W(x) function (DynaFit, see Ref. [Citation9]), and the approximation of W(x) of the modified model EquationEquation (2)
(2)
(2) (GraphPad, Lambert W, see Ref. [Citation11]). The measurements for each sample were carried in duplicate or triplicate. Data are means ± SD.
PON1 enzyme levels can range widely even between individuals with the same PON1 genotypes, and hence PON1 status which considers both PON1 genotypes and PON1 activity is a more informative for use in epidemiological studies then PON1 genotype aloneCitation1,Citation3. Due to the relatively high concentrations of PON1 in human blood, many studies have also been performed on the inhibitory effect of medical drugsCitation13–16 or metal elementsCitation17 on PON1 activity. Recent studies have shown that there is also a specific interaction of MPO-apoAI-PON1 on HDL surface that seems to be germane to the development of different diseasesCitation8. Therefore, PON1 studies widely utilise various assays for determination of PON1 phenotypes whenever possible, but unfortunately they are usually limited only on the specific enzyme activity measurements, and mostly with highly toxic substratesCitation3–6.
Although basic biochemical and physiological principles dictate that it is the activity of a given enzyme that is important with respect to its function, two kinetic parameters determine the activity of enzyme at given substrate concentration; i.e. limiting rate Vmax (=kcat·[E]T) which depends on turnover number and enzyme active sites concentration, and the Michaelis constant Km which is not concentration dependent characteristics of an enzyme. However, the values of Km are associated with polymorfic formsCitation2, enyzme modifications and its environment.
Traditionally, the quantitative kinetics of enzyme-catalyzed reactions have been studied in terms of the correlation between initial rates and substrate concentrations according to the hyperbolic Michaelis–Menten equation. Although direct analysis that use Michaelis–Menten equation is easy to perform by various nonlinear regression curve-fitting programmes, the initial-velocity measurements still require a high number of individual experiments, due to the high sensitivity of the reaction rates to noiseCitation18. On the other hand, analyses of complete progress curves can provide the same information, although this can be achieved with a single experimental assay that measures the kinetics data at every concentration between the initial value and that at the end of the reaction.
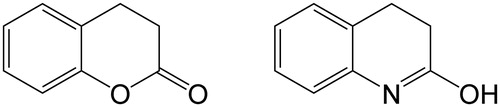
However, the choice of the substrate is crucial for practical single progress–curve assays. The required experimental condition for the independent estimation of both Km and Vmax from a progress curve is the initial substrate concentration which must be of the same order of magnitude as KmCitation12, and the substrates with high Km values are not usable for such assays. Consequently, we decided for measuring of the PON1 lactonase activity with dihydrocoumarine which is non-toxic and shows low but significant twofold difference of Km values for the most widely PON1 isoforms (Km = 22 μM for Q-type, Km = 13 μM for R-type, see Ref. [Citation2]) Consequently, we were also able to avoid the problems with insolubility and spontaneous hydrolysis with the use of low initial substrate concentration. It should be remembered that structuraly mimetic molecule 2-hydroxyquinoline () specifically inhibits enzymatic activities of PON1 with low Ki (∼2 μM)Citation2. However, since there evidently are two PON1 isoforms present, the assay yields an averaged Km value in a case of heterozygote, meaning for correct PON1 status both, genotype and PON1 activity should be followed.
Figure 2. Paraoxonase-1 lactone substrate dihydrocoumarine (left) and its competitive inhibitor 2-hydroxyquinoline (right).
In conclusion, traditional Km determining double-reciprocal Lineweaver-Burk approach is not applicable when dealing with hundreds of biological samples in clinical diagnostic or high throughput screening drug research. This study provided an opportunity to carefully examine challenges that may exist when using quick and safe PON1 single progress–curve measurements with non-toxic substrate, and simple direct calculation of kinetic parameters from raw time–concentration data by performing any available nonlinear curve-fitting approach and software like MS ExcelCitation19. We believe that prompt and accurate evaluation of both kinetic parameters Km and Vmax is essential for determination of any enzyme status and provides more information than genotype and specific activity of the enzyme alone.
Acknowledgements
The authors thank Marjan Kužnik for his kind help with experimental work.
Disclosure statement
No potential conflict of interest was reported by the authors.
Additional information
Funding
References
- Camps J, Marsillach J, Joven J. The paraoxonases: role in human diseases and methodological difficulties in measurements. Crit Rev Clin Lab Sci 2009;46:83.
- Billecke S, Draganov D, Counsell R, et al. Human serum paraoxonase (PON1) isoenzyme Q and R hydrolyze lactones and cyclic carbonate esters. Drug Metab Dispos 2000;28:1335.
- Ceron JJ, Tecles F, Tvarijonaviciute A. Serum paraoxonase-1 measurements: an update. BMC Vet Res 2014;10:74.
- Garelnabi M, Younis A. Paraoxonase-1 enzyme activity assay for clinical samples: validation and correlation studies. Med Sci Monit 2015;21:902.
- Teiber JF, Kramer GL, Haley RW. Methods for measuring serum activity levels of the 192 Q and R isoenzymes of paraoxonase 1 in QR heterozygous individuals. Clin Chem 2013;59:1251.
- Mackness B, Mackness M. Unexpectedly higher diazoxon hydrolysis by serum paraoxonase-1 in coronary heart disease. Clin Biochem 2019;65:21.
- Richter RJ, Jarvik GP, Furlong CE. Determination of paraoxonase 1 status without the use of toxic organophosphate substrates. Circ Cardiovasc Genet 2008;1:147.
- Huang Y, Wu Z, Riwanto M, et al. Myeloperoxidase, paraoxonase-1, and HDL form a functional ternary complex. J Clin Invest 2013;123:3815.
- Reytor Gonzales ML, Cornell-Kennon S, Shaefer E, Kuzmič P. An algebraic model to determine substrate kinetic parameters by global nonlinear fit of progress curves. Anal Biochem 2017;518:16.
- Goličnik M. The integrated Michaelis-Menten rate equation: déjà vu or vu jàdé?. J Enzyme Inhib Chem Med 2013;28:879.
- Goličnik M. On the Lambert W function and its utility in biochemical kinetics. Biochem Eng J 2012;406:94.
- Zavrel M, Kochanowski K, Spiess AC. Comparison of different approaches and computer programs for progress curve analysis of enzyme kinetics. Eng Life Sci 2010; 10:191.
- Alici HA, Ekinci D, Beydemir S. Intravenous anesthetics inhibit human PON1 activity in vitro and in vivo. Clin Biochem 2008;41:1384.
- Ekinci D, Beydemir S. Evaluation of the impacts of antibiotic drugs on PON1. Eur J Pharmacol 2009;617:84.
- Ekinci D, Beydemir S. Effect of some analgesics on paraoxonase-1 purified from human serum. J Enzyme Inhib Med Chem 2009;24:1034.
- Ekinci D, Şentürk M, Beydemir Ş, et al. An alternative purification method for human serum paraoxonase 1 and its interactions with sulphonamides. Chem Biol Drug. Des 2010;76:552.
- Ekinci D, Beydemir S. Purification of PON1 from human serum and assessment of enzyme kinetics against metal toxicity. Biol Trace Elem Res 2010;135:112.
- Duggleby RG. Quantitative analysis of the time courses of enzyme-catalyzed reactions. Methods 2001;24:168.
- Kemmer G, Keller S. Nonlinear least-squares data fitting in Excel spreadsheets. Nature Protocols 2010;5:267.