
Abstract
The dual phosphatases CDC25 are involved in cell cycle regulation and overexpressed in many tumours, including melanoma. CDC25 is a promising target for discovering anticancer drugs, and several studies focussed on characterisation of quinonoid CDC25 inhibitors, frequently causing undesired side toxic effects. Previous work described an optimisation of the inhibition properties by naphthylphenylamine (NPA) derivatives of NSC28620, a nonquinonoid CDC25 inhibitor. Now, the CDC25B•inhibitor interaction was investigated through fluorescence studies, shedding light on the different inhibition mechanism exerted by NPA derivatives. Among the molecular processes, mediating the specific and high cytotoxicity of one NPA derivative in melanoma cells, we observed decrease of phosphoAkt, increase of p53, reduction of CDC25 forms, cytochrome c cytosolic translocation and increase of caspase activity, that lead to the activation of an apoptotic programme. A basic knowledge on CDC25 inhibitors is relevant for discovering potent bioactive molecules, to be used as anticancer agents against the highly aggressive melanoma.
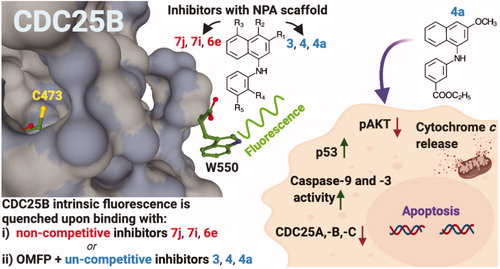
Graphical Abstract
1. Introduction
Although the different types of cancer are characterised by a great heterogeneity, one of the main and more common traits is represented by a deregulation of the cell cycle. Indeed, many (chemo)therapeutic agents act on cell cycle through the inhibition of macromolecules involved in the regulation of cell cycle progressionCitation1. Cyclin-dependent kinases (CDKs) are pivotal regulators of cell cycle; they are active when linked to specific cyclins and their regulation involves the binding to negative modulators and/or the occurrence of phosphorylation/dephosphorylation eventsCitation1,Citation2. In particular, the CDK•cyclin complexes are inactivated through the phosphorylation of specific residues of threonine and tyrosine in the CDK subunit. The control of cell cycle progression also involves the action of CDC25 enzymes, catalysing the removal of the inhibitory phosphate groups in CDKsCitation3. Indeed, the dephosphorylation of CDK threonine and tyrosine residues is catalysed by CDC25 dual phosphatases, highly conserved and present in all eukaryotes, except plantsCitation4–6. There are three forms of CDC25 enzymes, CDC25A, –B and –C. CDC25A is mainly involved in the regulation of both G1/S and G2/M transitions. In particular, in G1 phase CDC25A dephosphorylates and thus activates CDK4 and CDK6, and then, in late G1 phase promotes the G1/S transition, by dephosphorylating and activating the CDK2•cyclin A and CDK2•cyclin E complexesCitation5. Furthermore, CDC25A also activates the CDK1•cyclin B complex, thus contributing to the G2/M progressionCitation7. The CDC25B-mediated dephosphorylation of Thr14 and Tyr15 residues in CDK1 activates this kinase and promotes the cell entry into mitosis. Thus, CDC25B can be considered as a mitotic inducer, because it participates in the cytoplasmic CDK1•cyclin B activation. The main role of CDC25C is to maintain the activated state of the CDK1•cyclin B complex in the nucleus, thus ensuring a full progression into mitosisCitation4,Citation8,. However, in adult tissues, the functions of three CDC25 paralogues can be compensatory among themCitation9,Citation10,.
An overexpression of CDC25, mainly –A and –B enzymes, has been observed in many cancers, including melanoma, a finding frequently associated to tumour increased aggressiveness and fatal prognosisCitation11–14. Hence, CDC25 phosphatases are considered potential targets for anti-neoplastic therapies. To date, different types of molecules endowed with CDC25 inhibitory action have been described. Some of them exert a toxic effect in tumour cellsCitation15–18, whereas others induce a decrease of tumour size through its growth arrest, when tested on mice-xenografted human tumoursCitation19–21. CDC25 inhibitors can be classified as quinonoids, thiophenic derivatives, electrophilic inhibitors, phosphate surrogates or coumarinsCitation22–29. However, none of CDC25 inhibitors have been further selected for in vivo experiments, because of their low activity and poor selectivityCitation8. Hence, the synthesis and characterisation of new molecules endowed with an increased inhibitory activity towards CDC25 and lower adverse effects are required. In a previous work, we have reported the biochemical and biological characterisation of NSC28620 (), a nonquinonoid reversible competitive inhibitor of CDC25B endowed with Ki 5.3 µM, that reduced the cell growth rate of some tumour cells, when added at 200 µMCitation16. An optimisation programme on this lead compound was realised, and 31 derivatives with naphthylphenylketone (NPK) and naphthylphenylamine (NPA) structure were obtainedCitation18. Some of the NPA derivatives displayed a higher inhibition power compared to the lead compound, such as the most active one, 7j (), having a Ki value of 0.8 µM. Contrary to NSC28620, derivatives were apparently characterised by two main types of reversible inhibition, that is, noncompetitive or uncompetitive. Furthermore, one NPA derivative, 4a, when added at 10 µM, significantly reduced the cell growth of melanoma cells through an arrest in the G2/M phase of cell cycle and increased the phosphoCDK1 (pCDK1) protein levels.
Figure 1. Chemical structure of CDC25B inhibitor NSC28620 and selected NPA derivatives.
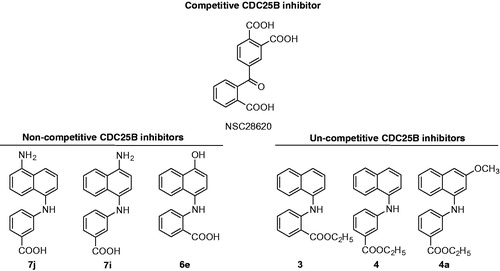
In this work, we have performed a deeper investigation on the interaction between CDC25B and selected NPA derivatives of the lead NSC28620: compounds 7j, 7i and 6e as representatives of putative noncompetitive inhibition, and compounds 3, 4 and 4a as representatives of putative uncompetitive inhibition ().
The previous study showed that the interaction between CDC25B and its inhibitors could be followed through measurements of intrinsic fluorescence of the purified recombinant enzyme, thanks to the presence of a single tryptophan (W550) in its catalytic domainCitation18. A deeper insight on this powerful tool was realised by using wild-type and mutant C473S version of CDC25B, thus allowing the measurement of parameters related to direct or substrate-mediated interaction between the enzyme and its ligands. Furthermore, the previous work demonstrated that, among the NPK and NPA derivatives, only compound 4a exerted a significant antiproliferative action at a low dose in melanoma cellsCitation18. Here, we have better characterised the mechanism mediating the toxic action of 4a in melanoma cells. In particular, we have shown that this inhibitor induces the activation of an apoptotic programme, mainly mitochondria- and caspase-mediated. In addition, 4a reduces the protein levels of all three forms of CDC25 and affects the expression of typical proliferation and apoptotic markers, such as phosphoAkt (pAkt) and p53.
2. Materials and methods
2.1. Materials and reagents
Stock solutions of the NPA derivatives of NSC28620 were prepared in dimethylsulphoxide (DMSO) at 20 mM concentration; when diluted in the aqueous solution, the final concentration of the various compounds never exceeded 50 µM. The stock solution of O-methylfluorescein phosphate (OMFP) was prepared in methanol at 2 mM concentration. For the production of the recombinant form of CDC25B catalytic domain, a heterologous expression system was used, constituted by the vector pET28a-CDC25B-cd, kindly provided by H. Bhattacharjee (Florida International University, Herbert Wertheim College of Medicine, Miami, Florida) and the Escherichia coli BL21(DE3) strain from Novagen (Madison, WI, USA); the purification procedure was essentially as previously describedCitation18. Dulbecco’s modified Eagle’s medium (DMEM), Medium 199, foetal bovine serum (FBS), L-glutamine, penicillin G, streptomycin, and trypsin were bought from Lonza (Milano, Italy). Isopropyl-β-thiogalactopyranoside (IPTG), Tris-(2-carboxyethyl)-phosphate hydrochloride (TCEP), OMFP, propidium iodide (PI) were purchased from Sigma Aldrich (St. Louis, MO, USA). A protease inhibitor cocktail was obtained from Roche Diagnostics (Indianapolis, IN, USA). Caspase-3 and caspase-9 fluorimetric assay kits were purchased from BioVision (Milpitas, CA, USA). The pancaspase inhibitor Z-VAD-FMK was purchased from Selleckchem (Houston, TX, USA). Rabbit monoclonal antibody against GAPDH was purchased from Cell Signalling Technology (Danvers, MA, USA). Mouse monoclonal antibody against COX-IV was purchased from Elabscience (Houston, TX, USA). Mouse monoclonal antibody against β-tubulin was purchased from Sigma-Aldrich. FITC donkey, anti-mouse secondary antibody was purchased from Jakson ImmunoResearch (Suffolk, UK). Rabbit polyclonal antibodies against CDC25B, pAkt (Ser473) or Akt and mouse monoclonal antibodies against cytochrome c, CDC25A, CDC25C or p53, as well as HRP conjugated secondary antibody were purchased from Santa Cruz Biotechnology (Heidelberg, Germany). All other reagents and solvents of high analytical grade were from Sigma-Aldrich.
2.2. Preparation of CDC25B-C473S
The mutant form of CDC25B, carrying the C473S replacement (CDC25B-C473S), was obtained through site-directed mutagenesis of the CDC25B catalytic segment cloned in pET28a-CDC25B-cd. To this aim, the QuikChange site-directed mutagenesis kit (Stratagene, La Jolla, CA, USA) and the forward and reverse primers for C473S replacement (5′d-ATCCTCATTTTCCACTCTGAATTCTCATCTGAG-3′ and 5′d-CTCAGATGAGAATTCAGAGTGGAAAATGAGGAT-3′) were used. Positive clones were obtained, and the nucleotide sequencing of the mutagenised segment excluded the presence of undesired mutations. The new vector was called pET28a-CDC25B-C473S-cd. The expression of the new vector and the purification of the recombinant form of CDC25B-C473S catalytic domain were carried out as previously reported for wild-type CDC25B catalytic domainCitation18, and similar yields were obtained. As expected, the mutant enzyme was unable to hydrolyse the synthetic substrate OMFP, when its activity was checked with the fluorimetric assay method previously describedCitation18.
2.3. Fluorescence studies on the purified catalytic domain of CDC25B and CDC25B-C473S
Fluorescence spectra were recorded at 20 °C using a computer-assisted Cary Eclipse spectrofluorimeter (Varian, Palo Alto, CA, USA) equipped with an electronic temperature controller. The excitation wavelength was set at 280 nm and the excitation and emission slits were set at 10 and 20 nm, respectively. A 500 µL final volume of a 0.2 µM solution of CDC25B or CDC25B-C473S dissolved in 20 mM Tris•HCl, pH 7.8, 0.5 mM TCEP was directly prepared in the fluorimetric cuvette in the absence or in the presence of OMFP and/or some NPA derivatives. Serial pre-dilutions of the NPA derivatives or OMFP at increasing concentration were prepared in DMSO or methanol, respectively. Alongside, a convenient amount of the enzyme pre-dilution was prepared just before its usage for the experiment and stored on ice. When the combined effect of NPA derivative and OMFP was investigated, two enzyme pre-dilutions were prepared in the absence or in the presence of 5 µM OMFP. In order to evaluate the specific effect produced by any addition of solvent/ligand on the intrinsic fluorescence of the enzyme, 495 µL of the enzyme pre-dilution were placed in the fluorimetric cuvette and the relative spectrum was recorded; after the addition of 5 µL of each pre-dilution of solvent/ligand and fast mixing, the spectrum was recorded again. This procedure, repeated for each experimental point, allowed a normalisation of the specific effects produced by solvent/ligands. Furthermore, a correction was also applied for the little inner-filter effect due to the absorbance at 280 nm of the NPA derivative used at different concentrations; on the other hand, no correction was necessary for OMFP. All spectra, recorded at a scan speed of 120 nm/min, were normalised and corrected.
2.4. Cell cultures
The human melanoma cell lines A375 and A2058, deriving from a primary tumour or lymph nodal metastasis, respectively, were kindly provided from CEINGE (Naples, Italy). Cells were grown in DMEM supplemented with 10% FBS, 2 mM L-glutamine, 100 IU/mL penicillin G and 100 µg/mL streptomycin in humidified incubator at 37 °C under 5% CO2 atmosphere. The cell line BJ-5ta, a human skin fibroblast immortalised with the human telomerase reverse transcriptaseCitation30 was cultured in a 4:1 mixture of DMEM and Medium 199 supplemented with 4 mM L-glutamine, 4.5 g/L glucose, 1.5 g/L sodium bicarbonate, 10% FBS, 100 IU/mL penicillin G, 100 mg/mL streptomycin in humidified incubator at 37 °C under 5% CO2 atmosphere. All cells were split and seeded every 3 days and used during their exponential phase of growth. Cell treatments were usually carried out after 24 h from plating.
2.5. Evaluation of apoptosis
Cytofluorimetric analysis was used to determine the number of apoptotic nuclei essentially as previously describedCitation31. Briefly, cells were seeded into six-well plates at 3 × 10⁵ cells/well and after 24 h were treated with 4a or 0.5% (v/v) DMSO and incubated for different times. Then, cells were harvested with trypsin, and centrifuged, and the pellets were resuspended in 200 µL of a hypotonic lysis solution containing 50 µg/mL PI. After incubation at 4 °C for 30 min, cells were analysed with a FACScan flow cytometer (Becton Dickinson, Franklin Lakes, NJ, USA) to evaluate the presence of nuclei with DNA content lower than diploid.
2.6. Measurement of caspase-3 and caspase-9 activity
The caspase-3 and caspase-9 enzymatic activity was measured by using caspase-3 and -9 fluorimetric assay kits, respectively, according to the manufacturer’s protocol. Briefly, cells were seeded into 75 cm2 plates (2 × 10⁶ cells/plate) and after 24 h treated with 4a or 0.5% (v/v) DMSO for 24 h. At the end of incubation, cells were collected, washed with phosphate-buffered saline constituted by 10 mM Na2HPO4, 2 mM KH2PO4, pH 7.4, supplemented with 137 mM NaCl and 2.7 mM KCl (PBS), and finally lysed at 4 °C in the cell lysis buffer. Cell lysates were incubated with 50 µM DEVD-AFC or LEHD-AFC substrates at 37 °C for 2 h, to detect caspase-3 or caspase-9 activity, respectively, using a Cary Eclipse spectrofluorimeter. Excitation and emission wavelengths were set at 400 nm and 505 nm, respectively; both excitation and emission slits were set at 10 nm.
2.7. Total cell lysates and subcellular fractionation for Western blotting analysis
To obtain the total protein extract, cells were seeded into 6-well-plates (3 × 10⁵ cells/plate) for 24 h at 37 °C and then treated with 4a or 0.5% (v/v) DMSO. After treatment, cells were harvested, washed with PBS, and then lysed in ice-cold modified radio immunoprecipitation assay (RIPA) buffer (50 mM Tris•HCl, pH 7.4, 150 mM NaCl, 1% Nonidet P-40, 0.25% sodium deoxycholate, 1 mM Na3VO4 and 1 mM NaF), supplemented with protease inhibitors and incubated for 30 min on ice. The supernatant, obtained after centrifugation at 13200 g for 30 min at 4 °C, constituted the total protein extract. Protein concentration was determined by the Bradford method, using bovine serum albumin (BSA) as standardCitation32. To obtain the cytosolic and mitochondrial fractions, cells were plated at a density of 2 × 10⁶ cells/plate for 24 h at 37 °C. After the treatment with 4a or 0.5% (v/v) DMSO, cells were harvested, washed in PBS, and then resuspended in buffer A (5 mM Hepes, pH 7.4, 250 mM mannitol, 0.5 mM EGTA, 0.1% BSA), supplemented with protease inhibitors, and homogenised. The homogenate was centrifuged at 600 g for 5 min at 4 °C and the supernatant was then centrifuged at 10300 g for 10 min at 4 °C. The resulting supernatant represented the cytosolic fraction, whereas the pellet, constituting the mitochondrial fraction was resuspended in RIPA buffer. Protein concentration was determined as previously indicated. Equal amounts of total, cytosolic or mitocondrial protein extracts were used for Western blotting analysis. Briefly, protein samples were dissolved in SDS-reducing loading buffer, run on sodium dodecylsulfate polyacrylamide gel electrophoresis (SDS/PAGE), and then transferred to Immobilon P membrane (Millipore, Saint Louis, MO, USA). The filter was incubated with the specific primary antibody at 4 °C overnight and then with the secondary antibody at room temperature for 1 h. Membranes were then analysed by an enhanced chemiluminescence reaction using WesternBright ECL (Advansta, San Jose, CA, USA) according to manufacturer’s instructions; signals were visualised by autoradiography. The analysis of pAkt protein levels was performed as previously describedCitation33. Briefly, filters were first incubated with the anti-pAkt primary antibody and then with the secondary antibody and membranes were analysed by an enhanced chemiluminescence reaction as previously indicated. The same filters were then stripped, using AbCam (Cambridge, UK) stripping solution, pH 2 (200 mM glycine, 3.5 mM SDS, 1% Tween-20) at 45 °C for 30 min, washed 3 times with PBS-Tween 0.1%, incubated with anti-Akt primary antibody and then with the relative secondary antibody. Signals were detected as previously specified.
2.8. Immunofluorescence staining
Immunofluorescence experiments were carried out essentially as previously describedCitation34. Briefly, cells were plated on glass coverslips at a density of 3 × 10⁵ cells/well in 6-well plates, and after 24 h were treated with 4a or 0.5% (v/v) DMSO. At the end of treatment, cells were incubated with 90 nM MitoTracker Red (Invitrogen, Inchinnan, UK) at 37 °C for 1 h and then washed three times with ice-cold PBS. Cells were fixed with 4% paraformaldehyde, and then blocked in donkey serum (Millipore) diluted 1:10 in PBS, for 30 min at room temperature. Glass coverslips were incubated for 1 h at 37 °C with a mouse monoclonal antibody against cytochrome c, diluted 1:50 in PBS, washed three times with PBS and subsequently incubated for 1 h at 37 °C with a FITC donkey anti-mouse secondary antibody diluted 1:50 in PBS. After three washings in PBS, the cell nuclei were labelled with DAPI (Vector Laboratories, Inc., Burlingame, CA, USA). Glass coverslips mounting was done in Vectashield (Vector Laboratories). The images were taken with digital camera connected to the microscope (Leica DFC345FX, Leica Microsystems, Wetzlar, Germany) and then merged with the software Leica Application Suite 3.6.
2.9. Statistical analysis
Data are reported as the mean ± standard error (SE). The statistical significance of differences among groups was evaluated using ANOVA, with the Bonferroni correction as post hoc test or the Student’s t-test where appropriate. The significance was accepted at the level of p < 0.05.
3. Results and discussion
3.1. Intrinsic fluorescence of CDC25B and its C473S mutant
The presence of a single tryptophan residue, W550, in the catalytic domain of CDC25B is particularly attracting for analysing the binding interaction with its ligands through a spectrofluorimetric analysis. Indeed, W550 is located on the edge of the CDC25B region called swimming pool and has a great exposure to the water environment, as suggested by the position of its emission maximum in the fluorescence spectrumCitation18. Furthermore, the swimming pool is adjacent to the catalytic site of CDC25B, and several ligands of this enzyme have been proposed to bind directly into this concave pocket or into a larger region including both swimming pool and catalytic siteCitation24,Citation25,Citation35.
Among the various ligands of CDC25B, the OMFP represents the common synthetic substrate used to measure the phosphatase activity of all CDC25 forms. Upon its binding to the enzyme, the nonfluorescent OMFP is hydrolysed to the fluorescent product OMF, thus allowing a measurement of the catalytic activity through the rate of OMF formation. In order to study the interaction between CDC25B and OMFP without the “complication” of its hydrolysis, a recombinant mutant CDC25B with the catalytic C473 residue replaced by serine was designed and prepared (CDC5B-C473S). As expected, the mutant enzyme is unable to hydrolyse OMFP (not shown), but has an emission spectrum almost superimposable to that of wild-type CDC25B, with only a minimum red-shift of its maximum (Supplementary Figure 1). In order to analyse the effects of various ligands on the emission spectrum of both wild-type and C473 mutant CDC25B, we have chosen 357 nm as a common wavelength for the emission maximum. These observations indicate that the C473S replacement renders the enzyme inactive, but does not essentially alter the fluorescent emission of the enzyme. Therefore, we took advantage of these properties to study the interaction between the enzyme and substrate in the absence of catalysis.
3.2. Interaction between CDC25B-C473S and the substrate OMFP evaluated through intrinsic fluorescence measurements
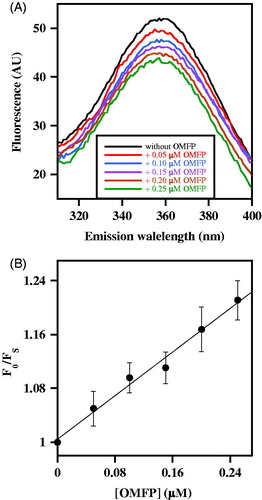
The effects produced by an increasing OMFP concentration on CDC25B-C473S fluorescence spectrum were evaluated. In the presence of OMFP, a dose-dependent quenching of the fluorescence yield is observed, without a shift of the emission maximum (). This behaviour allows an evaluation of the parameters governing the enzyme•ligand interaction, by comparing the fluorescence emission at 357 nm obtained at each substrate concentration (FS) with the corresponding value obtained in the absence of substrate (F0). The data were then analysed with the Stern-Volmer equation, F0/FS = 1 + KSV [Q], stating that the fluorescence reduction (F0/FS) of the fluorophore linearly increases with the quencher (Q) concentration. Indeed, the data fit a straight line starting from F0/FS = 1 with a slope equal to the Stern-Volmer constant KSV (). This result suggests that the interaction between CDC25B-C473S and OMFP causes a dose-dependent quenching of the intrinsic fluorescence due to W550. The value of KSV extrapolated from the equation is 0.814 µM−1 and its reciprocal represents the OMFP concentration, i.e. 1.23 µM, leading to 50% quenching of CDC25B-C473S fluorescence emission. This value could also correspond to the equilibrium dissociation constant (K′D) of the enzyme•substrate complex. Interestingly, this value is even lower than the affinity constant KM of the wild type CDC25B for the substrate OMFP, as previously reported (KM = 2.7 ± 0.2 µM)Citation18. Therefore, these data suggest that CDC25B-C473S tightly binds the substrate in a way similar to that of CDC25B.
Figure 2. Effect of OMFP on the intrinsic fluorescence of recombinant CDC25B-C473S. (a) The fluorescence spectra of 0.2 µM CDC25B-C473S in the absence or in the presence of the indicated OMFP concentration were recorded and normalised as indicated in Materials and Methods. An identical 1% (v/v) final concentration of both methanol and DMSO is present in all samples. (b) The data of fluorescence emission at 357 nm obtained in the absence (F0) or in the presence of each OMFP concentration (FS) were treated according to the Stern–Volmer equation.
3.3. Interaction between CDC25B and its inhibitors evaluated through intrinsic fluorescence measurements
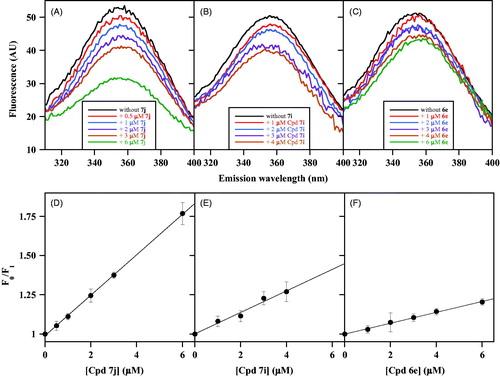
The intrinsic fluorescence of CDC25B represents a powerful tool for investigating the interaction of the enzyme with its inhibitors. According to the mechanism of inhibition investigated by Lineweaver–Burk plots of CDC25B phosphatase activity, the various NPA derivatives of NSC28620 have been putatively assigned to two main groups, that is, noncompetitive or uncompetitive inhibitors. In particular, the compounds chosen as representative members of noncompetitive inhibition are 7j, 7i and 6e having Ki of 0.8 µM, 1.4 µM and 2.7 µM, respectively. reports the effects produced by these noncompetitive inhibitors on the intrinsic fluorescence of CDC25B. The emission spectra obtained in the presence of an increasing concentration of 7j (), 7i () or 6e () indicate that each inhibitor causes an evident dose-dependent quenching of the fluorescence signal, although with different effects probably depending on the relative inhibition power. Also in this case, no shift of the emission maximum is observed, and therefore, the fluorescence signal at 357 nm at each inhibitor concentration (FI) is compared with the corresponding value obtained in the absence of inhibitor (F0), using the Stern–Volmer equation. From the corresponding plots of 7j (), 7i () and 6e (), the calculated values of KSV were 0.129 µM−1 for 7j, 0.069 µM−1 for 7i and 0.035 µM−1 for 6e. The reciprocal of these values (7.8 µM for 7j, 14.5 µM for 7i and 28.6 µM for 6e) represents the inhibitor concentration leading to 50% quenching of CDC25B emission and possibly evaluates the K′D of the enzyme•inhibitor complex.
Figure 3. Effect of some noncompetitive inhibitors on the intrinsic fluorescence of recombinant CDC25B. The fluorescence spectra of 0.2 µM CDC25B in the absence or in the presence of the indicated concentrations of 7j (a), 7i (b) or 6e (c) were recorded, normalised and corrected as indicated in Materials and Methods. An identical 1% (v/v) final concentration of DMSO is present in all samples. The data of fluorescence emission at 357 nm obtained in the absence (F0) or in the presence of each inhibitor concentration (FI) for 7j (d), 7i (e) or 6e (f) were treated according to the Stern–Volmer equation.
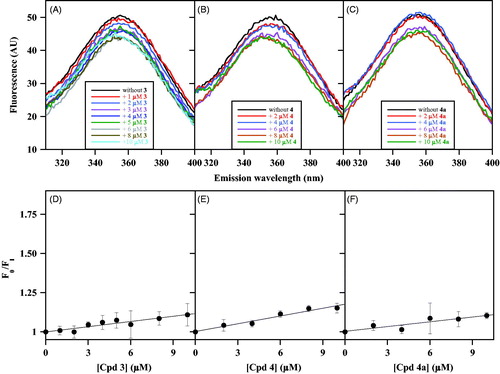
Moving to the NPA derivatives approaching the uncompetitive inhibition, compounds selected from this class were 3, 4 and 4a with Ki values of 2.8 µM, 7.3 µM and 8.5 µM, respectively. The minimum effect produced by these putative uncompetitive inhibitors on the intrinsic fluorescence of CDC25B is shown in . Indeed, differently from the results obtained with noncompetitive inhibitors, the emission spectra obtained in the presence of an increasing concentration of 3 (), 4 () or 4a () exhibit a very low dose-dependent quenching. This behaviour also emerges from the low values of the straight-line slopes obtained when the data were analysed with the Stern-Volmer equation for 3 (), 4 () or 4a (). Indeed, the calculated values of KSV (0.011 µM−1 for 3, 0.016 µM−1 for 4, and 0.010 µM−1 for 4a) are significantly lower than those obtained with the noncompetitive inhibitors. As a consequence, the inhibitor concentration leading to 50% quenching of CDC25B emission is consistently greater than 50 µM for these inhibitors, a finding indicating that these compounds only display a very weak interaction with CDC25B, at least in the absence of OMFP.
Figure 4. Effect of some uncompetitive inhibitors on the intrinsic fluorescence of recombinant CDC25B. The fluorescence spectra of 0.2 µM CDC25B in the absence or in the presence of the indicated concentrations of 3 (a), 4 (b) or 4a (c) were recorded, normalised and corrected as indicated in Materials and Methods. An identical 1% (v/v) final concentration of DMSO is present in all samples. The data of fluorescence emission at 357 nm obtained in the absence (F0) or in the presence of each inhibitor concentration (FI) for 3 (d), 4 (e) or 4a (f) were treated according to the Stern–Volmer equation.
3.4. Effect of the NPA derivatives on the intrinsic fluorescence of CDC25B-C473S in the absence or in the presence of OMFP
The weak binding interaction resulting from the intrinsic fluorescence experiments performed with the uncompetitive inhibitors 3, 4 and 4a suggests the hypothesis that these NPA derivatives are unable to form a stable CDC25B•inhibitor complex. Therefore, the possible formation of this complex in the presence of the substrate OMFP was investigated; in this case, one would expect that the minimum quenching of CDC25B emission observed with the uncompetitive inhibitor alone would increase when the enzyme is already bound to its substrate. To check this hypothesis, the mutant CDC25B-C473S turned to be useful, because this enzyme binds OMFP, but does not catalyse its hydrolysis.
The effects produced by the uncompetitive inhibitors 3, 4 and 4a, as well as by the noncompetitive inhibitor 7j, on the intrinsic fluorescence of CDC25B-C473S in the absence or in the presence of 5 µM OMFP were investigated. In the absence of OMFP, the uncompetitive inhibitors cause a very low dose-dependent quenching of the CDC25B-C473S spectrum, similar to that exhibited by the wild-type CDC25B; on the other hand, in the presence of a saturating OMFP concentration, besides a roughly 50% reduction of fluorescence yield due to the quenching by the substrate, the inhibitors cause a consistent dose-dependent quenching (Supplementary Figure 2). Either in the absence or in the presence of OMFP no shift of the emission maximum is observed in the spectra and therefore, the data were analysed according to the Stern-Volmer equation for 3 (), 4 () and 4a (). In the absence of OMFP, low values of KSV were obtained (0.019 µM−1, 0.008 µM−1 and 0.011 µM−1 for 3, 4 and 4a, respectively), similar to those measured with the wild-type CDC25B. This finding confirms that also the C473S mutant enzyme has a very weak interaction with these uncompetitive inhibitors. On the other hand, the slope of the straight lines substantially rises in the presence of OMFP and the measured values of KSV increase to 0.042 µM−1, 0.023 µM−1 and 0.031 µM−1 for 3, 4 and 4a, respectively. The corresponding values of K′D (24 µM, 43 µM and 32 µM for 3, 4 and 4a, respectively) indicate that OMFP strengthens the weak interaction of the enzyme with these uncompetitive inhibitors. Besides this relevant role of the substrate, the K′D values of the uncompetitive inhibitors remain greater than those obtained for noncompetitive inhibitors, a finding probably reflecting the lower inhibition power exhibited by uncompetitive respect to noncompetitive inhibitors.
Figure 5. Effect of some inhibitors on the intrinsic fluorescence of recombinant CDC25B-C473S in the absence or in the presence of OMFP. The data of fluorescence emission at 357 nm used for drawing the Stern–Volmer plots were obtained from the fluorescence spectra reported in Figure S2, using the same protocol described in the legend to . The F0/FI ratios were calculated in the presence of the indicated concentrations of 3 (a), 4 (b), 4a (c) or 7j (d) either in the absence (open circles) or in the presence of 5 µM OMFP (filled circles).
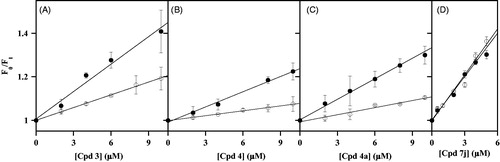
The effects on the intrinsic fluorescence of CDC25B-C473S in the absence or in the presence of 5 µM OMFP were probed even for a noncompetitive inhibitor, such as 7j (Supplementary Figure 2). In this case, the dose-dependent quenching of the intrinsic fluorescence of CDC25B-C473S due to the inhibitor is evident without or with OMFP. Indeed, the straight lines of the corresponding Stern-Volmer plots obtained either in the absence or in the presence of OMFP are almost overlapping (). Therefore, these data confirm that the direct interaction between enzyme and inhibitor 7j occurs in the absence of the substrate and it is not affected when the substrate binding pocket is occupied.
These overall effects on the intrinsic fluorescence of wild-type/mutant CDC25B caused by some NPA derivatives, acting as inhibitors of its phosphatase activity, reinforce the categorisation of these compounds in two groups according to a different inhibition mechanism. Indeed, 7j, 7i and 6e directly interact with CDC25B, being capable to form the enzyme•inhibitor binary complex in the absence of the substrate; however, the formation of this complex is not affected when OMFP is bound to the enzyme, as shown for 7j. Therefore, 7j, 7i and 6e are endowed with an inhibition mechanism ranked as noncompetitive. On the other hand, for other inhibitors, such as 3, 4 and 4a, the presence of the substrate OMFP is required to strengthen an otherwise weak direct interaction between enzyme and inhibitor. In other words, 3, 4 and 4a may form a ternary complex, enzyme•OMFP•inhibitor, because the binding of the substrate is needed to permit a stable enzyme inhibitor interaction; therefore, these compounds approach the mechanism of inhibition ranked as uncompetitive.
The possible relationship between binding interaction and inhibition power of the selected NPA noncompetitive and uncompetitive inhibitors of CDC25B has been evaluated (). The parameters used for the comparison are the K′D values obtained from fluorescence studies reported in this work and the corresponding Ki previously obtained in kinetic studies of CDC25B phosphatase inhibitionCitation18. The binary complex formed by CDC25B with the typical noncompetitive inhibitors 7j, 7i or 6e, has a consistently greater K′D compared to Ki. Besides this difference, possibly due to the different experimental conditions used for measuring K′D or Ki, it is important to note that both parameters increase in the same order (7j < 7i < 6e), as confirmed by the K′D/Ki ratio of 9.7, 10.4 and 10.6 for 7j, 7i and 6e, respectively. Therefore, the decreased inhibition power of 7i or 6e compared to 7j probably reflects their lower binding interaction with CDC25B. Moving to the uncompetitive inhibitors 3, 4 and 4a, the K′D values considered for the comparison are those obtained for the complex formed by CDC25B-C473S in the presence of the substrate OMFP. Also in this case the K′D are consistently greater than the corresponding Ki values, as also emerging from the K′D/Ki ratio of 8.6, 5.9 and 3.8 for 3, 4 and 4a, respectively. However, in spite of the different values of the ratio, the significantly weaker inhibition power of 4 and 4a with respect to 3 may be explained with their lower binding interaction with the enzyme. All these data suggest that the different inhibition power and mechanism exhibited by the NPA derivatives of NSC28620 may be explained by a modulation of their direct or substrate-mediated interaction with the enzyme, as a consequence of the structural changes operated on the lead compound.
Table 1. Binding interaction of selected NPA derivatives of NSC28620 towards CDC25B and CDC25B-C473S and relative inhibition mechanism
Our fluorescence studies represent a powerful tool to shed light on the inhibition mechanism exerted by small molecules on a target enzyme. Indeed, the combination of kinetic studies of CDC25B phosphatase inhibition by NPA derivatives and fluorimetric investigation on their binding interaction with the enzyme led to a detailed understanding of the inhibition mechanism of these small molecules based on a direct (noncompetitive) or substrate-mediated (uncompetitive) interaction with the target enzyme. Furthermore, the finding that three members of the same group of inhibitors keep a fluorimetric behaviour specific for the type of inhibition might point to the statistical relevance of this investigation, thus allowing an enlargement of the assignment (noncompetitive or uncompetitive inhibition) to the other NPA derivatives.
3.5. Pro-apoptotic effect exhibited by the NPA derivative 4a in melanoma cell lines
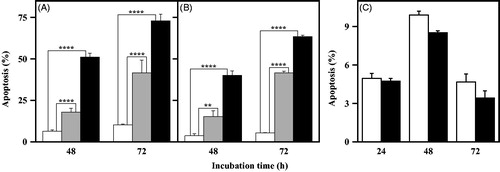
Once assessed the inhibition mechanism exerted by the NPA derivatives on purified CDC25B, we have made a deeper insight on their possible mechanism of action in a cellular context, such as melanoma, one of the most aggressive and therapy-resistant human cancers. Under this concern, the previous study on the biological effects exerted by all NPK and NPA derivatives in A2058 and A375 melanoma cell linesCitation18 revealed that only one of these compounds, 4a, exerted a toxic effect in melanoma cells, when added at a relatively low dose. In particular, this compound reduced the cell growth rate, provoked an arrest of cells in G2/M phase of cell cycle and reduced the protein levels of pCDK1. This behaviour could be indicative of a DNA damage induced by 4a. It is noted that the entry in each phase of cell cycle is strictly supervised by cell-cycle checkpoint systems that are responsible for the arrest of cell cycle, as a response to DNA damage. A block in G2/M phase prevents the entry into mitosis, thus allowing the onset of a number of processes devoted to repair the DNA damage. The activation of CDC25 phosphatases, in particular CDC25C, is crucial for the progression through G2/M checkpointCitation36. Hence, the inhibition of CDC25 can contribute to the arrest of cell cycle in G2/M phase; however, if the arrest is prolonged and the DNA damage is not repaired, cells can activate an apoptotic programme in order to avoid the transfer of DNA mutated to daughter cellsCitation37. Therefore, the possible activation of an apoptotic programme during treatment of melanoma cells with 4a was evaluated. To this aim, A2058 and A375 cells were treated with 5 or 10 µM 4a at different times and apoptosis was monitored cytofluorimetrically after PI incorporation (). A dose- and time-dependent increase of cells with a hypodiploid DNA content is evident in both A2058 () and A375 cells (). In particular, the increase of apoptotic cells, already significant after 48-h treatment in the presence of either 5 or 10 µM 4a, becomes more pronounced after 72-h treatment in both melanoma cells. The effect of 10 µM 4a was also tested in the nontumorigenic fibroblast cell line BJ-5ta. As shown in , 4a does not exert any apoptotic effect in these nonmalignant cells after 24-, 48- or 72-h treatment. Therefore, the toxic effect exerted by 4a in melanoma cells seems to be specific, because a nontumour cell line, such as BJ-5ta, is not responsive to this compound.
Figure 6. Apoptotic effect of 4a in A2058, A375 and BJ-5ta cell lines. A2058 (a), A375 (b) and BJ-5ta (c) cells were treated with 0.5% (v/v) DMSO (white bars), 5 μM 4a (grey bars) or 10 μM 4a (black bars), and apoptosis was evaluated after the indicated incubation time through the determination of the number of cells with a subdiploid DNA content. Data from triplicate experiments were expressed as a percentage and reported as the mean ± SE. **, p < 0.01; ****, p < 0.0001 compared to untreated cells.
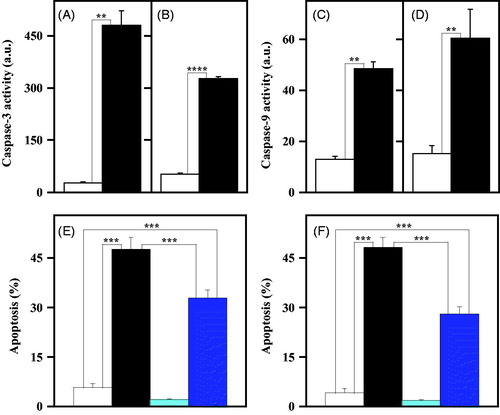
The pro-apoptotic potential of 4a in melanoma cells was further investigated by measuring the enzymatic activity of caspase-3 and -9, representing the final effector of apoptosis, and one of the main mediators of the intrinsic apoptotic programme, respectivelyCitation38. As shown in , the treatment of melanoma cells with 10 µM 4a induced a statistically significant increase of the enzymatic activity of caspase-3 () and caspase-9 (), an enhancement clearly evident for both A2058 () and A375 (). To verify whether the apoptosis induced by 4a in melanoma cells was caspase-mediated, the cytofluorimetric analysis of apoptosis was also conducted in the presence of an irreversible pan-caspase inhibitor, such as Z-VAD-FMK. Melanoma cell lines were treated for 48 h with 4a in the presence or in the absence of Z-VAD-FMK; a partial but significant reduction of the apoptosis level was observed in both A2058 () and A375 () cells upon exposure to the caspase inhibitor.
Figure 7. Involvement of caspase-3 and -9 in the apoptotic programme induced by 4a in melanoma cells. (a, b, c, d) Effect of 4a on the caspase-3 and caspase-9 activity in melanoma cells. A2058 (a, c) and A375 (b, d) cells were incubated for 24 h with 0.5% (v/v) DMSO (white bars) or 10 μM 4a (black bars). The enzymatic activity of caspase-3 (a, b) and caspase-9 (c, d) was reported as arbitrary units (a.u.). Data from triplicate experiments were reported as the mean ± SE. **, p < 0.01; ****, p < 0.0001 compared to untreated cells. (e, f) Effect of Z-VAD-FMK, a pan-caspase inhibitor, on the apoptosis induced by 4a in melanoma cells. A2058 (e) and A375 (f) cells were incubated for 48 h with 0.5% (v/v) DMSO (white bars), 10 μM 4a (black bars), 100 µM Z-VAD-FMK (cyan bars) or 10 μM 4a plus 100 µM Z-VAD-FMK (blue bars). The apoptosis was evaluated through the determination of the number of cells with a subdiploid DNA content. Data from triplicate experiments were expressed as a percentage and reported as the mean ± SE. ***, p < 0.001 compared to respective control cells.
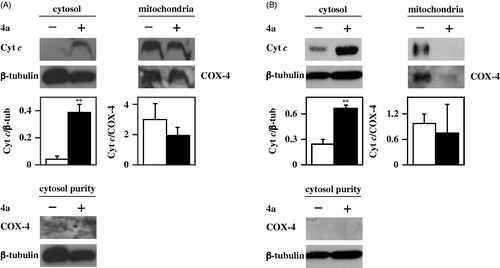
The increase of caspase-9 activity suggests that the apoptotic programme induced by 4a in melanoma cells could be mitochondria-mediated. It is noted that cytochrome c, a small protein normally localised in the mitochondria, moves into the cytosol upon some death stimuli, thus leading to the activation of caspase-9Citation39. Therefore, an investigation on the cytosolic translocation of cytochrome c, the main regulator of the intrinsic apoptotic pathway, was carried out through immunofluorescence and Western blotting experiments. In particular, A2058 and A375 cells, untreated or treated with 10 µM 4a, were subjected to immunofluorescence labelling with an anti-cytochrome c antibody (). In untreated cells, cytochrome c (green signal) is essentially localised in the mitochondria (red signal), as confirmed by the yellow merged signal. On the other hand, treatment with 4a induces a cytosolic translocation of cytochrome c, as clearly indicated by the appearance of green fluorescence in the cytosol. These results were confirmed by Western blotting experiments using fractioned protein extracts (cytosol and mitochondria) of melanoma cells incubated with 4a. Indeed, this compound induces a significant cytosolic translocation of cytochrome c in both A2058 () and A375 () cells. All these data indicate that the cell cycle arrest in G2/M provoked by 4a in melanoma cells results in the activation of an apoptotic programme, mainly mitochondria- and caspase-mediated.
Figure 8. Immunofluorescence analysis of cytochrome c subcellular localisation in melanoma cells. A2058 and A375 cells were untreated (0.5% v/v, DMSO) or treated with 10 μM 4a for 24 h. The cell nuclei were labelled with DAPI (blue channel); the cytochrome c immunofluorescent staining (green channel) was performed using a polyclonal anti-Cyt c antibody, followed by FITC-conjugated antibody; mitochondria were stained with MitoTracker Red (red channel). The degree of spatial overlap in cytochrome c immunostaining and MitoTracker Red staining is shown by yellow fluorescence, corresponding to merge of red and green channel. Scale bar, 10 µm; magnification × 40.
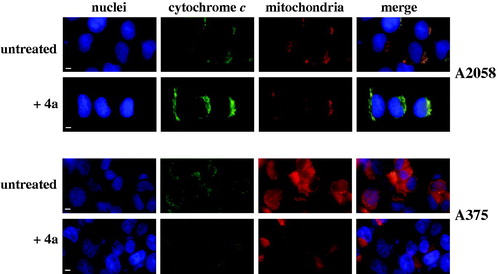
Figure 9. Effect of 4a on cytochrome c subcellular localisation in melanoma cells. A2058 (a) and A375 (b) cells were incubated for 24 h with 0.5% (v/v) DMSO (white bars) or 10 μM 4a (black bars), and then the cytosolic and mitochondrial protein extracts were prepared for Western blotting analysis, using β-tubulin or COX-4 as loading controls of the cytosolic or mitochondrial fraction, respectively. Purity of the cytosolic fraction was monitored by using β-tubulin or COX-4 as specific cytosolic or mitochondrial marker, respectively. The densitometric evaluation of three independent experiments was reported as the mean ± SE. **, p < 0.01 compared to untreated cells.
3.6. Effect of 4a on typical markers of cell cycle progression, apoptosis and proliferation
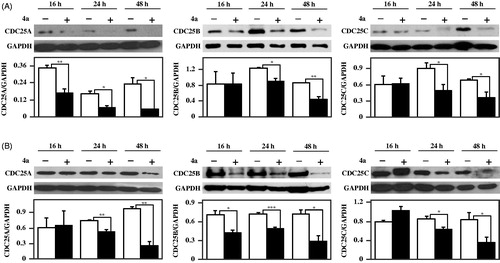
The response of melanoma cells to 4a prompted an investigation on how this inhibitor affects the levels of typical protein markers of cell cycle progression, apoptosis and proliferation. In a previous work we have reported that 4a arrested the cell cycle of melanoma cells in G2/M phase, and provokes an increase of protein levels of pCDK1, the inactive form of CDK1Citation18. It is known that the activation of CDK1 through the dephosphorylation of its Tyr15 catalysed by CDC25 promotes the cell entry into mitosis; therefore, the inhibition of CDC25, retaining CDK1 in an inactive state, impedes the cell cycle progression and can contribute to cell death. Furthermore, CDC25 exerts an anti-apoptotic role, by suppressing some apoptotic pathways either directly or indirectly. Indeed, CDC25 inhibits Apoptosis Signal-regulating Kinase 1 (ASK1) through dephosphorylation of Thr838 or inhibits apoptosis through activation of CDK1, that in turn phosphorylates and inactivates caspase-9Citation40–42. Hence, the effects induced by 4a in melanoma cells could be related to its inhibitory capacity towards CDC25 activity also in a cellular system. To this aim, we have also evaluated the protein levels of CDC25A, –B and –C during treatment of melanoma cells with 4a. As shown in , 4a provokes a reduction of protein levels of all three forms of CDC25 enzymes in both A2058 () and A375 () melanoma cells, essentially after 24- and 48-h of incubation. Hence, we can infer that the inhibition of CDC25 enzymatic activity and the reduction of CDC25 protein levels concur to mediate the toxic effect induced by 4a in melanoma cells.
Figure 10. Effect of 4a on CDC25A, -B and -C protein levels in melanoma cells. A2058 (a) and A375 (b) cells were incubated with 0.5% (v/v) DMSO (white bars) or 10 μM 4a (black bars) for the indicated incubation time. Western blotting analysis was performed on total cellular extracts, using GAPDH as loading control. The densitometric evaluation of three independent experiments was reported as the mean ± SE. *, p < 0.05; **, p < 0.01; ***, p < 0.001 compared to untreated cells.
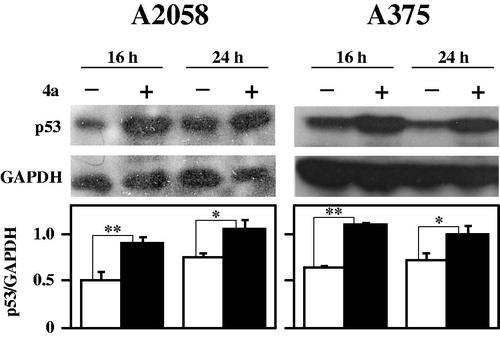
The integrity of cell genome is under a strict control by a number of proteins devoted to cell cycle regulation and apoptosis. Among them, p53, named the “genome guardian”, acts as tumour suppressor protein, performing a pivotal role in this control. This protein, mediating the activation of key mechanisms involved in the eradication of damaged cells, exerts a fundamental role in the processes of neoplastic transformationCitation43,Citation44. In addition, p53 is required for a good response to many forms of tumour therapies and thus is an appealing target for anticancer drug studiesCitation45. As shown in , a clear and significant increase of p53 is evident in A2058 and A375 melanoma cells after 16- and 24-h treatment with 4a. This finding is in agreement with the negative role exerted by p53 in the gene expression of both CDC25B and –CCitation46,Citation47 and with the previous described results on CDC25 down-regulation.
Figure 11. Effect of 4a on p53 protein levels in melanoma cells. A2058 and A375 cells were incubated with 0.5% (v/v) DMSO (white bars) or 10 μM 4a (black bars) for the indicated incubation time. Western blotting analysis was performed on total cellular extracts, using GAPDH as loading control. The densitometric evaluation of three independent experiments was reported as the mean ± SE. *, p < 0.05; **, p < 0.01 compared to untreated cells.
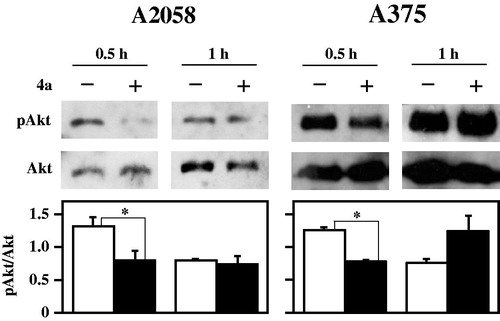
A high percentage of melanomas harbours a mutation in BRAF, a gene encoding a member of the mitogen-activated protein kinase (MAPK) signalling pathway, that modulates cell growth, proliferation and survivalCitation48,Citation49. Treatment of melanoma patients with B-Raf inhibitors, such as vemurafenib, is characterised by an initial phase where a strong reduction of tumour is obtained; unfortunately, within a few months, many patients loose the durable response to B-Raf inhibitors because of the occurrence of drug resistanceCitation50–52. This problem can be due to a compensatory activation of other cell surviving pathways, bypassing the anti-proliferative effects of B-Raf inhibitorsCitation53. Indeed, the phosphatidylinositol 3-kinase/protein kinase B (PI3K/AKT) pathway is frequently activated in primary melanomasCitation52 and the use of B-Raf inhibitors paradoxically activates the AKT signalling pathway, that promotes the tumour survival of BRAF-mutant melanoma cellsCitation54,Citation55,. Furthermore, in tumour cells, the UV exposure can activate the PI3K/AKT‐dependent mechanism that stabilises CDC25A and induces its translocation into the cytoplasm, where it does not affect the cell cycle progression, but acts as anti-apoptotic factorCitation56. All these observations prompted an evaluation on the pAkt protein levels during treatment of melanoma cells with 4a. Data in show a significant and early decrease of pAkt after 30-min treatment with 4a. This finding is very interesting, because the combined usage of 4a and conventional B-Raf inhibitors could contribute to reduce the development of drug resistance in melanomas. Under this concern, the reduction of pAkt protein levels is evident in the primary melanoma cell line A375, which is sensitive to vemurafenib, as well as in the metastatic and vemurafenib-resistant cell line A2058.
Figure 12. Effect of 4a on pAkt protein levels in melanoma cells. A2058 and A375 cells were incubated with 0.5% (v/v) DMSO (white bars) or 10 μM 4a (black bars) for the indicated incubation time. Western blotting analysis was performed on total cellular extracts, using Akt as loading control. The densitometric evaluation of three independent experiments was reported as the mean ± SE. *, p < 0.05 compared to untreated cells.
In the complex, this molecular analysis on the effects of 4a in melanoma cells suggests that the toxic effect of this compound might involve both the inhibition of the CDC25 activity/protein levels and the modulation of pivotal cellular surviving pathways.
4. Conclusions
Among CDC25 inhibitors, compounds with the NPA scaffold are particularly attracting for the design of molecules endowed with potential anticancer properties, because their nonquinonoid structure reduces the unspecific side toxic effects usually observed with the most known quinonoid CDC25 inhibitors. Hence, the detailed biochemical characterisation of the inhibition mechanism possessed by NPA derivatives described in this work and the molecular processes involved in the biological effects observed with a highly cytotoxic member of these molecules improve the basic knowledge on CDC25 inhibitors and represent the starting point for the discovery and production of more potent bioactive molecules. Indeed, the drug discovery studies are mainly focussed on the obtainment of molecules characterised by a high specificity against selected cancer cells, minimum undesired side toxic effects and reduced appearance of drug resistance. Under this concern, the specific responsiveness of melanoma cells, a highly resistant cancer type, to the bioactive compound 4a is particularly interesting, because this molecule affects alternative survival pathways responsible for the acquirement of drug resistance usually observed during the therapeutic treatment of melanoma with conventional agents. These observations could allow the development of anticancer strategies based on the cotreatment of melanoma with different drugs cotargeting independent survival pathways or the combination of multitargeted therapy and immunotherapy.
Supplemental Material
Download PDF (634.5 KB)Acknowledgement
Compounds 3, 4, 4a, 6e, 7i and 7j were kindly provided by the group of Dr. Stefania Villa, University of Milan, Italy.
Disclosure statement
The authors declare no competing financial interest.
Correction Statement
This article has been republished with minor changes. These changes do not impact the academic content of the article.
Additional information
Funding
References
- Diaz-Moralli S, Tarrado-Castellarnau M, Miranda A, Cascante M. Targeting cell cycle regulation in cancer therapy. Pharmacol Ther 2013;138:255–71.
- Manchado E, Guillamot M, Malumbres M. Killing cells by targeting mitosis. Cell Death Differ 2012;19:369–77.
- Malumbres M, Barbacid M. Mammalian cyclin-dependent kinases. Trends Biochem Sci 2005;30:630–41.
- Nilsson I, Hoffmann I. Cell cycle regulation by the Cdc25 phosphatase family. Prog Cell Cycle Res 2000;4:107–14.
- Aressy B, Ducommun B. Cell cycle control by the CDC25 phosphatases. Anticancer Agents Med Chem 2008;8:818–24.
- Boudolf V, Inze D, De Veylder L. What if higher plants lack a CDC25 phosphatase? Trends Plant Sci 2006;11:474–9.
- Mailand N, Podtelejnikov AV, Groth A, et al. Regulation of G(2)/M events by Cdc25A through phosphorylation-dependent modulation of its stability. EMBO J 2002;21:5911–20.
- Sur S, Agrawal DK. Phosphatases and kinases regulating CDC25 activity in the cell cycle: clinical implications of CDC25 overexpression and potential treatment strategies. Mol Cell Biochem 2016;416:33–46.
- Crncec A, Hochegger H. Triggering mitosis. FEBS Lett 2019;593:2868–88.
- Lee G, White LS, Hurov KE, et al. Response of small intestinal epithelial cells to acute disruption of cell division through CDC25 deletion. Proc Natl Acad Sci USA 2009;106:4701–6.
- Kristjánsdóttir K, Rudolph J. Cdc25 phosphatases and cancer. Chem Biol 2004;11:1043–51.
- Al-Matouq J, Holmes TR, Hansen LA. CDC25B and CDC25C overexpression in nonmelanoma skin cancer suppresses cell death. Mol Carcinog 2019;58:1691–700.
- Tang L, Li G, Tron VA, et al. Expression of cell cycle regulators in human cutaneous malignant melanoma. Melanoma Res 1999;9:148–54.
- Cerchia C, Lavecchia A. Small molecule drugs and targeted therapy for melanoma: current strategies and future directions. Curr Med Chem 2017;24:2312–44.
- Brezak MC, Valette A, Quaranta M, et al. IRC-083864, a novel bis quinone inhibitor of CDC25 phosphatases active against human cancer cells. Int J Cancer 2009;124:1449–56.
- Lavecchia A, Di Giovanni C, Pesapane A, et al. Discovery of new inhibitors of Cdc25b dual specificity phosphatases by structure-based virtual screening. J Med Chem 2012;55:4142–58.
- Capasso A, Cerchia C, Di Giovanni C, et al. Ligand-based chemoinformatic discovery of a novel small molecule inhibitor targeting Cdc25 dual specificity phosphatases and displaying in vitro efficacy against melanoma cells. Oncotarget 2015;6:40202–22.
- Cerchia C, Nasso R, Mori M, et al. Discovery of novel naphthylphenylketone and naphthylphenylamine derivatives as cell division cycle 25B (CDC25B) phosphatase inhibitors: design, synthesis, inhibition mechanism, and in vitro efficacy against melanoma cell lines. J Med Chem 2019;62:7089–110.
- Brezak MC, Quaranta M, Contour-Galcera MO, et al. Inhibition of human tumor cell growth in vivo by an orally bioavailable inhibitor of CDC25 phosphatases. Mol Cancer Ther 2005;4:1378–87.
- Brezak MC, Quaranta M, Mondesert O, et al. A novel synthetic inhibitor of CDC25 phosphatases: BN82002. Cancer Res 2004;64:3320–5.
- Brenner AK, Reikvam H, Lavecchia A, Bruserud O. Therapeutic targeting the cell division cycle 25 (CDC25) phosphatases in human acute myeloid leukemia - The possibility to target several kinases through inhibition of the various CDC25 isoforms. Molecules 2014;19:18414–47.
- Contour-Galcera MO, Lavergne O, Brezak MC, et al. Synthesis of small molecule CDC25 phosphatases inhibitors. Bioorg Med Chem Lett 2004;14:5809–12.
- Lavecchia A, Coluccia A, Di Giovanni C, Novellino E. Cdc25B phosphatase inhibitors in cancer therapy: latest developments, trends and medicinal chemistry perspective. Anticancer Agents Med Chem 2008;8:843–56.
- Lavecchia A, Di Giovanni C, Novellino E. Inhibitors of Cdc25 phosphatases as anticancer agents: a patent review. Expert Opin Ther Patents 2010;20:405–25.
- Lavecchia A, Di Giovanni C, Novellino E. CDC25 phosphatase inhibitors: an update. Mini Rev Med Chem 2012;12:62–73.
- Lavecchia A, Cosconati S, Limongelli V, Novellino E. Modeling of Cdc25B dual specificity protein phosphatase inhibitors: docking of ligands and enzymatic inhibition mechanism. Chem Med Chem 2006;1:540–50.
- He R, Zeng LF, He Y, et al. Small molecule tools for functional interrogation of protein tyrosine phosphatases. FEBS J 2013;280:731–50.
- Huber-Villaume S, Revelant G, Sibille E, et al. 2-(Thienothiazolylimino)-1,3-thiazolidin-4-ones inhibit cell division cycle 25 A phosphatase. Bioorg Med Chem 2016;24:2920–8.
- Bana E, Sibille E, Valente S, et al. A novel coumarin-quinone derivative SV37 inhibits CDC25 phosphatases, impairs proliferation, and induces cell death. Mol Carcinog 2015;54:229–41.
- Albano F, Arcucci A, Granato G, et al. Markers of mitochondrial dysfunction during the diclofenac-induced apoptosis in melanoma cell lines. Biochimie 2013;95:934–45.
- Gelzo M, Granato G, Albano F, et al. Evaluation of cytotoxic effects of 7-dehydrocholesterol on melanoma cells. Free Radic Biol Med 2014;70:129–40.
- Bradford MM. A rapid and sensitive method for the quantitation of microgram quantities of protein utilizing the principle of protein-dye binding. Anal Biochem 1976;72:248–54.
- Arcucci A, Ruocco MR, Albano F, et al. Analysis of extracellular superoxide dismutase and Akt in ascending aortic aneurysm with tricuspid or bicuspid aortic valve. Eur J Histochem 2014;58:2383.
- Arcucci A, Ruocco MR, Amatruda N, et al. Analysis of extracellular superoxide dismutase in fibroblasts from patients with systemic sclerosis. J Biol Regul Homeost Agents 2011;25:647–54.
- Rudolph J. Cdc25 phosphatases: structure, specificity, and mechanism. Biochemistry 2007;46:3595–604.
- DiPaola RS. To arrest or not to G(2)-M Cell-cycle arrest (Commentary re: Tyagi AK et al. Silibinin strongly synergizes human prostate carcinoma DU145 cells to doxorubicin-induced growth inhibition, G(2)-M arrest, and apoptosis Clin Cancer Res 2002;8:3512–9). Clin Cancer Res 2002;8:3311–4.
- Campisi J, d'Adda di Fagagna F. Cellular senescence: when bad things happen to good cells. Nat Rev Mol Cell Biol 2007;8:729–40.
- Degterev A, Boyce M, Yuan J. A decade of caspases. Oncogene 2003;22:8543–67.
- Wolter KG, Hsu YT, Smith CL, et al. Movement of Bax from the cytosol to mitochondria during apoptosis. J Cell Biol 1997;139:1281–92.
- Morgan DO. Principles of CDK regulation. Nature 1995;374:131–4.
- Yamaura M, Mitsushita J, Furuta S, et al. NADPH oxidase 4 contributes to transformation phenotype of melanoma cells by regulating G2-M cell cycle progression. Cancer Res 2009;69:2647–54.
- Zacksenhaus E, Liu JC, Granieri L, et al. CDC25 as a common therapeutic target for triple-negative breast cancer - the challenges ahead . Mol Cell Oncol 2018;5:e1481814.
- Ryan KM. p53 and autophagy in cancer: guardian of the genome meets guardian of the proteome. Eur J Cancer 2011;47:44–50.
- Agrawal SN, Dhruv K, Meshram S. p53: the guardian of genome, apoptosis, and its role in carcinogenesis. Eur J Biomed Pharm Sci 2017;4:161–6.
- Wang Z, Sun Y. Targeting p53 for novel anticancer therapy. Transl Oncol 2010;3:1–12.
- Dalvai M, Mondesert O, Bourdon JC, et al. Cdc25B is negatively regulated by p53 through Sp1 and NF-Y transcription factors. Oncogene 2011;30:2282–8.
- St Clair S, Giono L, Varmeh-Ziaie S, et al. DNA damage-induced downregulation of Cdc25C is mediated by p53 via two independent mechanisms: one involves direct binding to the cdc25C promoter. Mol Cell 2004;16:725–36.
- Ihle MA, Fassunke J, Konig K, et al. Comparison of high resolution melting analysis, pyrosequencing, next generation sequencing and immunohistochemistry to conventional Sanger sequencing for the detection of p.V600E and non-p.V600E BRAF mutations. BMC Cancer 2014;14:13.
- Colombino M, Capone M, Lissia A, et al. BRAF/NRAS mutation frequencies among primary tumors and metastases in patients with melanoma. J Clin Oncol 2012;30:2522–9.
- Sullivan RJ, Flaherty KT. Resistance to BRAF-targeted therapy in melanoma. Eur J Cancer 2013;49:1297–304.
- Ascierto PA, McArthur GA, Dréno B, et al. Cobimetinib combined with vemurafenib in advanced BRAF (V600)-mutant melanoma (coBRIM): updated efficacy results from a randomised, double-blind, phase 3 trial. Lancet Oncol 2016;17:1248–60.
- Ruocco MR, Avagliano A, Granato G, et al. Metabolic flexibility in melanoma: a potential therapeutic target. Semin Cancer Biol 2019;59:187–207.
- Acquaviva J, Smith DL, Jimenez JP, et al. Overcoming acquired BRAF inhibitor resistance in melanoma via targeted inhibition of Hsp90 with ganetespib. Mol Cancer Ther 2014;13:353–63.
- Gopal YN, Deng W, Woodman SE, et al. Basal and treatment-induced activation of AKT mediates resistance to cell death by AZD6244 (ARRY-142886) in Braf-mutant human cutaneous melanoma cells. Cancer Res 2010;70:8736–47.
- Perna D, Karreth FA, Rust AG, et al. BRAF inhibitor resistance mediated by the AKT pathway in an oncogenic BRAF mouse melanoma model. Proc Natl Acad Sci USA 2015;112:E536–45.
- Holmes TR, Dindu S, Hansen LA. Aberrant localization of signaling proteins in skin cancer: implications for treatment. Mol Carcinog 2019;58:1631–9.