
 ?Mathematical formulae have been encoded as MathML and are displayed in this HTML version using MathJax in order to improve their display. Uncheck the box to turn MathJax off. This feature requires Javascript. Click on a formula to zoom.
Abstract
In this paper, the efficiency of the carbonic anhydrase (CA) enzyme in accelerating the hydration of CO2 is evaluated using a measurement system which consists of a vessel in which a gaseous flow of mixtures of nitrogen and CO2 is bubbled into water or water solutions containing a known quantity of CA enzyme. The pH value of the solution and the CO2 concentration at the measurement system gas exhaust are continuously monitored. The measured CO2 level allows for assessing the quantity of CO2, which, subtracted from the gaseous phase, is dissolved into the liquid phase and/or hydrated to bicarbonate. The measurement procedure consists of inducing a transient and observing and modelling the different kinetics involved in the steady-state recovery with and without CA. The main contribution of this work is exploiting dynamical system theory and chemical kinetics modelling for interpreting measurement results for characterising the activity of CA enzymes. The data for model fitting are obtained from a standard bioreactor, in principle equal to standard two-phase bioreactors described in the literature, in which two different techniques can be used to move the process itself away from the steady-state, inducing transients.
1. Introduction
The characterisation of complex dynamical phenomena requires sophisticated and advanced measurement procedures and systems. This is especially true for chemical/biochemical processes (see, e.g.Citation1–6) where many different influence quantities may play a role in the measurement outcomes. In this context, it is of the utmost importance modelling the dynamics to plan, design, or optimise measurements. An efficient modelling allows us to understand the influence quantities, retrieve the meaningful parameters, overcome some limitations of the measurement system, and unravel the most important features of the phenomenon of interest.
In this paper, the problem of proving and measuring the efficiency of carbonic anhydrase (CA) enzymes in accelerating the rate of CO2 hydration is dealt with an ad hoc measurement system, based on the reaction kinetics real-time monitoring and the use of a dynamic model of the involved chemical reactionsCitation7,Citation8.
CAs catalyse the physiologically crucial reversible reaction of the carbon dioxide (CO2) hydration to bicarbonate (HCO3−) and protons (H+) according to the following chemical reactionCitation9,Citation10: CO2 + H2O ⇋ HCO3− + H+. In the last years, CA has been considered one of the most promising biocatalysts for CO2 sequestration technology to counteract the accumulation of CO2 gas in the atmosphereCitation11, which is the leading cause of global climate changes. CA enzyme-based techniques exploit highly efficient biological CO2 mechanisms, which are naturally occurring in living organisms and are involved in many physiological CO2 reactions such as respiration in mammalian cells or photosynthesis in plant cells. The adoption of a CO2-catalyzing enzyme allows the development of an efficient and eco-friendly ‘bio-mimic’ CO2 capture system of potential interest in various applications in the framework of environmental control. Recently, Capasso et al. focussed their scientific attention on the presence of α-CAs in thermophilic microorganisms, such as Sulfurihydrogenibium yellowstonense and Sulfurihydrogenibium azorenseCitation12,Citation13. The study of the biochemical and physical properties of the ‘extreme’ bacterial CAs has led to the discovery of molecular features, which make them different from those of the mesophilic counterpart allowing their use in biotechnological fields generally characterised by conditions deleterious for the enzyme activityCitation12,Citation13. Moreover, the X-ray tridimensional structures of the two ‘extremo-CAs’ indicated with the acronyms SspCA and SazCA provided the rationale at molecular level for their thermostability.
Recently, it has been realised a three-phase bioreactor (gas, liquid, and solid), which was filled with the recombinant SspCA immobilised on polyurethane (PU)Citation14. The results obtained using the lab-scale bioreactor showed that the immobilised PU-SspCA is capable of converting CO2 from a gas mixture, whose initial concentration was 20%. Russo et al., using the SspCA covalently immobilised on paramagnetic Fe3O4 nanoparticles via carbodiimide activation of the enzyme and the protocol based on CO2 absorption experiment in a stirred cell apparatus, determined the kinetics of the immobilised SspCA for the CO2 hydration reactionCitation15. Abdelrahim et al.Citation16 provided an innovative concept for the removal of CO2 from flue gas streams, using biomimetic SILMs (Supported Ionic Liquid Membranes) containing SspCA that enhances the selective transport of CO2.
As described in the literature, there are some disadvantages using the free enzyme in solution because the repeatable usage of the biocatalyst is limited, and generally it is not possible to recover the catalyst from the reaction mixture. Fortunately, these disadvantages can be eliminated immobilising the enzyme on specific supportsCitation17 even if it may discourage the extensive utilisation of enzymes in industrial applications because of the high costs connected to the biocatalyst production and purification, and the expenses for the preparation of the immobilisation support. This limitation can be easily overcome by the in vivo immobilisation, which consists in the overexpression of protein directly onto the surface of bacterial hostsCitation11.
In this paper, which follows the work presented inCitation18, both the thermostable CA (SspCA) immobilised on the external surface of Escherichia coli cellsCitation11, and the commercial CA from bovine erythrocytes (Sigma-Aldrich C-3934), were used to explore the enzymatic CO2 conversion into bicarbonate. The CAs efficiency in accelerating the hydration of CO2 is assessed using a measurement system, consisting of a vessel in which a constant gaseous flow of a mixture of air and CO2 is bubbled into a water solution containing a known quantity of the SspCA. The pH value is continuously controlled by a pH probe, whereas an IR based sensor controls the CO2 concentration at the gas exhaust of the system. The measured CO2 concentration allows for assessing the quantity of CO2, which is subtracted from the gaseous phase, dissolved into the liquid phase and/or hydrated. The measurement procedure consists of inducing a transient, exploiting a buffer solution or changing the input CO2 concentration, and observing the different kinetics involved in the recovery of the steady-state with and without CA.
2. Materials and methods
2.1. Measurement system
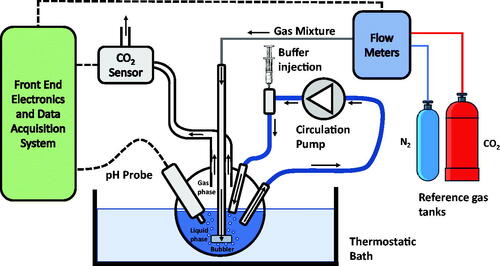
The measurement system, whose complete setup is shown in , is based on the reactor shown in . In the vessel, which is hosted in a thermostatic bath containing 100 ml of pure water or pure water and a known quantity of carbonic anhydrase enzyme, a constant and controlled flow (200 ml/min) of a mixture of synthetic air and CO2 is continuously injected. The flow is set by a digitally controlled gas flow meter (BronkHorst F-201C). A peristaltic pump is used to circulate the fluid phase with a flow of 100 ml/min. The vessel exhaust embeds a non-dispersive infra-red (NDIR) CO2 sensor, the IRCA1 from Alphasense, with a declared accuracy of about 2500 ppm. This sensorCitation19 is composed of a lamp and two infra-red pyroelectric detectors. The light emitted from the lamp has a spectrum that includes the CO2 absorption peak in the infra-red domain. The lamp must be externally driven by a signal that periodically turns on and off the light to avoid sensor overheating. The same light passes through the gas sample and a reference channel. The two detector signals, one per channel, are acquired and, taking the difference between the two signals, the absorbance due to CO2 is calculated. The CO2 concentration can be obtained from the absorbance according to the Beer-Lambert law.
Figure 1. Measurement system setup.
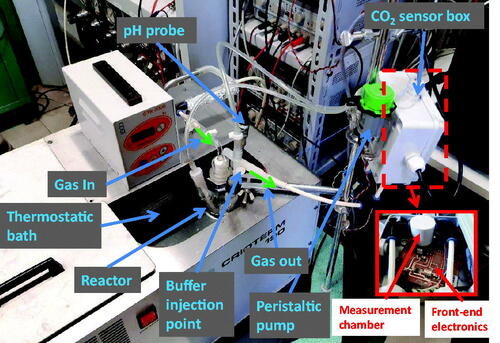
Figure 2. Reactor.
An electrochemical pH probe (Jumo 201005) is immersed in the water solution. The output voltage of the probe is read using a 6½ digital multimeter (Keysight Technologies AG34410A), whereas the NDIR sensor output is acquired with an ad hoc designed front end electronics and a National Instruments 16 bits DAQ board (NI PCI6259). The gas sensor NDIR lamp is operated with a 2 Hz square-wave signal obtained from an arbitrary waveform generator (Keysight Technologies AWG33220A). The whole system is managed by a PC using a LabView Virtual Instrument. Both the pH and the CO2 signals are acquired with a sampling time of 0.5 s. An additional aperture of the vessel allows for injecting a buffer solution (tris-hydroxymethyl-aminomethane, 10 mM, pH 8.3 @ T = 25 °C).
2.2. Chemical system dynamical model
The relevant reactions occurring in the reactor are reported in the followingCitation20–25:
(1)
(1)
(2)
(2)
(3)
(3)
where kfi and kbi [1/s] are the rate constants of the direct and reverse reactions, i = 0–2.
The first reaction is the solution of gaseous CO2 in water, which forms aqueous CO2 (1). The second is the reaction of aqueous CO2 with water to form carbonic acid (2). In the next step (reaction 3), carbonic acid dissociates to ions.
In the general case, the kinetics of these three reactions can be used to derive the dynamical model of the solution of carbon dioxide in water, and to simulate the behaviour of the dissolved CO2 concentration, [CO2].
(4)
(4)
(5)
(5)
(6)
(6)
In all these equations, [X] is the concentration of the species X. is the rate of aqueous CO2 dissolving in water from the gaseous phase, and [CO2]* is the saturation value of the overall concentration of aqueous CO2 concentration, due to Henry’s law. [CO2]* depends on temperature, pressure and on the concentration of gaseous CO2. In (2) and (3) a first order kinetics was assumed on the basis of the experimental observations, which are supported by the satisfactory behaviour of the developed model.
The model described by EquationEquations (4)–(6) can be simplified according to the following considerations and assumptions. The reaction rate constants kf1 and kb1 magnitude order is 10−2 s−1 and 100 s−1, respectively, whereas kf2 and kb2 results in general much largerCitation20,Citation21. Therefore, the first two reactions, EquationEquations (4)(4)
(4) and Equation(5)
(5)
(5) , are the rate limiting steps, and the kinetics of these two reactions can be used to derive the dynamical model of the solution of carbon dioxide in water, and to simulate the behaviour of the dissolved CO2 concentration, [CO2]. This is the assumption commonly made in literatureCitation20.
In detail, since reaction (3) is very fast with respect to reactions (1) and (2), it is assumed to reach the equilibrium instantaneously, so that:
(7)
(7)
where
is the equilibrium constant of EquationEquation (3)
(3)
(3) . Note that the pH value can be evaluated from the concentration
, considering:
(8)
(8)
Therefore, a system of two first order linear equations can be used to describe the concentration of aqueous CO2:
(9)
(9)
In the presence of the carbonic anhydrase enzyme, the mechanism of hydration of CO2 changes completely, and reactions (2) and (3) are replaced by a different reaction routeCitation21:
(10)
(10)
where EZn indicates the carbonic anhydrase enzyme.
The kinetics of the overall reaction can be modelled by a differential equation system with the same form as in (4)–(6), but with different reaction rate constants.
To relate the measured CO2 gas concentration to the dissolved CO2 concentration, the following considerations are made. The gas CO2 is bubbled into the water solution, a part of the CO2 is solved, and the remaining part, by the bubbles, flows out. Defining φΙΝ as the CO2 gas flow (which is a known quantity), bubbled in the water (injected into the system), as the CO2 flow that is solved into the liquid phase and which becomes aqueous, and
the fraction of the CO2 flow that remains gaseous, we have:
(11)
(11)
where Vol represents the volume of water.
Therefore:
(12)
(12)
Finally, the output flow of CO2, , is proportional to the measured concentration [CO2]gasOUT, that can be written as follows:
(13)
(13)
where
is the concentration of CO2 in the injected flow.
In the next section it will be shown with specific tests that even if the complete model is in principle more effective and accurate in describing the kinetics of the CO2 exchange between the two phases, in general the simplified model is accurate enough to describe the dynamic behaviour of the system.
2.3. Measurement procedure
The measurement procedure is based on the monitoring of , i.e., the concentration of carbon dioxide in the output flow, and of the pH value of the liquid phase during a transient in the presence of different quantities of CA enzyme. The reason behind this approach is that the transient response behaviour can give information about the rate constants of the reactions described in the previous section, and can be therefore used to characterise the efficiency of CA enzymes.
Two different procedures were used to induce a transient in the system.
The first procedure is the classical method proposed in the literature for this type of measurement, which is based on the use of a buffer solution to suddenly change the value of the pH. In this case the transient is started by injecting a fixed amount of a buffer solution in the liquid phase (distilled water), with and without the enzyme, which was before brought at the steady state bubbling a constant flow of the CO2 mixture for a sufficient time. Therefore, before the injection, the pH value and the concentration of aqueous CO2 were stable with [CO2] equal to . The injection causes a sudden change in the concentration of [H+] and, due to the fast reaction (3), a corresponding change in
, which can be considered step changes. The dynamical system evolves starting from this step change according to the models presented in the previous section.
In this work also a second way to induce a transient was adopted, which doesn’t require a buffer solution. At the basis of the developed models there is the assumption that the buffer does not play a role in reactions (1)–(3): the use of this alternative approach makes the assumption no more necessary. In other words, with this technique we are sure that the reactions (1)–(3), (10) are sufficient to describe what happens in the bioreactor. In detail, the transient is induced by step-changing the CO2 concentration in the gas mixture bubbled in the liquid phase, inducing as a consequence an abrupt change in the pH value. In detail, before starting the measurement, in the reactor a constant flow of N2 is bubbled for a time long enough to obtain a stable pH measurement. After that, the gas mixture composition is changed, while keeping constant the total flow, introducing a known concentration of CO2. This change triggers a transient both in the CO2 concentration at the output of the reactor and in pH value of the liquid phase. The above operations can be repeated alternating phases of pure N2 with phases in which mixtures of N2 and different concentrations of CO2 are bubbled in the reactor. These operations are performed continuously, using the same liquid sample in the reactor, with the advantage of increasing the time efficiency of the measurement procedure.
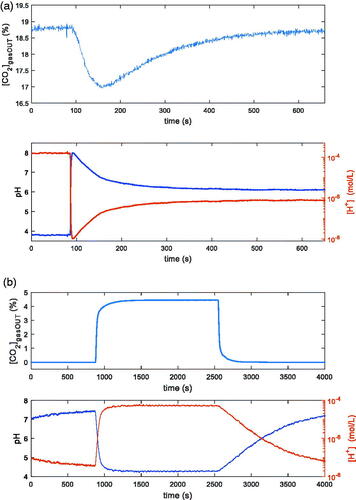
In two examples of measurements ([CO2]gasOUT and pH /[H+] versus time), obtained with the two techniques, are shown. In both cases in the reactor there are 100 ml of distilled water, kept at the constant temperature T = 25 °C, and the constant total flow is 200 ml/min. is relative to the first technique: the input flow is composed of N2 and 20% CO2. At the time t = 80 s, 1 ml of buffer solution 10 mMol is injected in the reactor. In , relative to the second technique, the flow composition changes: N2 (14 min), N2 and 5% CO2 (25 min), N2 (25 min). In both cases it is evident the possibility of starting a transient phase. In the lower plots of both , the same data are reported as pH and as [H+]: from now on in the figures the information about pH will be plotted equivalently in terms of [H+] or pH.
Figure 3. Examples of transients induced in two different ways in the reactor described in Sec. II.1, containing 100 ml of distilled water and kept at T = 25 °C. In both pictures the upper plot is the measured CO2 concentration at the output of the reactor vs. time, whereas the lower plot is the pH measurement inside the reactor vs. time. (a): 200 ml total flow (80 % N2 + 20% CO2); 1 ml of tris-hydroxymethyl-aminomethane 10 mMol injected @ t = 80 s. (b): 200 ml total flow: N2 (14 min), N2 and 5% CO2 (25 min), N2 (25 min).
As discussed, with both the techniques used to induce transients, the measured variables and pH are sampled using the measurement system described in Section II.1. Since the measurement system behaves as a low pass filter, and its transfer function, which also comprises the contribution of the physical system, can’t be easily predicted, this was experimentally estimated utilising a reference test. This latter consists of injecting the buffer solution standard dose, observing the measured quantities and comparing them to the theoretical ones obtained exploiting the reaction rate constants found in the literature. A first order linear system was assumed, and, to obtain the filter parameter, a model fitting was exploited.
Whatever the technique used to induce the transient, the tests were repeated with and without the CA enzyme. The experimental data were then fitted with the output of the models discussed in Sect. II.2, including the filter modelling the dynamic behaviour of the measurement system, to derive the unknown parameters of the model: i.e. the forward and backward reaction rate constants. The model implementation and the fitting procedure are described in detail in what follows.
2.4. Model implementation and fitting
The developed models were numerically implemented in Matlab. The differential equations were numerically solved and a non-linear least square fitting (lsqnonlin) was used to fit the experimental data and to find the unknown parameters of the model (the forward and backward reaction rate constants in EquationEquations (4)–(6) and the filter time constant). The temperature at which the reactions occur is an input to the model, as it is kept constant by the thermostatic bath, as well as the input gas flow composition, which is derived from the flowmeter settings.
In particular, the fitting was obtained considering transients as proposed in this paper. In , and in , examples of the fitting results obtained after parameter estimation for the two models, the general one and the simplified one, by using measurements in pure water with transients induced by varying the input CO2 concentration @T = 25 °C, are shown. From the curves reported in and from the estimated parameters shown in , it can be seen, as it was anticipated, that the simplified model is, in these conditions, accurate enough to describe the overall system transient behaviour. Therefore, from now on, the results obtained with the general model, which requires the estimation of 5 parameters instead of 4, will be shown and discussed only when they allow to obtain a significantly higher level of accuracy with respect to the simplified model.
Figure 4. Examples of fittings obtained with the general model (a) and the simplified model (b) on data measured in dynamic conditions with the system described in Sec. II, containing 100 ml of distilled water and kept at T = 25 °C. In both pictures the upper plot is the measured CO2 concentration at the output of the reactor vs. time, whereas the lower plot is the [H+] vs. time obtained from the pH measurements. Measurement conditions: 200 ml total flow: N2 (10 min), N2 and 1% CO2 (25 min), N2 (30 min), N2 and 2% CO2 (25 min), N2 (30 min). Fitting maximum error lower than 3% ([CO2]) and 5% ([H+]) (a), and 3% ([CO2]) and 5% ([H+]) (b).
![Figure 4. Examples of fittings obtained with the general model (a) and the simplified model (b) on data measured in dynamic conditions with the system described in Sec. II, containing 100 ml of distilled water and kept at T = 25 °C. In both pictures the upper plot is the measured CO2 concentration at the output of the reactor vs. time, whereas the lower plot is the [H+] vs. time obtained from the pH measurements. Measurement conditions: 200 ml total flow: N2 (10 min), N2 and 1% CO2 (25 min), N2 (30 min), N2 and 2% CO2 (25 min), N2 (30 min). Fitting maximum error lower than 3% ([CO2]) and 5% ([H+]) (a), and 3% ([CO2]) and 5% ([H+]) (b).](/cms/asset/2df721d4-bae9-477c-9622-2a1caecbd26e/ienz_a_1864631_f0004_c.jpg)
Table 1. Estimated parameters of EquationEquations (4)–(6) for the measurements shown in . Water. General and Simplified Model.
3. Results and discussion
The obtained experimental results have showed that the proposed measurement techniques can be used to characterise the activity of CA enzymes in different conditions (temperature and input CO2 concentration), and also that the proposed model is sufficiently accurate so as to capture the most important features of the dynamic behaviour of the system.
The results presented in this section are obtained following the measurement procedures described in the previous section at the fixed temperatures of 25 °C and 4 °C (measurements at different temperatures allow to exploit different trade offs between reaction rate, which increases with temperature, and solubility of carbon dioxide in water, which decreases with temperature). The input gas flow is always 200 ml/min, and the CO2 concentration is fixed and equal to 20% for transients induced by the buffer solution (first technique), and variable with values in the set (0%, 1%, 2%, 5%, 10%) for transients induced with the second technique. The experimental data are obtained both with the SspCA immobilised on the external surface of Escherichia coli cellsCitation14, and with a commercial CA from bovine erythrocytes (Sigma-Aldrich C-3934). With reference to the SspCA, the enzyme was introduced in the system using a concentration of 3.5 mg CA/g of bacterial cells.
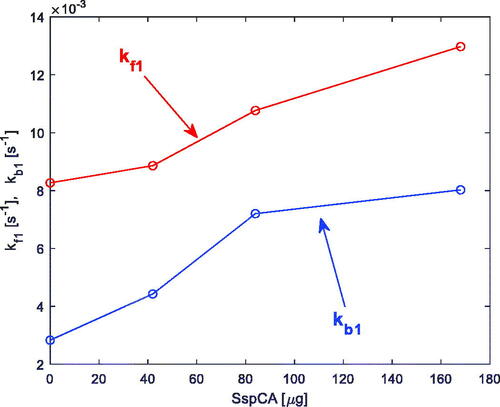
The experimental data relative to the SspCA enzyme were already reported and discussed inCitation18, and are only summarised hereafter. In particular, in an example of the experimental data and the prediction of the model obtained by fitting the experimental data is shown (in detail, the data are relative to the presence in the reactor of 12 mg of membrane-bound SspCA (42 µg SspCA)). The first technique was used in this case to induce a transient in the reactor, and the temperature is T = 25 °C. As discussed inCitation18, the proposed model fits the experimental data with satisfactory accuracy. In a plot is shown of the estimated relevant rate constants of Equationreaction (2)(2)
(2) , kf1 and kb1, as a function of the SspCA quantity present in the reactor.
Figure 5. Experimental and predicted data comparison in the presence of 12 mg of membrane-bound SspCA (42 µg SspCA). Upper plot: gaseous CO2 concentration in the gas flow at the exhaust. Lower plot: pH vs. time. Transient induced by the buffer solution. T = 25 °C.
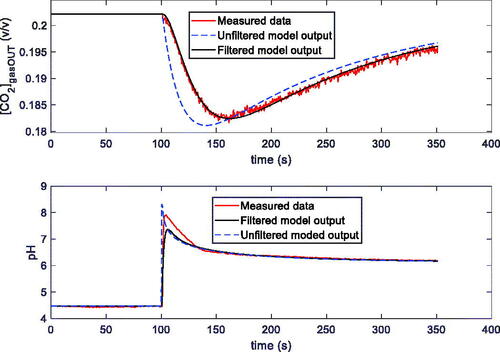
Figure 6. Estimated rate constants kf1 and kb1 (Equationreaction (2)(2)
(2) ), obtained from the measurements described inCitation18, versus SspCA quantity in the reactor.
Additional experiments were performed with the CA from bovine erythrocytes inducing transients by varying the CO2 concentration in the input gas flow. These experiments were performed at T = 4 °C. The selection of this temperature is a trade off between the higher solubility of CO2 in water that is experienced lowering the temperature (the Bunsen coefficient almost doubles passing from T = 25 °C to T = 4 °C) and the corresponding general lowering of the reaction rate constants. Due to the different experimental conditions with respect to the experiments discussed so far, the results obtained with the general model will be considered. In any case, the worsening of the results if the simplified model is used (max 3%) does not invalidate the drawn conclusions.
The results obtained confirm what already discussed inCitation18, and in particular that with this measurement system, together with the developed model, it is possible to characterise the catalytic activity of CA enzymes, quantifying the increase of the rate of hydration of CO2 also for low CA concentrations. In detail, also with the new technique to induce transients proposed in this paper, the fitting of the model (4)–(6) allows to clearly discriminate between presence and absence of CA, and among different amounts of CA ( and ). In the satisfactory behaviour of the model, also at T = 4 °C, can be appreciated.
Figure 7. Tests in dynamic conditions with the system described in Sec. II, containing 100 ml of distilled water and kept at T = 4 °C. Measurement conditions: 200 ml total flow: N2 (8.5 min), N2 and 5% CO2 (16 min), N2 (32 min), N2 and 10% CO2 (16 min), N2 (8.5 min). The three curves are relative to water without CA and with 10 mg and 20 mg of CA from bovine erythrocytes. The upper plot shows the measured CO2 concentration at the output of the reactor vs. time, whereas the lower plot is the [H+] vs. time obtained from the pH measurements.
![Figure 7. Tests in dynamic conditions with the system described in Sec. II, containing 100 ml of distilled water and kept at T = 4 °C. Measurement conditions: 200 ml total flow: N2 (8.5 min), N2 and 5% CO2 (16 min), N2 (32 min), N2 and 10% CO2 (16 min), N2 (8.5 min). The three curves are relative to water without CA and with 10 mg and 20 mg of CA from bovine erythrocytes. The upper plot shows the measured CO2 concentration at the output of the reactor vs. time, whereas the lower plot is the [H+] vs. time obtained from the pH measurements.](/cms/asset/9a563a09-d4e9-487c-b90d-5c54583ed8c3/ienz_a_1864631_f0007_c.jpg)
Figure 8. Measurements and relative fittings obtained with the general model. Measurement conditions: 200 ml total flow: N2 (8.5 min), N2 and 2% CO2 (16 min), N2 (32 min), N2 and 5% CO2 (16 min), N2 (32 min), N2 and 10% CO2 (16 min), N2 (25 min). Measurements obtained with the system described in Sec. II, containing 100 ml of distilled water, kept at T = 4 °C, with 10 mg (a) and 20 mg (b) of CA from bovine erythrocytes. In both pictures the upper plot is the measured CO2 concentration at the output of the reactor vs. time, whereas the lower plot is the [H+] vs. time obtained from the pH measurements. Fitting maximum error lower than 4% for [CO2] and 18% for [H+] (a), and 4% for [CO2] and 12% for [H+] (b).
![Figure 8. Measurements and relative fittings obtained with the general model. Measurement conditions: 200 ml total flow: N2 (8.5 min), N2 and 2% CO2 (16 min), N2 (32 min), N2 and 5% CO2 (16 min), N2 (32 min), N2 and 10% CO2 (16 min), N2 (25 min). Measurements obtained with the system described in Sec. II, containing 100 ml of distilled water, kept at T = 4 °C, with 10 mg (a) and 20 mg (b) of CA from bovine erythrocytes. In both pictures the upper plot is the measured CO2 concentration at the output of the reactor vs. time, whereas the lower plot is the [H+] vs. time obtained from the pH measurements. Fitting maximum error lower than 4% for [CO2] and 18% for [H+] (a), and 4% for [CO2] and 12% for [H+] (b).](/cms/asset/8610931e-e158-47b9-aae7-1ab4e18236ca/ienz_a_1864631_f0008_c.jpg)
Table 2. Estimated rate constants of Equationreaction (2)(2)
(2) for the measurements shown in and . General Model.
4. Conclusions
In this paper we have used chemical kinetics modelling together with dynamical system theory for interpreting measurement results obtained with a two-phase bioreactor, with the aim of characterising the activity of CA enzymes in the catalysis of the reversible reaction of the carbon dioxide (CO2) hydration to bicarbonate (HCO3−) and protons (H+). The characterisation is performed by inducing a transient (either by injecting a buffer solution or by changing the input CO2 gas concentration) in the bioreactor, which is the heart of the measurement system, and then monitoring and quantifying the consequent evolution of the CO2 hydration reaction.
In particular, the presented system, tested on commercial CA enzymes from bovine erythrocytes, allowed to obtain results proving that the proposed measurement techniques can be used to assess the efficiency of laboratory CAs like the membrane-bound SspCA, also at low concentrations. The modelling of the system under test allows for finding a robust way for deriving kinetics parameters, far less sensitive to measurement noise, in contrast to typical data processing used in the literature based on the numerical evaluation of measurement signal derivative.
Acknowledgements
We are grateful to Giovanni Del Monaco (CNR-IBBR) for technical assistance.
Disclosure statement
No potential conflict of interest was reported by the author(s).
References
- Addabbo T, Bertocci F, Fort A, et al. Gas sensing properties and modeling of YCoO3 based perovskite materials. Sens Actuat B Chem 2015;221:1137–55.
- Fort A, Mugnaini M, Rocchi S, et al. Surface state model for conductance responses during thermal-modulation of SnO2-based thick film sensors: part II—experimental verification. IEEE Trans Instrum Meas 2006;55:2107–17.
- Fort A, Mugnaini M, Pasquini I, et al. Modeling of the influence of H2O on metal oxide sensor responses to CO. Sens Actuat B Chem 2011;159:82–91.
- Addabbo T, Fort A, Mugnaini M, et al. Quartz-crystal microbalance gas sensors based on TiO2 nanoparticles. IEEE Trans Instrum Meas 2018;67:722–30.
- Barni S, Fort A, Becatti M, et al. Detection of allergen-IgE interaction in allergic children through combined impedance and ROS measurements. IEEE Trans Instrum Meas 2017;66:616–23.
- Addabbo T, Fort A, Mugnaini M, et al. On the suitability of low-cost compact instrumentation for blood impedance measurements. IEEE Trans Instrum Meas 2019;68:2412–24.
- Zosel J, Oelßner W, Decker M, et al. The measurement of dissolved and gaseous carbon dioxide concentration. Meas Sci Technol 2011;22:072001.
- Mondal M, Khanra S, Tiwari ON, et al. Role of carbonic anhydrase on the way to biological carbon capture through microalgae—a mini review. Environ Prog Sust Energy 2016;35:1605–15.
- Supuran CT, Capasso C. An overview of the bacterial carbonic anhydrases. Metabolites 2017;7:56.
- Del Prete S, De Luca V, Nocentini A, et al. Anion inhibition studies of the beta-carbonic anhydrase from Escherichia coli. Molecules 2020;25:2564.
- Del Prete S, Perfetto R, Rossi M, et al. A one-step procedure for immobilising the thermostable carbonic anhydrase (SspCA) on the surface membrane of Escherichia coli. J Enzyme Inhibit Med Chemistry 2017;32:1120–8.
- De Simone G, Monti SM, Alterio V, et al. Crystal structure of the most catalytically effective carbonic anhydrase enzyme known, SazCA from the thermophilic bacterium Sulfurihydrogenibium azorense. Bioorg Med Chem Lett 2015;25:2002–6.
- Di Fiore A, Capasso C, De Luca V, et al. X-ray structure of the first ‘extremo-alpha-carbonic anhydrase’, a dimeric enzyme from the thermophilic bacterium Sulfurihydrogenibium yellowstonense YO3AOP1. Acta Crystallogr D Biol Crystallogr 2013;69:1150–9.
- Migliardini F, De Luca V, Carginale V, et al. Biomimetic CO2 capture using a highly thermostable bacterial α-carbonic anhydrase immobilized on a polyurethane foam. J Enzyme Inhibit Med Chem 2014;29:146–50.
- Peirce S, Russo ME, Perfetto R, et al. Kinetic characterization of carbonic anhydrase immobilized on magnetic nanoparticles as biocatalyst for CO2 capture. Biochem Eng J 2018;138:1–11.
- Yahia M, Abdelrahim M, Martins CF, et al. Supported ionic liquid membranes immobilized with carbonic anhydrases for CO2 transport at high temperatures. J Membr Sci 2017;528:225–30.
- Del Prete S, Merlo R, Valenti A, et al. enhancement of the α-carbonic anhydrase from Sulfurihydrogenibium yellowstonense by using the anchoring-and-self-labelling-protein-tag system (ASLtag). J Enzyme Inhib Med Chem 2019;34:946–54.
- Parri L, Fort A, Vignoli V, Lo Grasso A, Mugnaini M, Capasso C, Del Prete S, Romanelli MN, Supuran C. A measurement system for the evaluation of efficiency of enzyme accelerated CO2 capture systems based on modeling. In: Proceedings of the 2020 IEEE International Instrumentation & Measurements Technology Conference. 2020 I2MTC; May 25–28 2020; Valamar Lacroma, Dubrovnik, Croatia.
- Available on line: https://pdf.directindustry.com/pdf/alphasense/irc-a1-carbon-dioxide/16860-592355.html
- Mirjafari P, Asghari K, Mahinpey N. Investigating the application of enzyme carbonic anhydrase for CO2 sequestration purposes. Ind Eng Chem Res 2007;46:921–6.
- Mahinpey N, Asghari K, Mirjafari P. Biological sequestration of carbon dioxide in geological formations. Chem Eng Res Des 2011;89:1873–8.
- Tokumura M, Baba M, Kawase Y. Dynamic modeling and simulation of absorption of carbon dioxide into seawater. Chem Eng Sci 2007;62:7305–11.
- Johnson KS. Carbon dioxide hydration and dehydration kinetics in seawater 1. Limnol Oceanogr 1982;27:849–55.
- Sun Q, Kang YT. Review on CO2 hydrate formation/dissociation and its cold energy application. Renew Sustain Energy Rev 2016;62:478–94.
- Penders-van Elk NJ, Hamborg ES, Huttenhuis PJ, et al. Kinetics of absorption of carbon dioxide in aqueous amine and carbonate solutions with carbonic anhydrase. Int J Greenhouse Gas Control 2013;12:259–68.