
 ?Mathematical formulae have been encoded as MathML and are displayed in this HTML version using MathJax in order to improve their display. Uncheck the box to turn MathJax off. This feature requires Javascript. Click on a formula to zoom.
Abstract
Small molecule modulators of mitochondrial function have been attracted much attention in recent years due to their potential therapeutic applications for neurodegenerative diseases. The mitochondrial translocator protein (TSPO) is a promising target for such compounds, given its involvement in the formation of the mitochondrial permeability transition pore in response to mitochondrial stress. In this study, we performed a ligand-based pharmacophore design and virtual screening, and identified a potent hit compound, 7 (VH34) as a TSPO ligand. After validating its biological activity against amyloid-β (Aβ) induced mitochondrial dysfunction and in acute and transgenic Alzheimer’s disease (AD) model mice, we developed a library of analogs, and we found two most active compounds, 31 and 44, which restored the mitochondrial membrane potential, ATP production, and cell viability under Aβ-induced mitochondrial toxicity. These compounds recovered learning and memory function in acute AD model mice with improved pharmacokinetic properties.
1. Introduction
Alzheimer’s disease (AD) is a late-onset, progressive, age-dependent neurodegenerative disorder, characterised clinically by the impairment of cognitive functions and changes in behaviour and personalityCitation1. Among several hypothesis regarding the AD pathogenesis, mitochondrial dysfunction has been reported as an early event observed in ADCitation2. Specifically, recent studies suggested that amyloid-β (Aβ) has deleterious effects on mitochondrial function and may contribute to respiratory chain impairment, neuronal apoptosis, and generation of reactive oxygen species (ROS) in ADCitation3,Citation4. While the mechanisms underlying Aβ-induced mitochondrial stress is still under debate, emerging evidences indicate that the maintenance of mitochondrial function may provide a potential treatment option for ADCitation5,Citation6.
As a therapeutic strategy against AD, several mitochondrial proteins have been highlighted as promising drug targetsCitation7,Citation8. In particular, the 18 kDa translocator protein (TSPO) is an evolutionally conserved protein located in the outer mitochondrial membrane (OMM), and is known to play crucial roles in steroidogenesis, apoptosis, immune response, and Ca2+ homeostasisCitation9,Citation10. TSPO is also involved in mitochondrial functions such as ATP production, ROS generation, and mitochondrial polarisation (ΔΨm)Citation11. More importantly, several TSPO ligands showed neuroprotective effect by decreasing microglial activation in a rat model of neurodegeneration, suggesting that TSPO may serve as a potential therapeutic targetCitation12. In particular, it has been reported that TSPO ligands may act on the formation of the mitochondrial permeability transition pore (mPTP), which causes mitochondrial swelling and cell death by allowing the passage of ions and proteins between the mitochondria and the cytosolCitation13,Citation14. Although, the exact structure of the mPTP still remains elusive, many studies indicate that the mPTP is a multiprotein complex composed of cyclophilin D (CypD), the voltage-dependent anion channel 1(VDAC1), and TSPO. Compounds targeting CypDCitation15,Citation16 and TSPOCitation14 have demonstrated neuroprotective activity by blocking the formation of the mPTP, specifically in Aβ-induced mitochondrial dysfunctionCitation17,Citation18. In addition, the administration of TSPO ligands recovered ΔΨm and ATP production, disrupted by the treatment of Aβ in vitroCitation19, but also improved cognitive function of transgenic AD model miceCitation20. Another recent study also suggest that TSPO ligands may inhibit ROS generation by blocking the interaction between TSPO and VDAC1Citation21, supporting that TSPO is a viable target for the treatment ADCitation22,Citation23.
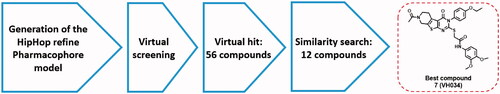
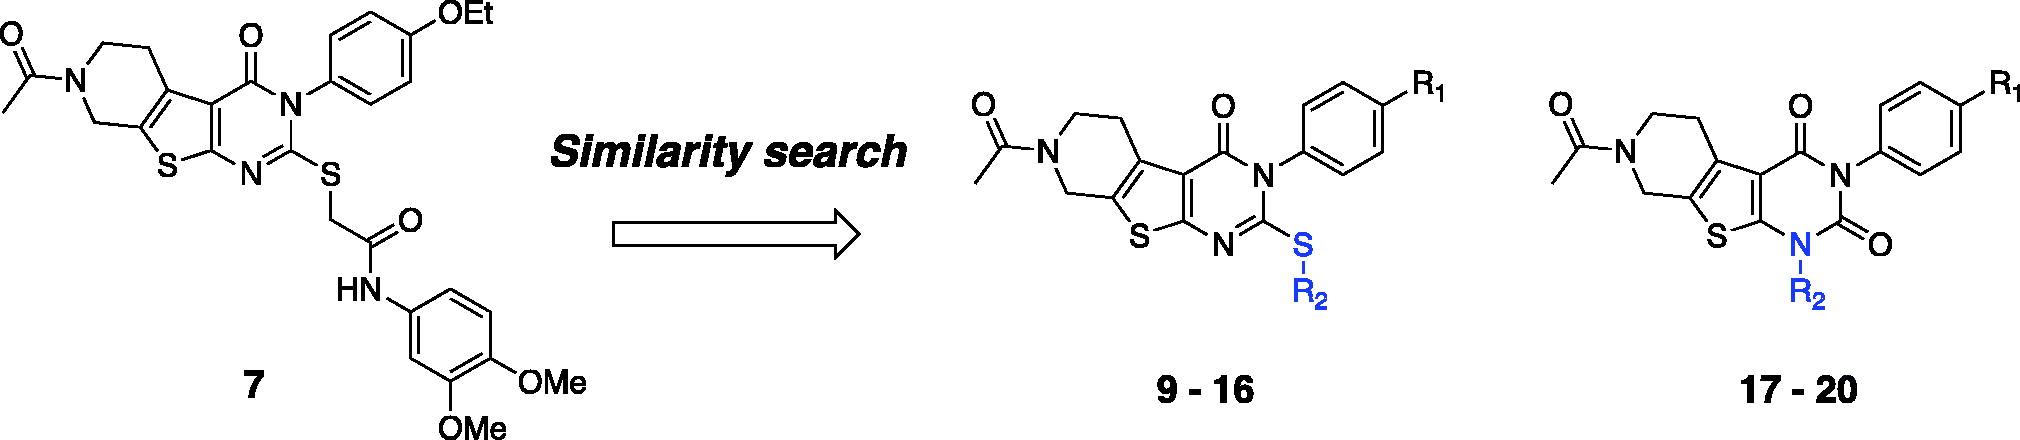
In this work, we aim to find novel TSPO ligands that can restore mitochondrial function in cellular and animal models of AD. Previously developed TSPO ligands mostly consist of either a benzodiazepine or a steroid scaffold, because TSPO was initially thought to be expressed only in the periphery with a propensity to bind benzodiazepines such as diazepamCitation24,Citation25. Given that the structures of the bacterial and mouse TSPO have been identified very recentlyCitation26,Citation27, we believe that this new structural information will allow us to find TSPO ligands with a novel scaffold that can be readily optimised for further therapeutic development. To this end, we performed a ligand-based pharmacophore modelling, followed by a virtual screening as described in . We identified several hit compounds, and performed in vitro mitochondrial functional assays to evaluate biological activity. We further optimised these hit compounds via a similarity search and in vitro assays, and found two most active compounds, 7 (VH034) and 14 (VH062). Next, we designed and synthesised a library of TSPO ligands based on the structures of the two compounds. We evaluated biological activities of the synthesised ligands in vitro and in vivo to identify novel TSPO ligands that can recover neuronal cells from Aβ-induced mitochondrial dysfunction, but also improve cognitive impairment in AD model mice. We also performed pharmacokinetic analysis and docking studies to validate the activity of the identified ligands.
Figure 1. Virtual screening process to identify the best hit compound.
2. Materials and methods
2.1. Generation and validation of common feature pharmacophore model
Six TSPO ligands were collected from Integrity, and four TSPO ligands from the Integrity database of Prous (www.prous.com) were selected for HipHop pharmacophore analysis. The conformational models of selected compounds having up to 250 conformers were built using the “best conformer generation” method with a 20 kcal/mol energy cut-off. HipHop pharmacophore models were derived by comparing a set of conformational models and a number of three-dimensional configurations of chemical features shared among the training set molecules. The parameter settings of Maximum Omitted Features, Misses, and Complete Misses were varied to generate multiple hypotheses in which some compounds may or may not fit all features. Three chemical functions with hydrogen bonding acceptor, hydrogen bonding donor, and hydrophobic group were used as the pharmacophore features. The hypothesis generation process in Catalyst was returned 10 possible pharmacophore hypotheses having different arrangements of constituent features or ranking scores. After deleting the redundant hypotheses that have the same chemical characteristics and nearly the same distances between these functions, diverse configurations of hypotheses were selected according to ranking scores and fitting scores. The best hypothesis was determined by comparing the highest fit value of training set compounds.
2.2. Virtual screening using an external library
Virtual screening was carried out by combining two HipHop Refine models and one shape-added pharmacophore model to obtain new compounds with desired activity profiles. The commercial library Asinex (AsinexGold, 229,398 compounds, AsinexPlatinum, 125,231 compounds, Asinex, Moscow, Russia, www.asinex.com) and ChemDiv (693,042 compounds, ChemDiv, Inc., San Diego, CA, USA, www.chemdiv.com) have been utilised for virtual screening. The best pharmacophore model was used for the virtual screening experiment, by selecting the fast flexible database search option. From the initial screening, compounds with similar functional and spatial properties defined in 3D pharmacophore query were selected on the basis of their fit values. Compounds obtained by fit values were further filtered by visual inspection. The selected compounds were purchased for biological assays.
2.3. Synthesis
All reagents were obtained from commercial sources and used without further purification. All reactions were performed under a nitrogen atmosphere in oven-dried glassware. Reactions were monitored by analytical thin-layer chromatography (TLC) plates (Merck, catalog no. 1.05715) with spots visualised by UV light (λ = 254 nm) or using a KMnO4 solution. Solvents were evaporated using a rotary evaporator under a reduced pressure of ∼50 mBar. The reaction products were purified by flash column chromatography using silica gel 60 (Merck, catalog nos. 1.07734). Melting points were determined using an OptiMelt melting point apparatus (Stanford Research System, Inc.) in open capillary tube without correction. 1H (300 or 400 MHz) and 13C (75 or 100 MHz) NMR spectra were recorded using tetramethylsilane (TMS) as the internal standard. Chemical shifts (δ) are reported in parts per million (ppm) values relative to TMS, and the coupling constants (J) are reported in hertz (Hz). The purity (≥95%) of the samples was determined by analytical HPLC using a Waters E2695 system with SunFire C18 column (4.6 mm × 150 mm; 5 µm). HPLC data were recorded using the parameters as follows: H2O/MeCN, 90/10 → 0/100 in 20 min, +3 min isocratic, flow rate of 1.0 ml/min, λ = 254 and 280 nm. High–resolution mass spectra (HRMS) were recorded on an LTQ Orbitrap (Thermo Electron Corporation) instrument. Reaction yields are for purified products. Detailed experiment procedures and characterisation of all synthesised compounds can be found in the Supporting Information.
2.4. Cell culture
HT-22 (mouse hippocampal cells) cells were grown in Dulbecco’s Modified Eagle’s Medium (DMEM, GIBCO) supplemented with 10% (vol/vol) FBS and antibiotics (100 mg/mL penicillin/streptomycin mix) in a humidified atmosphere at 37 °C with 5% CO2.
2.5. Preparation of Aβ1–42
To prepare a homogenous solution of monomeric Aβ, Aβ1–42 peptide (American Peptide) was mixed with 1 ml of 1,1,1,3,3,3 hexafluoro-2-propanol (HFIP; Sigma–Aldrich) and vortexed gently. Then, the solution was aliquoted into microcentrifuge tubes and lyophilised to prepare the Aβ1–42 samples as dried peptide films. The prepared Aβ1–42 samples were stored at −80 °C and used immediately for cell-based assays to minimise possible aggregation of Aβ itself. Before the use of Aβ1–42 samples, the amount of protein was quantified by the BCA protein assay (Pierce BCA protein assay kit; Thermo Scientific). The prepared Aβ1–42 samples were suspended with anhydrous dimethyl sulfoxide (DMSO) to a concentration of 5 mM, and used for each cell-based assay.
2.6. JC-1 assay
Thirty thousand HT-22 cells per well were seeded into a clear 96-well plate (FALCON) at 200 µL per well one day prior to assay. 750 mM of JC-1 (Stratagene) in DMSO stock solution was dissolved into phenol red-free Opti-MEM (GIBCO) medium to make final concentration of 7.5 mM JC-1 per well. Medium was removed from the plate, and 100 µL per well of JC-1 was added. The sample plates were incubated for 1 h and 15 min at 37 °C and washed twice with 100 µL per well of PBS. Subsequently, cells were treated with a 25 µL solution of each compound at 10 µM in Opti-MEM and incubated at 37 °C for 10 min followed by addition of a 25 µL of Aβ (American peptide, 1-42) solution at 10 µM. Fluorescence was measured at every one hour for three hours at ex/em 530 nm/580 nm (“red”) and ex/em 485 nm/530 nm (“green”) by using the Flexstation® 3 (Molecular Devices, USA) reader. The ratio of green to red fluorescence was calculated and normalised by taking the percent changes using vehicle control as 100%.
2.7. Luciferase-based ATP assay
Ten thousand HT-22 cells per well were seeded into a clear 96-well plate (FALCON) one day prior to assay. Medium was removed from the plate, and cells were treated with a 25 µL solution of each compound at 10 µM and incubated at 37 °C for 10 min followed by the addition of a 25 µL of Aβ (American peptide) solution at 10 µM. Cells were incubated at 37 °C for 7 h and washed twice with PBS. Cells were lysed by using 1% Triton-X 100 in TBST buffer solution and the protein concentrations were determined by using the BCA protein determination kit (Thermo scientific). An equal amount of cell lysates from each well was plated into a white 96-well plate (NUNC) and the amount of ATP generated in each sample was determined by using the ATP determination kit (Molecular Probes, USA) containing D-luciferin and luciferase. The % inhibition value was calculated by measuring luminescence from each sample (Flexstation® 3, Molecular Devices, USA), and comparing the ATP levels of the vehicle control treated with Aβ as a negative control. Cell viability was also calculated based on the ATP levels of each sample without the treatment of Aβ solution.
2.8. MTTassay
To a clear 96-well plate (FALCON), the cultured HT-22 cells were seeded in a number of 5,000 per well 24 h prior to the assay. A solution of each test compound (5 µM, 25 µL) was added to each well. After 24 h of incubation at 37 °C, the cells were treated with a 10 µL of MTT solution (3–(4,5-dimethylthiazol-2-yl)-2,5-diphenyltetrazolium bromide, Sigma-Aldrich), incubated for 2 h at 37 °C, and were treated with 135 µL of MTT solubilising solution (10% Triton-X 100 in isopropanol with 0.1 M HCl) for 2 h at 37 °C. The % values of cell viability were determined by using the optical density (OD) values at 560 nm, and normalised by taking the vehicle control (5 µM of DMSO) as 0%.
2.9. CYP inhibition assay
Human CYP450 (CYP1A2, 2D6, 2C9, 2C19, and 3A4) activities were determined by using the Vivid® CYP450 screening kit (Invitrogen, Madison, WI, USA) in a clear 96-well plate. Five positive controls were used as 10 mM solutions in MeCN for five different CYP450 enzymes: CYP1A2 (α-naphthoflavone), CYP2D6 (quinidine), CYP2C9 (sulfaphenazole), CYP2C19 (lansoprazole), and CYP3A4 (ketoconazole). Each sample (test compounds, positive inhibition controls, and solvent controls) was added into each well with the Master Pre-Mix [CYP450 BACULOSOMES® Reagent (recombinant human CYP450 isozyme and rabbit NADPHP450 reductase) and Regeneration System (3.3 mM glucose-6-phosphate and 0.3 U/ml glucose-6-phosphate dehydrogenase in 100 mM potassium phosphate, pH 8.0)]. The mixture was incubated for 5 min at 37 °C, and the Vivid® CYP substrates and 0.1 mM NADP+ buffer were added to initiate the CYP450 enzyme reaction. The % remaining activities of CYP450 were measured after 20 min by using a fluorescent plate reader (Flexstation® 3, Molecular Devices, USA).
2.10. Measurement of liver microsomal stability
Liver microsomes (human, dog, rat, and mouse; 0.5 mg/mL) were incubated with 1 µM of each test compound in the presence of potassium phosphate buffer (PPB) for 5 min at 37 °C. A solution of the NADPH regeneration system (#44332000, Oriental Yeast Co., Japan) was added to begin metabolic reactions of liver microsomes. The resulting mixtures were incubated for 30 min at 37 °C, and the reaction was terminated by the addition of a cold MeCN solution containing an internal standard (chlorpropamide). The mixture was separated by centrifugation (14,000 rpm for 5 min at 4 °C), and the supernatant was analysed by LC-MS/MS (Shimadzu Nexera XR system and TSQ vantage; Thermo Scientific).
2.11. hERG inhibition assay
For automated patch-clamp NPC-16 Patchliner (Nanion Technologies, München, Germany) recordings, CHO-K1 Tet-On hERG cells (IonGate Biosciences GmbH, Frankfurt, Germany) were plated into 100-mm cell culture dishes. Whole-cell currents were recorded with the intracellular solution containing: 50 mM KCl, 60 mM KF, 10 mM NaCl, 2 mM MgCl2, 20 mM EGTA and 10 mM HEPES (pH 7.2), and with the extracellular solution containing: 140 mM NaCl, 4 mM KCl, 2 mM CaCl2, 1 mM MgCl2, 5 mM Glucose and 10 HEPES (pH 7.4). To assist stable seal formations, the seal enhancer containing: 80 mM NaCl, 3 mM KCl, 35 mM CaCl2, 10 mM MgCl2 and 10 mM HEPES (pH 7.4) was used only at the seal formation step. Prior to the whole-cell recordings, the external seal enhancing solution was exchanged to the extracellular solution described above. hERG channel currents were recorded using the parallel EPC-10 patch-clamp amplifiers (HEKA Elektronik, Lambrecht/Pfalz, Germany), and low-pass filtered (10 kHz) with a 4-pole Bessel filter. Cell suspension and patch solutions were automatically added onto the four recording wells in the microfabricated disposable chip (NPC-16 Chip, Nanion Technologies, München, Germany). To obtain the inhibitory constants, hERG tail currents were evoked by repolarizing steps to −50 mV for 500 ms preceded by a 500-ms depolarisation potential of +20 mV at a holding potential of −80 mV with a 20-s sweep interval. Whole-cell currents were acquired and digitised at 5 kHz using Patchmaster (HEKA Elektronik, Lambrecht/Pfalz, Germany). The extracellular solution was exchanged to the extracellular solution containing each blocker via four pipette tips of NPC-16 Patchliner using a 4-fold volume of solution (40 µL) with a speed of 4 µL/s, and the exchanged blocker solution was applied for 100–200 s to the patch-clamped cells until blocker binding had reached equilibrium by monitoring hERG tail currents. Whole-cell recordings were analysed using the Patchmaster/Fitmaster (HEKA Elektronik, Lambrecht/Pfalz, Germany), IGOR Pro (WaveMetrics Inc., Portland, OR, USA), and the GraphPad Prism 4.0 (GraphPad Software, Inc., La Jolla, CA, USA) software.
2.12. Pharmacokinetic study
Each test compound at a dose of 10 mg/kg was administered intravenously or orally to male Sprague-Dawley (SD) rats. Blood samples collected via carotid artery at several time points after administration of each compound were stored at −70 °C until LC-MS/MS analysis. To determine the plasma concentration of each compound, a 0.1 µg/mL of internal standard in 100 µL of MeCN was added to 50 µL of plasma samples. After vortex-shaking and centrifugation at 10,000 rpm for 10 min, 5 µL of the supernatant was analysed by LC-MS/MS [HP1100® HPLC system (Agilent, Santa Clara, CA) combined with API3200® triple-quadrupole mass spectrometer (Applied Biosystems-SCIEX, Concord, Canada)]. The HPLC chromatographic separation was performed on a reversed-phase Xterra® C18 column (Waters Corporation, Milford, MA) using gradient elution consisted of 0.1% formic acid and 0.1% formic acid in 90% MeCN at a flow rate of 0.3 ml/min.
2.13. Animals
The acute AD mice model was prepared by administration of Aβ1-42 solution (10% DMSO/90% PBS) to male ICR mice (6 weeks old, 30 − 33 g) via intracerebroventricular (ICV) injection (Aβ1-42 dose: 500 pmol/mouse) as described previouslyCitation28. The wild type mice (B6C3F1) and double APP/PS1 transgenic mice (Tg AD mice model; APPswe/PSEN1dE9) were purchased from Jackson Laboratory (Bar Harbour, ME, USA). The Tg AD model mice were 11 months old at the beginning of the behaviour test, and were housed for 1 month in a room under controlled temperature and fed ad libitum. The behaviour tests were conducted during daytime in air-controlled and soundproof experiment room. The animal experiments were abided by the guidelines of the Institutional Animal Care and Use Committee of Korea Institute of Science and Technology.
2.14. Y-Maze spontaneous alternation test
To the mice of the acute AD model (n = 7 per group), each test compound (test compound in 20% cyclodextrin, 30 mg/kg) was intravenously injected daily for 6 days. The Y-maze spontaneous alternation test was performed 1 day after the administration of each test compound. The Y maze was made of three equally spaced black plastic arms (40 L × 10 W × 12 H cm) positioned at an equal angle. Each mouse was placed at the end of one arm and allowed to move freely through the maze for 8 min, and the sequence of arm entries was recorded. The arm entry of the mouse was counted when the all four limbs were within an arm. A set of entries into all three arms is considered as a spontaneous alternation. The spontaneous alternation (%) was calculated by the following equation:
2.15. Contextual fear conditioning test
To the Tg mice of the AD model (n = 7 per group), each test compound (30 mg/kg) was orally administrated daily for 1 month. Each mouse was placed in a fear-conditioning chamber (Courlbourn, USA) for 90 s before giving an electric shock. Trials of training were performed using the chamber equipped with a fear conditioning system (FreActimetrics, USA). The training was performed by giving a conditional stimulus (CS) of 75 dB sound for 20 s followed by an unconditional stimulus (US) of electric foot shock (0.5 mA) for the last 2 s in CS. After an additional stay for 1 min, the mouse was returned to its home cage. Fear conditioning test was conducted 24 h after the training. The mouse was placed in the same chamber for 5 min without presentation of CS. Freezing behaviour was considered as the complete absence of any movement except for respiration and heartbeat. Freezing response was measured by the fear conditioning system without application of CS or US.
2.16. Surface plasmon resonance (SPR) measurements
To determine the binding affinities of the selected compounds, the KD values were measured by using Biacore T200 optical biosensor system (GE Healthcare). The recombinant human TSPO (18 kDa, Origene Technologies, Inc., No.: TP320107) was covalently immobilised on a CM5 chip (GE Healthcare) at 25 °C via standard amine-coupling protocols in 10 mM sodium acetate (pH 4.5) at a flow rate of 10 µL/min for 1500s (immobilised protein densities: 5,000–6,000 response unit (RU)). The tested compounds were initially prepared at 10 mM in DMSO, and serially diluted in PBS-P buffer (10 mM NaH2PO4, 150 mM NaCl, pH 7.4) to 1% DMSO. For each tested compound, the kinetic values were measured using a five-point concentration series, 0.001, 0.01, 0.5, 1, and 5 µM. Multiple blank samples of running buffer alone (0 µM of tested compounds) were incorporated in every measurement. The filtered PBS-P buffer containing 1% DMSO was used as a running buffer during the SPR experiments. To measure the kinetic values, a series of different concentrations were injected over the immobilised chip at a flow rate of 50 µL/min (contact time: 120 s, dissociation time: 300 s), followed by the regeneration process at a flow rate of 50 µL/min (contact time: 120 s, stabilisation time: 10 s). The KD value of each compound was calculated by Biacore T200 evaluation software (GE Healthcare) after the standard solvent correction process.
2.17. Docking study
A homology model of human TSPO was prepared using Discovery studio 2017 R2 client software1. The human TSPO sequence (UniProt ID: P30536) was taken from UniProt database. The high-resolution crystal structure of the translocator protein 18 kDa (RCSB ID: 4UC1) from Rhodobacter sphaeroides (Sequence Identity: 33.7%, sequence similarity: 49.7%) was used as a template for the homology model generation. Docking studies were performed with XP docking methodology implemented in Maestro, Schrödinger software2. Ligands were prepared for the energy-minimised structures using OPLS_2005 force field. Proteins were prepared using the protein preparation wizard. Hydrogens were added and water molecules beyond 5 Å from hetero groups were removed. The prepared ligands were docked using the extra precision (XP) method and flexible ligand sampling. Docking images were prepared using Discovery studio software.
3. Results and discussion
3.1. Generation of a pharmacophore model
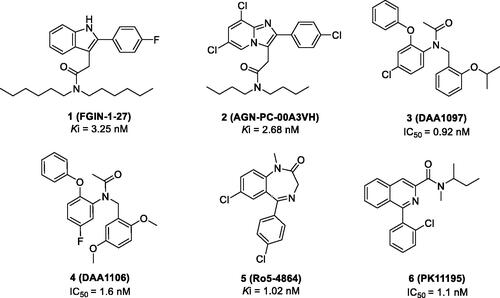
We generated common feature pharmacophore models by using six known TSPO ligands (compounds 1–6) from the Integrity® database of Prous (). These compounds showed potent TSPO binding affinities within the nanomolar range: 2–(2-(4-fluorophenyl)-1H-indol-3-yl)-N,N-dihexylacetamide (FGIN-1–27, Ki = 3.25 nM)Citation29, N,N-dibutyl-2–(6,8-dichloro-2–(4-chloro-phenyl)imidazo[1,2-a]pyridin-3-yl)acetamide (AGN-PC-00A3VH, Ki = 2.68 nM)Citation30, N-(4-chloro-2-phenoxyphenyl)-N-(2-isopropoxybenzyl)acetamide (DAA1097, IC50 = 0.92 nM)Citation31, N-(2,5-dimethoxybenzyl)-N-(5-fluoro-2-phenoxyphenyl)acetamide (DAA1106, IC50 = 1.6 nM)Citation31, 7-chloro-5–(4-chlorophenyl)-1-methyl-1,3-dihydro-2H-benzo[e][1,4]diazepin-2-one (Ro5-4864, Ki = 1.02 nM)Citation32, and N-(sec-butyl)-1–(2-chlorophenyl)-N-methylisoquinoline-3-carboxamide (PK-11195, IC50 = 1.1 nM)Citation33.
Figure 2. Representative TSPO ligands used as a training set to generate the pharmacophore model.
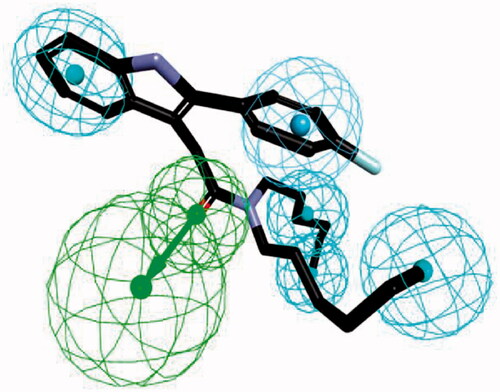
We applied HipHop pharmacophore moduleCitation34,Citation35 which does not use any activity data of the training set compounds; instead, it generates hypotheses by taking each training set compound as a reference to accommodate structural features of all the compounds. Since this method assumes that all the compounds in the training set are equally important, all of the chemical features in each compound will be considered to build a hypothesis space. Next, in order to get more common features, the pharmacophore models were refined by removing one training set compound in each run. The final pharmacophore model was generated by differing the aromatic ring and hydrophobic feature options as described in . The final pharmacophore contains a hydrogen bond acceptor, an aromatic ring and four hydrophobic features. Compound FGIN-1–27 overlapped with the model, showing the oxygen atom map with a hydrogen bond acceptor feature, the fluoro-benzene part with a hydrophobic aromatic feature, and the benzene of the indole and n-alkyl chains of amide part with four hydrophobic features.
Figure 3. The ligand-based pharmacophore model mapping with FGIN-1–27 (1). (C atom, black; N atom, blue; O atom, red; F atom, cyan). The pharmacophore features are drawn as colour-coded spheres: H-bond acceptor, green; hydrophobic feature, light blue; and ring aromatic feature, blue.
3.2. Virtual screening and in vitro assays
We screened commercially available libraries from Asinex (AsinexGold, 229,398 compounds; AsinexPlatinum, 125,231 compounds) and ChemDiv (693,042 compounds) against our pharmacophore model (). Through the BEST flexible search of the databases, 47,268 compounds were found as initial hits from the HipHop pharmacophore model by the fit value (3.50 out of 6.00). Among them, 56 compounds (VH001–VH056; Supplementary Table S1) were manually selected on the basis of their structural diversity and functional groups that are crucial for activity such as the number of heteroatoms, aromatic/non-aromatic ring, n (n = 5, 6, 7)-membered ring, polycyclic ring, alkyl substituent, and their positions.
The selected 56 compounds were purchased and tested by in vitro cell-based assays. Four different cell-based assays (JC-1, MTT, ATP production, and cellular ROS assays) were carried out sequentially. First, the JC-1 assay was performed to screen all 56 compounds, VH001–VH056 (Supplementary Table S1). Since mitochondrial membrane depolarisation is one of the distinct signs of mPTP opening, the mitochondrial uptake of a fluorescent JC-1 dye (5,59,6,69-tetrachloro-1,19,3,39-tetraethylbenzimidazolocarbocyanine iodide) was measured to evaluate the effects of each compound on the mitochondrial membrane potential (ΔΨm). HT22 cells, a mouse hippocampal cell line, were treated with 5 µM of Aβ, incubated with each compound at the same concentration of 5 µM, and subsequently treated with JC-1. On the basis of changes in the red/green fluorescence intensity ratio between the cells treated with Aβ and control, the percent recovery of ΔΨm for each compound was calculated and normalised to the ΔΨm of healthy cells as 100%. Two neuroprotective compounds, piracetam and cyclosporine A (CsA), were also tested for comparison, because these compounds have demonstrated neuroprotective activity by restoring Aβ-induced mitochondrial dysfunctionCitation36 or by inhibiting prolonged opening of the mPTPCitation37.
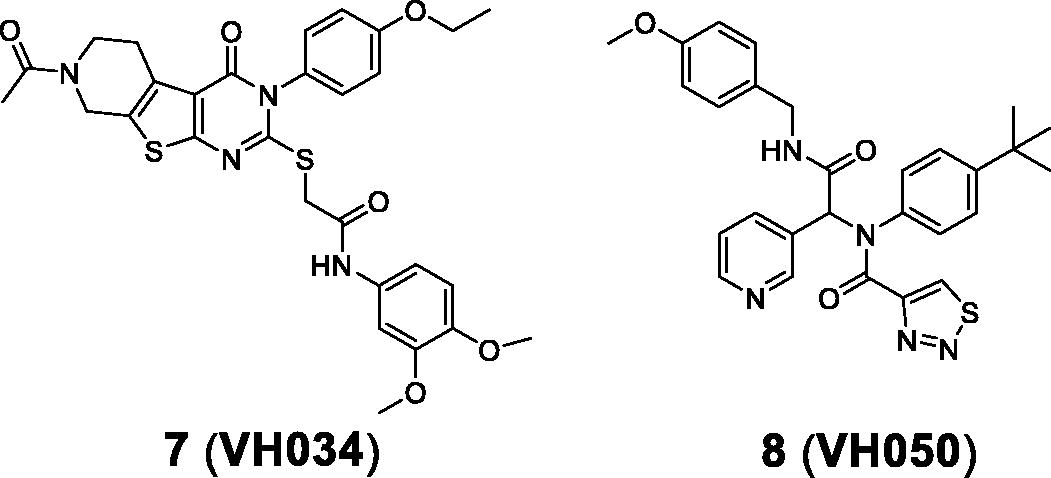
Based on the JC-1 assay results measured from piracetam (60% at 5 µM) and CsA (55% at 5 µM), we selected compounds exhibiting greater than 50% of the percent recovery values for additional in vitro assays. Among 56 compounds, 23 compounds were selected and further tested for the luciferase-based ATP assay. It should be noted that the two reference compounds, piracetam and CsA, appeared to demonstrate differing activity, 127% for piracetam and −46% for CsA; it is not clear whether the effect on ΔΨm can be correlated with ATP production. Compounds 7 (VH034) and 8 (VH050) showed the most potent recovery activities (>40%) (). Thus, we chose these two compounds and further evaluated their biological activity by measuring cell viability and reactive oxygen species (ROS) production. The effects on cell viability of each compound under Aβ-induced cytotoxicity were determined by measuring the metabolic activity of NAD(P)H-dependent cellular oxidoreductases using the 3–(4,5-dimethylthiazol-2-yl)-2,5-diphenyl-tetrazolium bromide (MTT) dye. To measure cellular ROS levels, we used a fluorescence indicator, 2′,7′-dichlorofluorescein diacetate (DCFDA), and calculated the percent inhibition of ROS generation by applying the same method used for MTT assays. Compound 7 inhibited Aβ-induced ROS generation (97% at 5 µM) almost to the level of the untreated control (). On the other hand, compound 8 did not appear to reduce ROS generation, which is likely due to the toxicity of the compound itself (34% of cell viability from the MTT assay). On the basis of the in vitro activity, we selected compound 7 as the best hit from the initial screening library.
Table 1. In vitro cell-based assay results of 7 and 8.
3.3. Additional similarity search and in vitro activity of the identified hit compounds
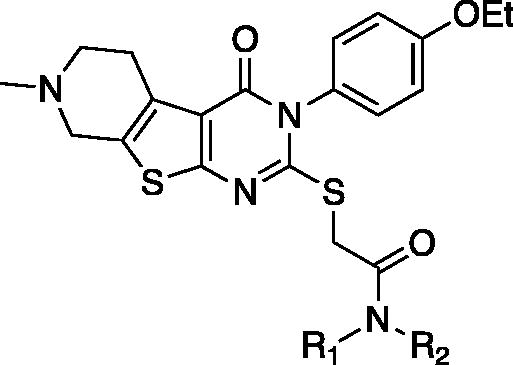
To explore biological activities of structurally similar compounds with 7, a similarity search was carried out by using 7 as a structural template. A total of 12 compounds (9–20; ) were selected from a commercial database and purchased for in vitro assays. These newly selected compounds possess the same tricyclic thienopyrimidine core; compounds 9–12 contain an alkyl chain connected via the sulphur atom of the tricyclic core ring, while compound 13 bears a polar amide group at the same position. Compounds 14–16 contain a lipophilic aromatic group at the same sulphur atom. In compounds 17–20, the sulphur side chain is replaced with a carbonyl group, and both the two nitrogens in the pyrimidine core have aromatic substituents, adding additional hydrophobic groups compared with compounds 9–16. Compounds with a thioalkyl group (9–12) are less effective in recovering ΔΨm than compound 7, whereas compounds with an additional aromatic side chain with no sulphur atom in the core (17–20) have no ATP recovering effect, suggesting that the aromatic side chain connected through the sulphur atom is important for mitochondrial function. Overall, 14 (VH062) is the most potent compound in four different cell-based assays without any noticeable cytotoxicity (). Specifically, compound 14 appeared to be highly effective in recovering ATP production and metabolic function measured by MTT assays, comparable to the levels of untreated cells. Considering that 14 has a smaller R1 substituent (methoxy versus ethoxy group), and highly electron-withdrawing aromatic substituents in the R2 benzamide ring (difluoro versus dimethoxy group) compared with 7, the SAR at these two positions need to be investigated more thoroughly. We will describe the additional SAR in the later section (3.6, compound 27–62).
Table 2. In vitro cell-based assay results of 9–20.
3.4. In vivo activity of the most active hit compounds, 7 (VH034) and 14 (VH062)
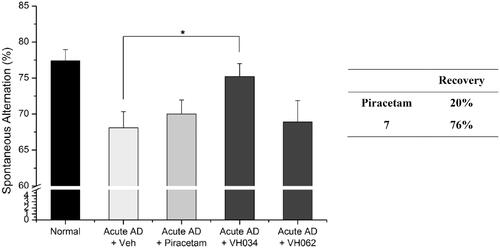
We evaluated in vivo activity of 7 and 14 in an acute AD mouse model. The acute AD model mice were generated by the administration of Aβ1-42 peptide (500 pmol) according to the previously reported methodCitation28, and each compound (30 mg/kg daily) was administered intraperitoneally for 6 days. Piracetam (30 mg/kg daily) was also administered in parallel for comparison. The Y-maze spontaneous alternation tests were performed to measure the recovery of learning and memory deficit in acute AD model miceCitation38,Citation39. After 6 days of administration, we found that compound 7 alleviated spatial learning and memory deficits significantly, restoring 76% of Aβ-induced memory impairments in acute AD model mice (). In contrast, compound 14 did not show any comparable activity, and the piracetam-treated mice only recovered 20% of spatial learning and memory deficits. We believe that the treatment of 7 was beneficial for ameliorating Aβ-induced cognitive impairments.
Figure 4. Recovery of Y-maze spontaneous alternations in an acute AD model by the treatment of compounds 7 or 14 (30 mg/kg daily, 6 days, i.p.) Each group was evaluated by comparing with the piracetam-treated group (30 mg/kg daily, 6 days, i.p.). Data are expressed as a mean ± SEM (n = 7 per group): *p < 0.05.
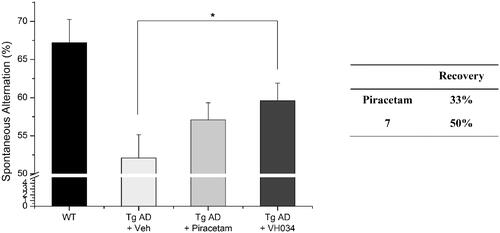
To further validate the therapeutic effects of compound 7, we performed the Y-maze tests by using a transgenic (Tg) mouse model of AD (APPswe/PSEN1dE9 2xTG) aged 11 months. Compound 7 was administrated to the Tg AD model mice for 1 month (30 mg/kg daily) and the Y-maze tests were performed at 12 months of age. As shown in and restored 50% of spatial learning and memory deficits, whereas piracetam recovered 33% of the deficits. Overall, based on the results of the Y-maze behaviour tests, compound 7 showed greater recovery than piracetam in both transgenic and acute AD model mice.
Figure 5. Recovery of Y-maze spontaneous alternations in transgenic (Tg; APPswe/PSEN1dE9 2x TG) AD model mice by the treatment of 7. Each group was evaluated by comparing with the piracetam-treated group (30 mg/kg daily, 1 month, PO). Data are expressed as a mean ± SEM (n = 7 per group): *p < 0.05.
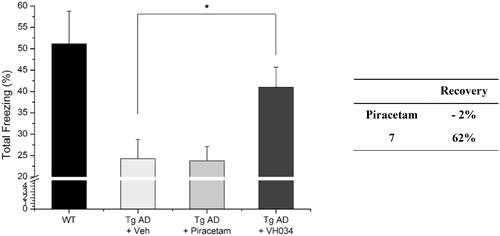
In addition, we assessed recovery effects of compound 7 by performing contextual fear conditioning tests.Citation40 Healthy mice show higher number of total freezing, which is an index of fear learning and memory of rodents; therefore, the number of total freezing responses under fear-relevant stimuli was measured with the compound-treated Tg AD model mice. As shown in , the treatment of 7 restored cognitive function more effectively compared to piracetam-treated mice, which corresponds to the observations from the Y-maze tests. Specifically, the piracetam-treated Tg mice were not affected by the treatment (percent recovery = −2%), whereas 7–treated mice demonstrated a remarkable improvement in cognitive function (62%). Given the excellent in vivo activity of compound 7, as well as the significant in vivo recovery effect, we decided to design new derivatives based on the core structure of compounds 7 and 14 to optimise the biological activity.
Figure 6. Contextual fear conditioning tests in wildtype and transgenic AD model mice. Each group was evaluated by comparing with the piracetam-treated group (30 mg/kg daily, 1 month, PO). Data are expressed as a mean ± SEM (n = 7 per group): *p < 0.05.
3.5. Synthesis of the designed ligands
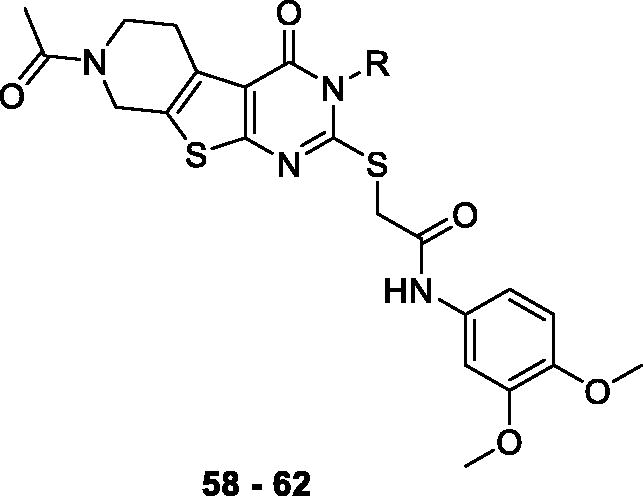
Compounds 7, 14 and their derivatives were prepared as shown in Scheme 1. Starting from commercially available piperidone compounds 21a-b, the tetrahydrothieno pyridine compounds 22a-b were generated via Gewald reactionCitation41. Subsequently, the amino group of compounds 22a-b were converted to an isothiocyanate groupCitation42,Citation43. The addition of p-alkoxy anilines to the isothiocyanate, followed by a cyclisation reaction yielded compounds 25aa-bCitation44. Finally, compounds 7, 14 and their derivatives were obtained via SN2 reaction of compounds 25aa-b with 2-bromo-N-substitued acetamide 26. Additionally, to study SAR of different functional groups (R) at the position of a pendent alkoxy phenyl ring of 7 and 14, compounds 58–62 were designed and synthesised as illustrated in Scheme 2. To synthesise compounds 58–62, we used various alkylamines to diversify R groups (24c-g) instead of using the alkoxy anilines.
Scheme 1. Synthesis of 5,6,7,8-tetrahydropyrido[4',3':4,5]thieno[2,3-d]pyrimidin-4(3H)-one derivatives 7, 14, and 27–57. Reagents and conditions: (a) ethyl 2-cyanoacetate, Sulphur, Et3N, EtOH, reflux, 4 h, 96–100%, (b) 1,1'-thiocarbonylbis(pyridin-2(1H)-one), THF, reflux, 4 h, 80–86%, (c) substituted aniline, EtOH, reflux, 12 h, 84–93%, (d) (i) 10% NaOH/MeOH (1:3), reflux 3 h, (ii) 2 N HCl, 93–98%, (e) 2-bromo-N-substitued acetamide 26, Et3N, MeCN, reflux, 5 h, 33–98%.
![Scheme 1. Synthesis of 5,6,7,8-tetrahydropyrido[4',3':4,5]thieno[2,3-d]pyrimidin-4(3H)-one derivatives 7, 14, and 27–57. Reagents and conditions: (a) ethyl 2-cyanoacetate, Sulphur, Et3N, EtOH, reflux, 4 h, 96–100%, (b) 1,1'-thiocarbonylbis(pyridin-2(1H)-one), THF, reflux, 4 h, 80–86%, (c) substituted aniline, EtOH, reflux, 12 h, 84–93%, (d) (i) 10% NaOH/MeOH (1:3), reflux 3 h, (ii) 2 N HCl, 93–98%, (e) 2-bromo-N-substitued acetamide 26, Et3N, MeCN, reflux, 5 h, 33–98%.](/cms/asset/e1693b7c-4b9b-4f3c-8f07-961d70a9ad36/ienz_a_1900158_sch0001_b.jpg)
Scheme 2. Synthesis of 5,6,7,8-tetrahydropyrido[4',3':4,5]thieno[2,3-d]pyrimidin-4(3H)-one derivatives 58–62. Reagents and conditions: (a) substituted amine, EtOH, reflux, 12 h, 57–99%, (b) (i) 10% NaOH/MeOH (1:3), reflux 3 h, (ii) 2 N HCl, 56–96%, (c) 2-bromo-N-(3,4-dimethoxyphenyl)acetamide 26, Et3N, MeCN, reflux, 5 h, 50–90%.
![Scheme 2. Synthesis of 5,6,7,8-tetrahydropyrido[4',3':4,5]thieno[2,3-d]pyrimidin-4(3H)-one derivatives 58–62. Reagents and conditions: (a) substituted amine, EtOH, reflux, 12 h, 57–99%, (b) (i) 10% NaOH/MeOH (1:3), reflux 3 h, (ii) 2 N HCl, 56–96%, (c) 2-bromo-N-(3,4-dimethoxyphenyl)acetamide 26, Et3N, MeCN, reflux, 5 h, 50–90%.](/cms/asset/25c7fbb6-debd-470f-8cf1-cbd16b161fdf/ienz_a_1900158_sch0002_b.jpg)
3.6. In vitro activity of compounds 27–62
On the basis of our initial cell-based assays (), we found that the sulphur-linked benzamide group is particularly important for in vitro activity while an alkoxy substituent in the aromatic side chain also affected biological activity to some extent. To further explore SAR of these specific positions, we have designed and synthesised additional compounds and tested for in vitro activity. Specifically, we fixed the aromatic alkoxy substituent as either a methoxy (27) or an ethoxy (28–47) group; we added an additional substituent (R2) at the amide nitrogen while diversified the benzamide substituents (R3) as described in .
Table 3. In vitro assay results of compounds 27–47.
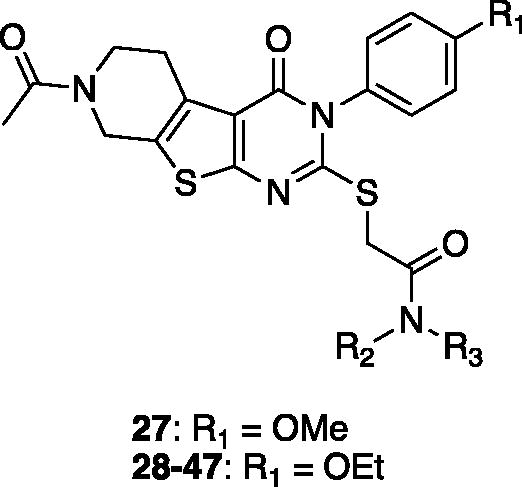
Table 4. In vitro assay results of compounds 48–57.
Most derivatives showed excellent ΔΨm percent recovery values close to or greater than 70%, except compounds 37, 41, and 42. These compounds with low activity have relatively small sized (less than three carbons) alkyl side chains or a single alkyl chain at the amide nitrogen, suggesting that the size and hydrophobicity of the substituent at this position is crucial for cellular activity. Compounds with an aromatic ring (31–36, 44–47) and a longer alkyl chain (39–40) at the same position generally showed better activity than compounds with a piperidine group (28–30), also indicating that overall hydrophobicity of the molecule is important for membrane-associated activity. The percent recovery values of ΔΨm were enhanced with increasing the length of alkyl chain, in the order of methyl (compound 37; 45%) < ethyl (compound 38; 65%) < n-propyl (compound 39; 79%) < n-butyl (compound 40; 80%). In addition, the di-alkyl substituted (R2 and R3) compounds 37–40 showed greater recovery than mono-alkyl substituted (R3 only) compounds 41–43 from the JC-1 assay. When these R2 and R3 alkyl groups were replaced with a constrained heterocycle (compounds 44–47), they demonstrated consistently potent activity (78–83%), indicating that a bulky hydrophobic residue at this specific position is important for recovering Aβ-induced mitochondrial membrane depolarisation.
We further assessed in vitro activity of the compounds demonstrated over 60% of recovery in the JC-1 assays by performing the MTT assay and the ATP production assay. Six compounds (30–31, 44–47) showed superior recovery activities in ATP production compared to 7. Compounds without aromatic substituents (28–29, 37–43) generally showed little to no effects on both assays except compounds 30 and 40 which has relatively bulky side chains. We think that the aromatic substituents are likely to act as a place holder or a steric blocker for specific interactions. Compound 27, which only differs the positions of difluoro-substituents from compound 14, did not show any effect on ATP recovery or MTT assays, suggesting that the difluoro-substituents might be involved in hydrogen-bonding or hydrogen-bonding induced conformational changes. Compounds with a constrained heterocycle connecting the R2 and R3 positions (44–47) appeared to restore ATP production significantly, while piperidinyl analogs (46, 47) are more effective in recovering both ATP production and metabolic activity than piperazinyl analogs (44–45), again suggesting that hydrogen-bonding interactions might be involved in this binding region.
Next, we tested the second set of compounds, 48–57, that were designed to have an N-methyl group replacing the acetamide group at the 7-position of the tetrahydropyrido moiety in 7. As described in , compounds in this series showed slightly less of ΔΨm recovery, while demonstrated better results in ATP recovery and MTT assay, compared to their acetamide counterparts. We think that the replacement of the acetamide to the methyl may have affected electron-density of the nitrogen with little effect on overall hydrophobicity or conformation. The ATP production assay and the MTT assay results indicated that compounds in this group generally showed favourable recovery activity in both assays except compounds 53 and 54.
The final group of compounds contained an alkyl chain in place of the 4-ethoxyphenyl side chain in compound 7 (compounds 58 − 62). As shown in , compounds in this series demonstrated comparable recovery of ΔΨm (60–79%) likely due to their hydrophobicity; however, they generally showed moderate to poor recovery of ATP production (−7 to 23%) and cell viability (0–5%), suggesting that the additional lipophilic substituent may help sustain the membrane potential temporarily, but does not seem to affect overall mitochondrial function.
Table 5. In vitro assay results of compounds 58–62.
3.7. Assessment of drug-like properties of the selected compounds
On the basis of the in vitro mitochondrial functional assays, we selected a total number of 20 compounds with excellent recovery effects. We determined inhibition of CYP450 isozyme, inhibition of the hERG, and human liver microsomal stability to evaluate drug-like properties of the selected compounds (). Compounds 31–32, 34, 36, 45–48, 52, 55, and 56 showed relatively high inhibition (<75%) against at least one CYP450 isozyme. Compounds with bi-substituted N-alkyl chains (, 32, 33, 39, 40, 45–47, 56) demonstrated poor stability in human liver microsome, showing less than 10% of the compound remaining intact after 30 min. Compounds 45–48 also demonstrated low water solubility, thus the IC50 values of the hERG inhibition could not be determined. Compounds 35 and 36 showed moderate hERG inhibition, implying a potential toxicity issue. Compounds 50 and 51 are similar in their structures, in vitro activity and drug-like properties, therefore we selected compound 50 as a representative compound. Based on this toxicity profile, we selected compounds 30, 31, 44, 49 and 50, which demonstrated low to moderate CYP inhibition against all tested isoforms, low hERG inhibition, with moderate to high liver microsomal stability, for further in vivo studies.
Table 6. CYP450, hERG liability, and human liver microsomal stability profiles of the selected compounds.
3.8. In vivo activity of the selected compounds
To assess the in vivo activity of the selected compounds, 30, 31, 44, 49 and 50, we administered each compound (30 mg/kg, daily) to the acute AD model mice for 6 days. After the administration, we evaluated the cognitive function of the mice by performing the Y-maze spontaneous alternation test. As shown in , compounds 31 and 44 significantly recovered learning and memory deficits in the acute AD model mice. Both compounds 31 and 44 improved Aβ-induced memory deficits almost to the level of normal mice, demonstrating the recovery percent of 107% and 98%, respectively. These percent values are greater than those of 7 (76%) and piracetam (20%) (). In contrast, compounds 30, 49, and 50 did not show significant activity. We concluded that compounds 31 and 44 are the most active compounds based on their in vitro and in vivo protective effect against Aβ-induced mitochondrial dysfunction.
Figure 7. Recovery of Y-maze spontaneous alternations in acute AD model mice by treating each compound. Each group was evaluated by comparing with the piracetam-treated group (30 mg/kg daily, 6 days, i.p.). Data are expressed as a mean ± SEM (n = 7 per group): *p < 0.05.
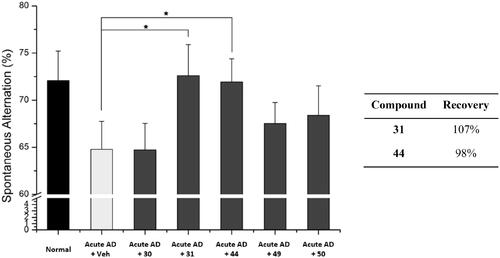
3.9. Pharmacokinetic properties of compounds 31 and 44
We evaluated the pharmacokinetic profiles of the two most active compounds 31 and 44 using SD male rats. As shown in , compound 31 showed low bioavailability (8.0%) whereas compound 44 demonstrated much higher bioavailability (78.4%). However, given its relatively low liver microsomal stability (15.3%) and short plasma half-life (80 min), compound 44 needs further optimisation for oral administration. It is notable that the presence of a constrained phenylpiperazine group at the amide bond region (R3 and R4) improved bioavailability while reduced liver microsomal stability compared to the initial hit compound 7 (Supplementary Tables S3 and S4).
Table 7. Pharmacokinetic parameters (mean ± SD) of compounds 31 and 44 after intravenous (n = 3) and oral (n = 3) administration (10 mg/kg) to SD male rats.a
3.10. TSPO binding affinity measured by SPR
The direct binding affinities of the initial hit compounds 7 and 14 as well as compounds 31 and 44 were determined against recombinant human TSPO by performing surface plasmon resonance (SPR) studies. As shown in and Supplementary Figure S2, all four compounds demonstrated specific binding in a dose-dependent manner, having the KD values in a low micromolar range. Although PK11195, a well-known TSPO ligand, seemed to be much more potent (KD = 1.1 ± 0.45 nM) than our newly identified ligands, given the size and structural differences, we believe that these compounds can serve as a good lead compound with a novel scaffold for future optimisation through SAR studies. These results supported that these compounds specifically interact with TSPO to exert their biological activity.
Table 8. TSPO binding affinity.a
3.11. Docking study
To further investigate the binding mode of the selected compounds, we performed docking studies for the two most active compounds 7 and 44. We generated the human TSPO homology model based on 4UC1 x-ray crystal structure as a template. The binding orientation of compounds 7 and 44 appeared to overlap inside the central pocket of the TSPO model as shown in . The amide group of 7 (glide XP score= −11.27) formed a hydrogen bond with Tyr57 from TM2 as shown in . The dimethoxy phenyl ring inserted between TM1 and TM2 showed a pi-alkyl bond with Cys19 from TM1. The tricyclic fused core ring compactly packed inside the binding pocket via strong pi stacked interactions of Trp95 from TM3 and pi-alkyl interactions of Leu49, Leu150, and His43. Two Pi-sulphur bonds were also observed between Trp53 and the sulphur atom of the thienopiperidinone ring. The sulphur atom from the alkyl chain also exhibited pi-sulphur interactions with Phe25 as shown in .
Figure 8. Interactions of 7 and compound 44 with the human TSPO homology model. (A) Surface depiction of the TSPO binding site with the binding orientation overlapped with 7 (red stick) and compound 44 (blue stick). Detailed view of the interactions between 7 (B) and compound 44 (C) with the human TSPO. TSPO is represented with cyan helices and the interacting amino acids are depicted with grey sticks. Corresponding 2D interactions of 7 (D) and compound 44 (E).
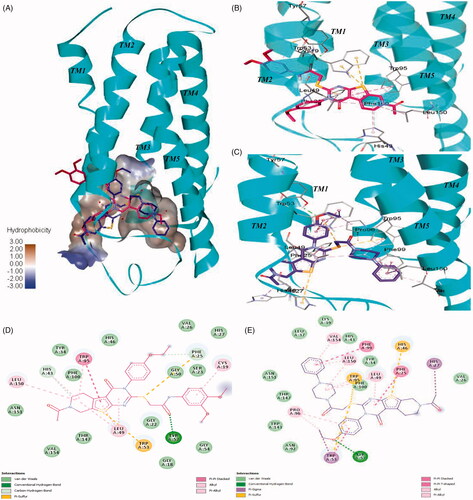
In contrast, compound 44 (glide XP score= −11.20) fitted in reverse orientation inside the binding cavity () which explains slightly lower binding affinity of 44 than 7. Because of the presence of a bulky phenylpiperazine group, the tricyclic core ring of compound 44 moved towards the space between intracellular loop1 residues such as Phe25, His46, and Leu49 interacting via strong pi stacked, pi-sulphur and pi-alkyl contacts respectively (). The phenylpiperazine side chain is pointed towards TM5 while interacts with Phe99 from TM3 via a strong pi-stacked interaction. The presence of pi-stacking interactions corroborates the superior activity observed from compounds with an aromatic ring compared to compounds with no aromatic side chains. Several pi-alkyl interactions with Val154, Leu150, Leu49, and Trp95 were also observed. The sulphur atom from the alkyl chain showed two pi-sulphur bonds with Trp53 and Trp95. The oxygen atom of the ethoxy group formed a hydrogen bond with Tyr57. Trp53 showed pi stacked and pi sigma contacts with the ethoxy phenyl ring as described in .
Overall, 7 and 44 have a similar scaffold and share the same binding cavity. In addition, both molecules appeared to form a hydrogen bond with Tyr57 residue. Docking score reveals that they have the equal binding potential with TSPO protein, but they may bind in the reverse orientation. The binding region between TM2, TM3, and TM5 is hydrophobic due to the presence of residues like Leu49, Trp95, Phe99, Leu150, and Val154. This hydrophobic region is preferable for binding of the phenylpiperazine group. Therefore, in spite of having similar scaffolds 7 and 44 demonstrate an opposite binding orientation in the docking study.
4. Conclusion
In this study, we synthesized a series of TSPO ligands derived from a ligand-based pharmacophore. We evaluated their in vitro and in vivo activity of mitochondrial functional recovery and discovered two initial hit compounds from virtual screening and in vitro assays, and further synthesised a library of analogs. Two most active compounds 31 and 44 demonstrated excellent recovery of ΔΨm, ATP production, and cell viability upon Aβ-induced cytotoxicity. These compounds also demonstrated neuroprotective effects in AD model mice, improving learning and memory impairment. Our SPR data and the docking study results indicated that 7 and 44 directly interact with the TSPO binding site, while they may occupy the cavity in reverse orientation to each other despite their structural similarities. Taken together, our findings suggest that these compounds exert neuroprotective effects in vitro and in vivo by restoring mitochondrial function through the specific interaction with TSPO in the presence of Aβ. We believe that these novel TSPO ligands can serve as a promising lead for further therapeutic development, and may provide an alternative strategy to the current treatment options for AD.
Supplemental Material
Download PDF (7.3 MB)Disclosure statement
No potential conflict of interest was reported by the author(s).
Additional information
Funding
References
- Anand R, Gill KD, Mahdi AA. Therapeutics of Alzheimer’s disease: past, present and future. Neuropharmacology 2014;76:27–50.
- Kumar A, Singh A. Ekavali. A review on Alzheimer’s disease pathophysiology and its management: an update. Pharmacol Rep 2015;67:195–203.
- Tanzi RE, Bertram L. Twenty years of the Alzheimer’s disease amyloid hypothesis: a genetic perspective. Cell 2005;120:545–55.
- LaFerla FM, Green KN, Oddo S. Intracellular amyloid-beta in Alzheimer’s disease. Nat Rev Neurosci 2007;8:499–509.
- Readnower RD, Sauerbeck AD, Sullivan PG. Mitochondria, amyloid beta, and Alzheimer’s disease. Int J Alzheimers Dis 2011;2011:1–5.
- Eckert GP, Renner K, Eckert SH, et al. Mitochondrial dysfunction-a pharmacological target in Alzheimer’s disease. Mol Neurobiol 2012;46:136–50.
- Santos RX, Correia SC, Wang X, et al. Alzheimer’s disease: diverse aspects of mitochondrial malfunctioning. Int J Clin Exp Pathol 2010;3:570–81.
- Moreira PI, Carvalho C, Zhu X, et al. Mitochondrial dysfunction is a trigger of Alzheimer’s disease pathophysiology. Biochim Biophys Acta 2010;1802:2–10.
- Chua SW, Kassiou M, Ittner LM. The translocator protein as a drug target in Alzheimer’s disease. Expert Rev Neurother 2014;14:439–48.
- Papadopoulos V, Baraldi M, Guilarte TR, et al. Translocator protein (18kda): new nomenclature for the peripheral-type benzodiazepine receptor based on its structure and molecular function. Trends Pharmacol Sci 2006;27:402–9.
- Veenman L, Gavish M. The role of 18 kda mitochondrial translocator protein (tspo) in programmed cell death, and effects of steroids on tspo expression. Curr Mol Med 2012;12:398–412.
- Leaver KR, Reynolds A, Bodard S, et al. Effects of translocator protein (18 kda) ligands on microglial activation and neuronal death in the quinolinic-acid-injected rat striatum. ACS Chem Neurosci 2012;3:114–9.
- Starkov AA, Beal FM. Portal to Alzheimer’s disease. Nat Med 2008;14:1020–1.
- Rupprecht R, Papadopoulos V, Rammes G, et al. Translocator protein (18 kda) (tspo) as a therapeutic target for neurological and psychiatric disorders. Nature Rev Drug Discov 2010;9:971–88.
- Du H, Guo L, Fang F, et al. Cyclophilin d deficiency attenuates mitochondrial and neuronal perturbation and ameliorates learning and memory in Alzheimer’s disease. Nat Med 2008;14:1097–105.
- Du H, Yan SS. Mitochondrial permeability transition pore in Alzheimer’s disease: cyclophilin d and amyloid beta. Biochim Biophys Acta 2010;1802:198–204.
- Chelli B, Falleni A, Salvetti F, et al. Peripheral-type benzodiazepine receptor ligands: mitochondrial permeability transition induction in rat cardiac tissue. Biochem Pharmacol 2001;61:695–705.
- Krestinina OV, Grachev DE, Odinokova IV, et al. Effect of peripheral benzodiazepine receptor (pbr/tspo) ligands on opening of ca2+-induced pore and phosphorylation of 3.5-kda polypeptide in rat brain mitochondria. Biochemistry (Mosc) 2009;74:421–9.
- Kim YS, Jung SH, Park BG, et al. Synthesis and evaluation of oxime derivatives as modulators for amyloid beta-induced mitochondrial dysfunction. Eur J Med Chem 2013;62:71–83.
- Barron AM, Garcia-Segura LM, Caruso D, et al. Ligand for translocator protein reverses pathology in a mouse model of Alzheimer’s disease. J Neurosci 2013;33:8891–7.
- Gatliff J, East D, Crosby J, et al. Tspo interacts with vdac1 and triggers a ROS-mediated inhibition of mitochondrial quality control. Autophagy 2014;10:2279–96.
- Werry EL, Bright FM, Piguet O, et al. Recent developments in tspo pet imaging as a biomarker of neuroinflammation in neurodegenerative disorders. Int J Mol Sci 2019;20:3161.
- Barresi E, Robello M, Costa B, et al. An update into the medicinal chemistry of translocator protein (tspo) ligands. Eur J Med Chem 2021;209:112924.
- Venneti S, Wang G, Wiley CA. The high affinity peripheral benzodiazepine receptor ligand daa1106 binds to activated and infected brain macrophages in areas of synaptic degeneration: implications for pet imaging of neuroinflammation in lentiviral encephalitis. Neurobiol Dis 2008;29:232–41.
- Chen MK, Guilarte TR. Translocator protein 18 kda (tspo): molecular sensor of brain injury and repair. Pharmacol Ther 2008;118:1–17.
- Li F, Liu J, Zheng Y, et al. Crystal structures of translocator protein (tspo) and mutant mimic of a human polymorphism. Science 2015;347:555–8.
- Guo YZ, Kalathur RC, Liu Q, et al. Protein structure. Structure and activity of tryptophan-rich TSPO proteins . Science 2015;347:551–5.
- Cho SM, Kim HV, Lee S, et al. Correlations of amyloid-β concentrations between CSF and plasma in acute Alzheimer mouse model. Sci Rep 2014;4:6777.
- Kozikowski AP, Ma D, Brewer J, et al. Chemistry, binding affinities, and behavioral properties of a new class of “antineophobic” mitochondrial dbi receptor complex (mdrc) ligands. J Med Chem 1993;36:2908–20.
- Trapani G, Laquintana V, Denora N, et al. Structure-activity relationships and effects on neuroactive steroid synthesis in a series of 2-phenylimidazo[1,2-a]pyridineacetamide peripheral benzodiazepine receptors ligands. J Med Chem 2005;48:292–305.
- Okuyama S, Chaki S, Yoshikawa R, et al. Neuropharmacological profile of peripheral benzodiazepine receptor agonists, daa1097 and daa1106. Life Sci 1999;64:1455–64.
- Das SK, Sikpi MO, Skolnick P. Characterization of [3h]ro5-4864 binding to “peripheral” benzodiazepine receptors in guinea pig alveolar type ii cells. Biochem Pharmacol 1987;36:2221–4.
- Rosenberg N, Rosenberg O, Weizman A, et al. In vitro mitochondrial effects of pk 11195, a synthetic translocator protein 18 kDa (TSPO) ligand, in human osteoblast-like cells. J Bioenerg Biomembr 2011;43:739–46.
- Adane L, Bharatam PV, Sharma V. A common feature-based 3d-pharmacophore model generation and virtual screening: identification of potential pfdhfr inhibitors. J Enzyme Inhib Med Chem 2010;25:635–45.
- Xing RJ, Wang J, Pan L, Cheng MS. A selective pharmacophore model for beta(2)-adrenoceptor agonists. Molecules 2009;14:4486–96.
- Kurz C, Ungerer I, Lipka U, et al. The metabolic enhancer piracetam ameliorates the impairment of mitochondrial function and neurite outgrowth induced by beta-amyloid peptide. Br J Pharmacol 2010;160:246–57.
- Halestrap AP, Pasdois P. The role of the mitochondrial permeability transition pore in heart disease. Biochim Biophys Acta 2009;1787:1402–15.
- Riedel G, Wetzel W, Reymann KG. Computer-assisted shock-reinforced y-maze training: a method for studying spatial alternation behaviour. Neuroreport 1994;5:2061–4.
- Oddo S, Caccamo A, Shepherd JD, et al. Triple-transgenic model of Alzheimer’s disease with plaques and tangles: intracellular Abeta and synaptic dysfunction. Neuron 2003;39:409–21.
- Fanselow MS, Poulos AM. The neuroscience of mammalian associative learning. Annu Rev Psychol 2005;56:207–34.
- Abaee MS, Cheraghi S. Efficient three-component gewald reactions under et3n/h2o conditions. J Sulfur Chem 2014;35:261–9.
- Kim S, Yi KY. 1, 1'-thiocarbonyldi-2, 2'-pyridone. A new useful reagent for functional group conversions under essentially neutral conditions. J Organic Chem 1986;51:2613–5.
- Shi Y, Sitkoff D, Zhang J, et al. Design, structure-activity relationships, x-ray crystal structure, and energetic contributions of a critical p1 pharmacophore: 3-chloroindole-7-yl-based factor xa inhibitors. J Med Chem 2008;51:7541–51.
- Ahmed EK. Synthesis of some new pyrido [4′, 3′: 4, 5] thieno [2, 3-d] pyrimidines and related fused heterocycles. Phosphorus Sulfur Silicon Relat Elem 2003;178:1–16.