
 ?Mathematical formulae have been encoded as MathML and are displayed in this HTML version using MathJax in order to improve their display. Uncheck the box to turn MathJax off. This feature requires Javascript. Click on a formula to zoom.
Abstract
We have studied the CO2 permeability of the erythrocyte membrane of the rat using a mass spectrometric method that employs 18 O-labelled CO2. The method yields, in addition, the intraerythrocytic carbonic anhydrase activity and the membrane HCO3− permeability. For normal rat erythrocytes, we find at 37 °C a CO2 permeability of 0.078 ± 0.015 cm/s, an intracellular carbonic anhydrase activity of 64,100, and a bicarbonate permeability of 2.1 × 10⁻³ cm/s. We studied whether the rat erythrocyte membrane possesses protein CO2 channels similar to the human red cell membrane by applying the potential CO2 channel inhibitors pCMBS, Dibac, phloretin, and DIDS. Phloretin and DIDS were able to reduce the CO2 permeability by up to 50%. Since these effects cannot be attributed to the lipid part of the membrane, we conclude that the rat erythrocyte membrane is equipped with protein CO2 channels that are responsible for at least 50% of its CO2 permeability.
Introduction
In 1998, Nakhoul et al. and Cooper and BoronCitation1,Citation2 have shown that the Xenopus oocyte membrane exhibits an increase in its permeability for CO2 upon the incorporation of aquaporin-1 (AQP1), and Forster et al.Citation3 demonstrated that the CO2 permeability of the human red cell membrane decreases drastically under the exposure to 4,4′-diisothiocyanato-stilbene-2.2′-disulfonate (DIDS), which they interpreted as a highly effective inhibitory action of DIDS upon an as yet unidentified protein CO2 channel in the erythrocyte membrane. Thereafter, Endeward and co-workers used human red cells deficient in AQP1 or in the Rhesus-associated glycoprotein (RhAG), to show that about 90% of the CO2 permeability of the human red cell membrane is due to these two proteins acting as CO2 channelsCitation4–6. They concluded that AQP1 and RhAG contribute about equally to this channel-mediated CO2 pathway. Analogous studies have not been reported so far for any other mammalian species.
The aim of the present study was to investigate whether red blood cells of the rat are similarly equipped with a gas channel-mediated CO2 pathway. We chose the rat because this animal is relatively easily accessible to physiological studies assessing the exchange of CO2 in vivo. We used the previously described mass spectrometric method to determine the CO2 permeability of rat red cells in suspensionCitation7,Citation8. The red cells were exposed to several potential gas channel inhibitors, especially DIDS, but also Bis(1,3-dibutylbarbituric acid)pentamethine oxonol, Dibac, to phloretin, and to Para-(chloromercuri)-benzenesulfonate, pCMBS. Two of these substances proved to be highly efficient inhibitors of the protein-mediated CO2 pathway across the red cell membrane of the rat. In addition, we report here the first estimates of the intraerythrocytic carbonic anhydrase activity under physiological conditions of 37 °C, pH 7.2, and a CO2 partial pressure of 40 mmHg.
Methods
Animals and blood samples
Blood samples were taken from 3 months old Lewis rats from the Central Animal Facility of the Hannover Medical School by tail venipuncture in accordance with local regulations for animal experimentationCitation9. The blood was spun down at 5000 g for 20 min, plasma removed and cells washed three times in 0.9% NaCl. Haematocrit, cell count, and haemoglobin concentration were determined by standard techniques. Mean corpuscular volume (MCV) was ∼63 fl, which is in agreement with previous reportsCitation10,Citation11. Rat erythrocyte surface area, which was needed in addition to mean corpuscular volume for calculation of PCO2 and PHCO3−, was estimated from an established relation between red cell area and volumeCitation12 to be 100 µm2. This may be compared to the published red cell surface areas published for mice and humans (90 µm2 or 147 µm2, respectivelyCitation13). Neither of the transport inhibitors specified below and acting on membrane CO2 permeability, namely phloretin and DIDS, had a significant effect on MCV after an exposure period of ∼5 min; all MCV values varied between 62 and 65 fl. No spherocytes were observed either in controls or with inhibitors, all red blood cells exhibited the regular biconcave shape.
Inhibitors
Any potential extracellular carbonic anhydrase activity resulting from red cell lysis that may occur during the mass spectrometric determination of PCO2 and PHCO3− was inhibited by the addition of the extracellular carbonic anhydrase inhibitor FC5-208A (2,4,6-trimethyl-1-(4-sulfamoyl-phenyl)-pyridinium perchlorate salt)Citation14 to the assay at a final concentration of 5·× 10−5 M. Thus, it was ensured that no extracellular carbonic activity was present during the mass spectrometric experiment with dilute red cell suspensions. Inhibition of channel-mediated membrane CO2 permeability was attempted by the following chemicals: DIDS (4,4′-diisothiocyanato-stilbene-2.2′-disulfonate; Sigma-Aldrich, Seelze, Germany), which has previously been shown by us to be an efficient inhibitor of human red cell PCO2 as well as PHCO3Citation3,Citation4,Citation5; DiBAC (bis(1,3-dibutylbarbituric acid)pentamethine oxonol; Invitrogen GmbH, Karlsruhe, Germany), which is an established inhibitor of the erythrocytic HCO3−–Cl− exchangerCitation15 but does not inhibit PCO2 in human red cellsCitation4; pCMBS (para-(chloromercuri)-benzenesulfonate; Toronto Research Chemicals, North York, Canada; C367750), an established inhibitor of the aquaporin-1 waterCitation16 and CO2Citation2,Citation5 channels; phloretin (Sigma-Aldrich, Merck KGaA, Darmstadt, Germany; P7912), which is known to inhibit red cell bicarbonate-chloride exchange besides the transport of several other substratesCitation17.
Determination of CO2 and HCO3− permeabilities
We have previously reported how the CO2 permeability of plasma membranes can be determined for red cells or other cells in suspension using a mass spectrometric methodCitation4,Citation5,Citation7,Citation8. In principle, cells are exposed to a solution of C18O16O/HC18O16O2− that is labelled with 18 O to a degree of 1%. In this solution, C18O16O and HC18O16O2− react with water or H+, thereby transferring by a defined probability the label 18 O from the CO2–HCO3− pool into the much larger pool of water. This reaction is slow, but inside red cells due to their high carbonic anhydrase activity becomes much faster. The exchange of 18 O from CO2–HCO3− into the water pool causes a decay of the species C18O16O (mass 46), and we observe this decay vs. time after the start of the exposure of the cells to the solution. In a first rapid phase, the carbonic anhydrase-containing cells rapidly take up C18O16O. The kinetics of this process depends on the permeability of the membrane to CO2 and on the speed of the intracellular conversion of CO2 to HCO3−, that is, on intracellular carbonic anhydrase activity. The rate of disappearance of C18O16O from the extracellular fluid is followed by a mass spectrometer equipped with a special inlet system for fluids as first described by Itada and ForsterCitation18.
Examples are shown in . From the time course of the rapid first phase of the disappearance of C18O16O (see ), the membrane permeability for CO2 can be calculated, if the intracellular carbonic anhydrase activity has been determined independentlyCitation7. After the first rapid phase of the mass spectrometric record, a slower phase follows (also seen in ), which is to a major extent determined by the transport HC18O16O2− across the membrane. Thus, this second phase allows one to determine membrane HCO3− permeabilityCitation7. For a complete review of the method seeCitation8.
Figure 1. Time course of the decay of 18 O in CO2 vs. time for rat red cells in the presence and absence of DIDS. Y-axis is log (107·(Δ[CO2*])), where Δ[CO2*] is the concentration of 18 O-labelled CO2 minus its final value at isotope equilibrium, in the unit 10−7 M. The Y-axis gives the logarithm of this value after it has been multiplied by 107. The curve shows three phases: (1) a pre-phase representing the slow uncatalysed decay of 18O-labelled CO2, (2) by adding, at the sharp bend in the curve, red cells into the measuring chamber the next phase is initiated, which we call the rapid first phase after addition of red cells and which is strongly dependent on PCO2, (3) a second slower phase follows, which is dependent on PHCO3−. During the mass spectrometric measurement of red cells an extracellular pH of 7.4 and a CO2 partial pressure of 40 mmHg prevail.
![Figure 1. Time course of the decay of 18 O in CO2 vs. time for rat red cells in the presence and absence of DIDS. Y-axis is log (107·(Δ[CO2*])), where Δ[CO2*] is the concentration of 18 O-labelled CO2 minus its final value at isotope equilibrium, in the unit 10−7 M. The Y-axis gives the logarithm of this value after it has been multiplied by 107. The curve shows three phases: (1) a pre-phase representing the slow uncatalysed decay of 18O-labelled CO2, (2) by adding, at the sharp bend in the curve, red cells into the measuring chamber the next phase is initiated, which we call the rapid first phase after addition of red cells and which is strongly dependent on PCO2, (3) a second slower phase follows, which is dependent on PHCO3−. During the mass spectrometric measurement of red cells an extracellular pH of 7.4 and a CO2 partial pressure of 40 mmHg prevail.](/cms/asset/a0afd25e-bef3-4894-818f-26fdc0e17dad/ienz_a_1952194_f0001_c.jpg)
To perform mass spectrometric measurements, a chamber with a volume of 2.2 ml was used that was attached to the high vacuum of the mass spectrometer via the previously published inlet systemCitation7. This chamber had a water jacket that kept the solutions at 37 °C and contained a magnetic stirrer mixing the content continuously. The solution in the chamber consisted of 110 mM NaCl, 20 mM HEPES and 25 mM NaHCO3 labelled with 18 O to the extent of 1%. pH was adjusted to 7.4 and monitored during the entire measurement with a pH electrode. The reaction was started by adding 10 µl of red cell suspension with a haematocrit of 5% into the reaction chamber. In all experiments 5·× 10−5 M FC5-208A was present. Red cell suspensions were incubated with this carbonic anhydrase inhibitor for 2–5 min before use in the mass spectrometer experiment. Likewise, if any of the above membrane transport inhibitors were used, they were incubated with red cells 2–5 min prior to the red cells’ addition into the mass spectrometer’s reaction chamber. For all inhibitors, it was ascertained that the same inhibitor concentration used for preincubation also existed in the bicarbonate buffer present in the reaction chamber. The same preincubation times for inhibitors have previously been used for human red cellsCitation4,Citation5. Carbonic anhydrase activity was measured in suitably diluted lysed red cells, which gives in a plot like that of a mono- rather than a biphasic responseCitation3. The inhibitor-free lysates had a pH of 7.2 and a Cl− concentration of 63 mM, mimicking the intraerythrocytic conditions. The acceleration factor describing the increase in slope caused by the addition of the lysate was used to calculate the intraerythrocyic carbonic anhydrase activity from (acceleration factor − 1) × dilution factorCitation3.
Results
Intraerythrocytic carbonic anhydrase activity
Intraerythrocytic carbonic anhydrase activity (Ai) was determined at pH 7.2 from mass spectrometry of lysed red cells. Activity was determined for the blood sample from each animal studied, and used to calculate PCO2 and PHCO3− from the data for this same blood’s red cells using the system of equations that describe the entire 18 O-exchange processCitation7. On average, Ai was 64,100 ± 6200 (SD; n = 31). Ai was defined as (acceleration factor − 1), where the acceleration factor is the factor by which the speed of CO2 hydration in the undiluted red cell interior was accelerated over the uncatalysed rate.
Membrane CO2 permeability
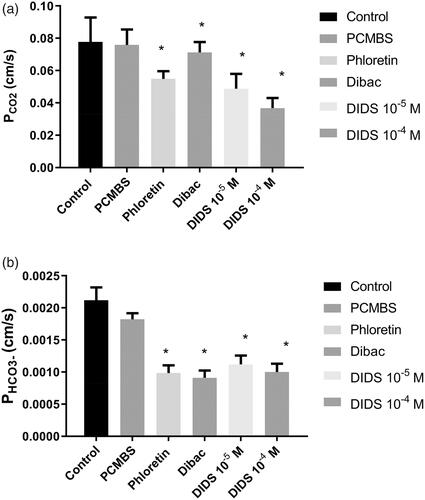
shows the results for PCO2 of the rat erythrocyte membrane at 37 °C. The control value in the absence of potential gas channel inhibitors is 0.078 ± 0.015 cm/s (SD; n = 36; left-hand column). The other columns of show the effect of various inhibitors on PCO2. 300 µM phloretin and DIDS at concentrations both of 10−5 and 10−4 M significantly reduce CO2 permeability. In the presence of 10−4 M DIDS, PCO2 amounts to 0.037 ± 0.006 cm/s (n = 10), that is, to about 1/2 of the control value. 1 mM pCMBS has no effect on PCO2, and 5·× 10−7 M Dibac, a rather specific inhibitor of the erythrocytic Cl−–HCO3− exchanger AE1Citation15, has a very minor, although statistically significant, effect on PCO2 (0.071 ± 0.006 cm/s; n = 8). In conclusion, two of the four inhibitors used reduce PCO2 to a major extent.
Figure 2. (a) CO2 permeability of rat red cells at 37 °C and effect of four inhibitors. Number of blood samples n from left to right: 36, 9, 8, 8, 10, 10. *Indicates statistical significance of difference to control (one-way ANOVA followed by Dunnett’s post-test). Inhibitor concentrations given are in mol/l. pCMBS was used at a concentration of 1 mM, phloretin at 300 µM, and Dibac at 5× 10⁻⁷ M. (b) HCO3− permeability of rat red cells at 37 °C and effect of four inhibitors. n from left to right: 36, 8, 8, 8, 10, 10. *Indicates statistical significance of difference to control (one-way ANOVA followed by Dunnett’s post-test). pCMBS was used at a concentration of 1 mM, phloretin at 300 µM, and Dibac at 5× 10⁻⁷ M.
Membrane HCO3− permeability
shows the effects of the same group of inhibitors on PHCO3−. The control value of PHCO3− amounts to 0.0021 ± 0.0002 cm/s (n = 36; left-hand column). 1 mM pCMBS has again no significant effect, but all other inhibitors including Dibac have major and statistically significant effects. With 5·× 10−7 M Dibac, PHCO3− is reduced to 0.00091 ± 0.00011 cm/s (n = 8), that is, to less than 1/2 of the control value.
Discussion
Red cell carbonic anhydrase activity in rats
We report here an intraerythrocytic carbonic anhydrase activity of 64,100, which may be compared with the value of 21,000 we obtained for human red cells with the same method under identical conditionsCitation4. Thus, rat red cells have a 3 times higher Ai compared to human red cells. While the absolute numbers of these activities cannot be compared with the results obtained by Larimer and Schmidt-NielsenCitation19 due to highly different methods and conditions, it may be noted that these authors similarly found a 2.5 times higher Ai in rats compared to humans. In general, these authors observed a tendency of Ai to increase with decreasing body weight in mammals. The functional significance of the higher Ai values in smaller animals is not clear. Larimer and Schmidt-Nielsen speculated that the high carbonic anhydrase activity in small animals with their higher specific rate of oxygen consumption may improve oxygen release from red cells by an accelerated production of H+ from CO2, thus accelerating the contribution of the Bohr effect to O2 releaseCitation19. Their studies have been discussed and updated in a more recent reviewCitation20.
CO2 permeability of the red cell membrane
PCO2 value
We report here a PCO2 of red cells of the rat of 0.078 cm/s at 37 °C. This value is half of the value reported previously for human red cells, 0.15 cm/sCitation4,Citation5. It must be considered, on the other hand, that the surface-to-volume ratio of rat red cells is >10% greater than that of human red cells, and that the rat red cell thickness is estimated to be 10% less than that of human red cells, both factors accelerating the speed of uptake of gases by rat red cells. This may lead to a gas uptake kinetics that overall is similar in rat and human red cells. This corresponds to the similar lung capillary transit times that have been reported for both rats and humansCitation21,Citation22.
Effects of inhibitors and role of CO2 channels
None of the potential gas channel inhibitors studied here is expected to have an effect on the CO2 permeability of the pure phospholipid bilayer. It has been shown that DIDS has no effect on PCO2 of pure phospholipid vesicles and cell membranes without gas channelsCitation23,Citation24, but lowers PCO2 in both types of membranes when gas channels are presentCitation4,Citation5,Citation23,Citation25. Similarly, it has been shown that pCMBS does not affect the PCO2 of membranes in the absence of gas channels, but it does reduce PCO2 when the gas channel aquaporin 1 is presentCitation2,Citation5. No such direct evidence is available for Dibac and phloretin, but there is overwhelming evidence in the literature that these inhibitors suppress specifically the transport activity of the anion exchanger AE1 (DibacCitation15) or affect a wide range of transport proteins (phloretinCitation17), respectively, but not the phospholipid membrane per se. We conclude that both DIDS and phloretin reduce membrane PCO2 by acting on a protein CO2 channel present in the membrane of rat erythrocytes. The maximal inhibition of PCO2 achieved here amounts to 50% of the control PCO2. This suggests that at least 50% of the PCO2 of rat red cells is due to a gas channel. This is a little less than has been reported for normal human red cells, where PCO2 fell by DIDS to about 1/3 of the control valueCitation5,Citation6.
Our previous work has shown that Dibac does not affect PCO2 in human erythrocytes, although it drastically reduces PHCO3Citation4. This is not unexpected as Dibac is a highly specific inhibitor of AE1Citation15. Both findings are thus in line with the present observation of no major inhibition of PCO2 in rat erythrocytes by Dibac. However, we find here also no effect of pCMBS on the PCO2 of rat red cells, while previously we found a moderate suppressive effect of 1 mM pCMBS on PCO2 of human red cells. Importantly, this effect was substantially less pronounced than the effect of DIDSCitation5. It may be noted that neither DIDS nor pCMBS permeate the red cell membrane and thus cannot affect intraerythrocytic carbonic anhydraseCitation4,Citation5.
A reasonable hypothesis to explain these observations comes from the following considerations:
In human red cells, there are two major CO2 channels, AQP1 and RhAG, that contribute about equally to the CO2 permeability of the membrane and together are responsible for about 90% of the total CO2 permeabilityCitation4,Citation5.
It is clear that DIDS inhibits quite effectively both AQP1 and RhAG CO2 channels, perhaps RhAG even a little more markedly than AQP1Citation6.
pCMBS inhibits PCO2 of human red cells clearly less than does DIDS, and this inhibitory effect seems to be exclusively due to AQP1, because in AQP1-deficient human red cells, whose only CO2 channel is RhAG, an effect of pCMBS is not detectableCitation5.
According to molecular dynamics studies, the central pore of the aquaporin 1 tetramer is the major pathway of CO2 across aquaporin 1, and the water channel of the aquaporin 1 monomer is a minor CO2 pathwayCitation26,Citation27.
Thus, it seems likely that the inhibitory effect of pCMBS we see on PCO2 of human red cells is mainly due to inhibition of the water (and CO2) channel of monomeric AQP1. It is well known that pCMBS, by acting on this pathway, largely blocks its water as well as its CO2 permeability via binding to a cysteine in position 189 in the water poreCitation2,Citation28,Citation29. pCMBS does not act on the RhAG CO2 pathway and likely does not act on the central pore of the aquaporin tetramer. It is probable that the properties of human AQP1 discussed under C) to E) apply analogously to rat AQP1.
In rat erythrocytes it is well established that AQP1 as well as RhAG are present in the membraneCitation30–32. Unfortunately, to our knowledge there is no quantitative information on the abundance of AQP1 and RhAG expression in rat red cells.
Overall we draw the following conclusions:
Rat, as well as human red cells, express CO2 channels in their membrane, which constitute a sizable part of the membrane CO2 permeability. These channels can very effectively be inhibited by DIDS and also, to a lesser extent, by phloretin. The effect of DIDS is qualitatively compatible with results obtained for human red cells, suggesting that AQP1 and RhAG represent the CO2 channels of rat erythrocytes. Likewise, the effect of phloretin reported here is similar to that observed in human red cells (own unpublished observations).
However, the fact that the effect of DIDS on PCO2 is smaller in comparison to human red cells, suggests that the role of CO2 channels in the rat may be somewhat less pronounced than it is in human red cells.
This would be in agreement with the present observation of a lack of an effect of pCMBS on PCO2, which might indicate that it is AQP1, which is expressed to a lesser degree in rat erythrocytes. However, conclusive evidence on this last point is lacking. An alternative explanation might a lower cholesterol content of the rat erythrocyte membrane, which would increase the membrane’s intrinsic permeability to CO2Citation23 and thus render the effect of CO2 channels less visible. However, the cholesterol content of the rat erythrocyte membrane has not been reported, and also, the CO2 permeabilities seen here for rat red cells are lower than those for human red cells.
Instead, the lower PCO2 of rat red cells might – at least partially – be caused by the reduced role of CO2 channels in rats compared to human erythrocytes.
HCO3− permeability of the red cell membrane
Applying the present mass spectrometric technique, we have previously reported the bicarbonate permeability of normal human red blood cells to be 1.2–1.3 × 10⁻³ cm/s at 37 °CCitation4–6. The present control value for rat red cells is 2.1 × 10⁻³ cm/s at the same temperature. This may be surprising in the view of the PCO2 that is lower for rat red cells than it is for human red cells (see above). It may be considered that in the case of HCO3− uptake or release, the membrane constitutes the major diffusion resistance since PHCO3− is almost 50 times lower than PCO2, and since the intracellular diffusion of HCO3− in comparison is much faster (albeit almost equally fast as the intracellular diffusion of CO2). If then the product of P x cellular surface area is decisive for the kinetics of HCO3−, we would, with the numbers given byCitation13 and above, obtain products of 1.25 × 10⁻³ cm/s × 146 µm2 for humans and of 2.1 × 10⁻³ cm/s × 100 µm2 for rats, respectively. In other words, these products agree within about 15%, and, as in the case of CO2 uptake kinetics, we thus expect similar kinetics of HCO3− exchange in both rat and human red cells. The inhibitory profile of PHCO3− seen in with strong effects of Dibac, phloretin and DIDS is as expected from the literature, as detailed in the Methods section.
Outlook
We present clear evidence that the red cell membrane of the rat possesses protein channels for CO2, which can effectively be inhibited by DIDS and by phloretin. In studies on the role of gas channels for red cell CO2 exchange, the difficulty may arise that both these inhibitors inhibit CO2 permeation as well as HCO3− permeation. Both these processes contribute to overall CO2 exchange, although with quite different kinetics. This problem can, at least in vitro, be solved by complementing studies with DIDS or phloretin with experiments using Dibac, which very efficiently inhibits PHCO3− without affecting PCO2. This should allow one to dissect the effects from inhibition of PCO2 from those resulting from inhibition of PHCO3−.
Acknowledgement
We are indebted to Frau S. Klebba-Färber for expert technical assistance.
Disclosure statement
No potential conflict of interest was reported by the author(s).
Additional information
Funding
References
- Nakhoul NL, Davis BA, Romero M, Boron W. Effect of expressing the water channel aquaporin-1 on the CO2 permeability of Xenopus oocytes. Am J Physiol 1998;274:C543–8.
- Cooper GJ, Boron WF. Effect of PCMBS on CO2 permeability of xenopus oocytes expressing aquaporin 1 or its C189S mutant. Am J Physiol - Cell Physiol 1998;275:1481–6.
- Forster RE, Gros G, Lin L, et al. The effect of 4,4'-diisothiocyanato-stilbene-2,2'-disulfonate on CO2 permeability of the red blood cell membrane. Proc Natl Acad Sci USA 1998;95:15815–20.
- Endeward V, Cartron JP, Ripoche P, Gros G. RhAG protein of the Rhesus complex is a CO2 channel in the human red cell membrane. FASEB J 2008;22:64–73.
- Endeward V, Musa-Aziz R, Cooper GJ, et al. Evidence that aquaporin 1 is a major pathway for CO2 transport across the human erythrocyte membrane. FASEB J 2006;20:1974–81.
- Endeward V, Cartron JP, Ripoche P, Gros G. Red cell membrane CO2 permeability in normal human blood and in blood deficient in various blood groups, and effect of DIDS. Transfus Clin Biol 2006;13:123–7.
- Endeward V, Gros G. Low carbon dioxide permeability of the apical epithelial membrane of guinea-pig colon. J Physiol 2005;567:253–65.
- Endeward V, Al-Samir S, Itel F, Gros G. How does carbon dioxide permeate cell membranes? A discussion of concepts, results and methods. Front Physiol 2014;4:1–21.
- Omaye ST, Skala JH, Gretz MD, et al. Simple method for bleeding the unanaesthetized rat by tail venipuncture. Lab Anim 1987;21:261–4.
- Chen D, Kaul D. Rheologic and hemodynamic characteristics of red cells of mouse, rat and human. Biorheology 1994;31:103–13.
- Hill NS, Sardella GL, Ou LC. Reticulocytosis, increased mean red cell volume, and greater blood viscosity in altitude susceptible compared to altitude resistant rats. Respir Physiol 1987;70:229–40.
- Canham PB, Burton AC. Distribution of size and shape in populations of normal human red cells. Circ Res 1968;22:405–22.
- Engström K, Täljedal I-B. Altered shape and size of red blood cells in obese hyperglycaemic mice. Acta Physiol Scand 1987;130:535–43.
- Perut F, Carta F, Bonuccelli G, et al. Carbonic anhydrase IX inhibition is an effective strategy for osteosarcoma treatment. Expert Opin Ther Targets 2015;19:1593–605.
- Knauf PA, Law FY, Hahn K. An oxonol dye is the most potent known inhibitor of band 3-mediated anion exchange. Am J Physiol - Cell Physiol 1995;269:7485448.
- Mathai JC, Mori S, Smith BL, et al. Functional analysis of aquaporin-1 deficient red cells. The Colton-null phenotype. J Biol Chem 1996;271:1309–13.
- Fuhrmann GF, Dernedde S, Frenking G. Phloretin keto-enol tautomerism and inhibition of glucose transport in human erythrocytes (including effects of phloretin on anion transport). BBA - Biomembr 1992;1110:105–11.
- Itada N, Forster RE. Carbonic anhydrase activity in intact red blood cells measured with 18O exchange. J Biol Chem 1977;252:3881–90.
- Larimer JLJ, Schmidt-Nielsen K. A comparison of blood carbonic anhydrase of various mammals. Comp Biochem Physiol 1960;1:19–23.
- Gilmour KM. Perspectives on carbonic anhydrase. Comp Biochem Physiol A Mol Integr Physiol 2010;157:193–7.
- Hogg JC, Coxson HO, Brumwell ML, et al. Erythrocyte and polymorphonuclear cell transit time and concentration in human pulmonary capillaries. J Appl Physiol 1994;77:1795–800.
- Presson RG, Todoran TM, De Witt BJ, et al. Capillary recruitment and transit time in the rat lung. J Appl Physiol 1997;83:543–9.
- Itel F, Al-Samir S, Öberg F, et al. CO2 permeability of cell membranes is regulated by membrane cholesterol and protein gas channels. FASEB J 2012;26:5182–91.
- Arias-Hidalgo M, Al-Samir S, Weber N, et al. CO2 permeability and carbonic anhydrase activity of rat cardiomyocytes. Acta Physiol 2017;221:115–28.
- Arias-Hidalgo M, Hegermann J, Tsiavaliaris G, et al. CO2 and HCO3− permeability of the rat liver mitochondrial membrane. Cell Physiol Biochem 2016;39:2014–24.
- Hub JS, De Groot BL. Does CO2 permeate through aquaporin-1? Biophys J 2006;91:842–8.
- Wang Y, Cohen J, Boron WF, et al. Exploring gas permeability of cellular membranes and membrane channels with molecular dynamics. J Struct Biol 2007;157:534–44.
- Preston GM, Carroll TP, Guggino WB, Agre P. Appearance of water channels in Xenopus oocytes expressing red cell CHIP28 protein. Science 1992;256:385–7.
- Preston GM, Jung JS, Guggino WB, Agre P. The mercury-sensitive residue at cysteine 189 in the CHIP28 water channel. J Biol Chem 1993;268:17–20.
- Kitano T, Sumiyama K, Shiroishi T, Saitou N. Conserved evolution of the Rh50 gene compared to its homologous Rh blood group gene. Biochem Biophys Res Commun 1998;249:78–85.
- Kitano T, Saitou N. Evolutionary history of the Rh blood group-related genes in vertebrates. Immunogenetics 2000;51:856–62.
- Esteva-Font C, Jin BJ, Lee S, et al. Experimental evaluation of proposed small-molecule inhibitors of water channel aquaporin-1. Mol Pharmacol 2016;89:686–93.