
 ?Mathematical formulae have been encoded as MathML and are displayed in this HTML version using MathJax in order to improve their display. Uncheck the box to turn MathJax off. This feature requires Javascript. Click on a formula to zoom.
Abstract
The synthesis of carborane-1,8-naphthalimide conjugates and evaluation of their DNA-binding ability and anticancer activity were performed. A series of 4-carboranyl-3-nitro-1,8-naphthalimide derivatives, mitonafide and pinafide analogs, were synthesised via amidation and reductive amination reactions, and their calf thymus DNA (ct-DNA)-binding properties were investigated using circular dichroism, UV–vis spectroscopy, and thermal denaturation. Results showed that conjugates 34–37 interacted very strongly with ct-DNA (ΔTm = 10.00–13.00 °C), indicating their ability to intercalate with DNA, but did not inhibit the activity of topoisomerase II. The conjugates inhibited the cell growth of the HepG2 cancer cell line in vitro. The same compounds caused the G2M phase arrest. Cell lines treated with these conjugates showed an increase in reactive oxygen species, glutathione, and Fe2+ levels, lipid peroxidation, and mitochondrial membrane potential relative to controls, indicating the involvement of ferroptosis. Furthermore, these conjugates caused lysosomal membrane permeabilization in HepG2 cells but not in MRC-5 cells.
Introduction
1,8-Naphthalimides are a class of polycyclic imides consisting of π-deficient flat aromatic or heteroaromatic ring systems. The majority of the 1,8-naphthalimides exhibit a wide range of biological properties such as anticancer, antibacterial, and antiviral activitiesCitation1. This group of compounds and their derivatives are primarily considered as DNA intercalators, and their high antitumor activity and ability to suppress tumour growth and metastasis are usually attributed to their potential to interact with DNACitation2,Citation3. However, 1,8-naphthalimide derivatives demonstrate anticancer activities in several other ways such as induction of reactive oxygen species (ROS), malfunction of lysosome and mitochondria, and so onCitation4–6. They have also been reported to inhibit topoisomerases (Topo I and Topo II)Citation7,Citation8. The structure–activity relationships of 1,8-naphthalimides with different modulations at various positions of the ring were earlier summarised by Tomczyk et alCitation9. and, more recently, by Tandon et alCitation10.
In our previous studies, the methods used to synthesise 1,8-naphthalimides modified with a carborane group or mitonafide and pinafide analogs, through modification of imideCitation11, bearing the carborane group at position 3Citation12 or 4 of the ringCitation13, have been discussed (). It was observed that the attachment site of carborane to the 1,8-naphthalimide moiety and the structure of the linker between the carborane cluster and the heteroaromatic ring system are the factors influencing various physicochemical (interaction with DNA) and biological (cytotoxicity, cell death, cell cycle, ROS production) properties of a HepG2 cancer cell line. Surprisingly, conjugates that interact most strongly with DNA were not as effective as Topo II inhibitors.
Figure 1. Structures of mitonafide, pinafide, and 1,8-naphthalimides modified with 1,2-dicarba-closo-dodecaborane or 1,7-dicarba-closo-dodecaboraneCitation14–16.
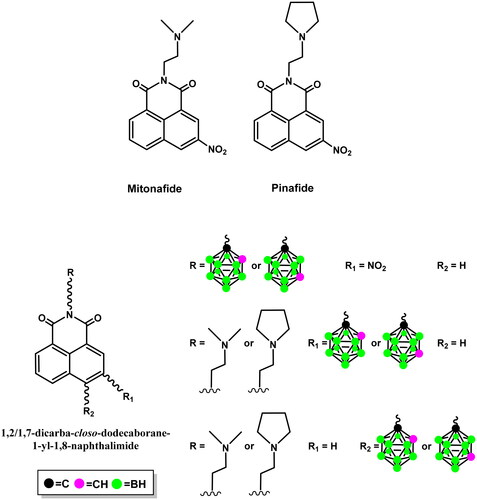
Several studies have reviewed the application of carboranes (isomers of dicarba-closo-dodecaborane) in medicinal chemistry, describing their derivatives as carriers for boron neutron capture therapy and as unique three-dimensional pharmacophores or modulators, thus indicating that carboranes are still an emerging class of compounds. Due to the distinct physical and chemical properties of carboranes, their derivatives with better or new anticancer, antibacterial, antiviral, and nematicidal activities, among others, have been designedCitation14–23. The properties that are critical for the application of carboranes in medicinal chemistry are as follows: their ability to form unique noncovalent interactions with biological targets; spherical or ellipsoidal geometry and rigid 3 D arrangement to build 3 D constructions; lipophilicity, amphiphilicity, or hydrophilicity (depending on the type of the boron cluster used); adjustable pharmacokinetics, bioavailability, bio-orthogonality, and stability in biological environments; and a decreased susceptibility to metabolismCitation14,Citation15.
In this paper, based on the properties of carborane clusters useful in medicinal chemistry and the physicochemical and biological properties of carborane-1,8-naphthalimide conjugates we have described so far, a method for synthesising 1,8-naphthalimide derivatives, analogs of mitonafide and pinafide, modified with ortho-carborane (1,2-dicarba-closo-dodecaborane) or meta-carborane (1,7-dicarba-closo-dodecaborane) at position 4 and a nitro group at position 3 of the heteroaromatic skeleton is described, and their interaction with calf-thymus DNA (ct-DNA) and anticancer activity is discussed.
Results and discussion
Chemistry
Synthesis of mitonafide and pinafide analogs containing carborane clusters
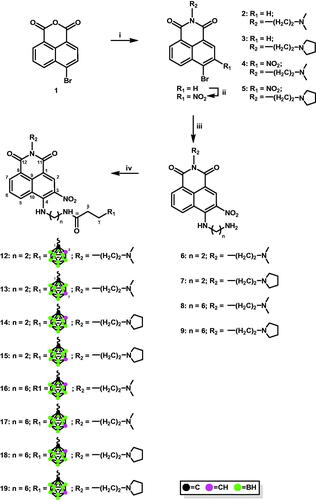
Appropriate carborane cluster acceptors 6–9 were obtained by the reaction of 4-bromo-N-[2-(dimethylamino)ethyl]-3-nitro-1,8-naphthalimide (4) or 4-bromo-3-nitro-N-[2-(N-pyrrolidinyl)ethyl]-1,8-naphthalimide (5) with ethane-1,2-diamine or hexane-1,6-diamine in absolute EtOH (Scheme 1). The products obtained were purified using column chromatography, and their structure was confirmed using 1H-NMR (Figures S1–S5, Electronic Supporting Information (ESI)).
Scheme 1. Modification of 4-carboranyl-3-nitro-1,8-naphthalimide derivatives with ortho-/meta-carborane via the formation of the amide bond. i. N,N-dimethylethylenediamine, EtOHabs, 2 h, 45 °C (for 2); N-(2-aminoethyl)pyrrolidine, EtOHabs, 2 h, 45 °C (for 3); ii. NaNO3, H2SO4conc, 1 h at 0 °C, 3 h at rt; iii. ethane-1,2-diamine, EtOHabs, 2 h, reflux (for 6 and 7); hexane-1,6-diamine, EtOHabs, 2 h, reflux (for 8 and 9); iv. 3–(1,2-dicarba-closo-dodecaboran-1-yl)propionic acid (10), PyBOP, TEAanh, CH2Cl2anh, 2–5 h, rt (for 12, 14, 16, and 18); 3–(1,7-dicarba-closo-dodecaboran-1-yl)propionic acid (11), PyBOP, TEAanh, CH2Cl2anh, 2–5 h, rt (for 13, 15, 17, and 19).
DNA intercalators and Topo II poisons share three common essential structural features. The first one is a planar polyaromatic system (chromophore) which is sandwiched between DNA base-pairs. The second feature is a cationic species, interacting with the negatively charged phosphate group of DNA. The cationic centre may be an amino or nitrogen containing heterocyclic group, which can be protonated at physiological pH. The third feature is a groove binding side chain moiety, occupying the minor groove of DNACitation24–26.
Our previously synthesised 4-carboranyl-1,8-naphthalimides, mitonafide and pinafide analogs, with an amine linker between the carborane group and the naphthalimide moiety, were found to interact strongly with DNA, which indicated an intercalative binding mode. The same compounds were the most cytotoxic against HepG2 cells among all the modified conjugated tested.Citation13 In the current work, these compounds were selected to be lead structures in the synthesis of new derivatives. Furthermore, studies revealed that specific substituent types on the naphthalic ring also might increased the cytotoxicity; e.g., 3-amino-, 3-nitro-, 3-methoxy groups gave the best resultsCitation9.
1,8-Naphthalimide derivatives, mitonafide and pinafide analogs, containing a carborane cluster at position 4 and a nitro group at position 3 of the heteroaromatic skeleton described in this study (compounds 12–19 and 30–37, Schemes 1 and 2) were synthesised via (1) amidation reaction (Scheme 1 and 2) reductive amination (Scheme 2).
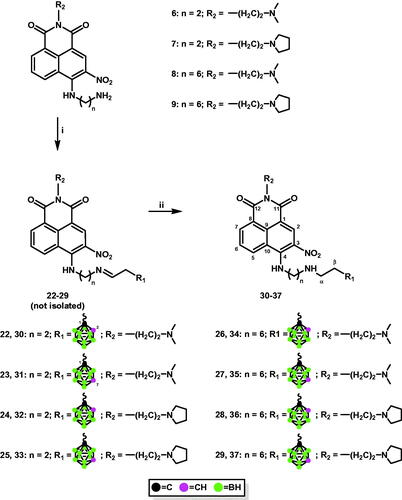
Scheme 2. Synthesis of conjugates 30–37 via reductive amination. i. 2–(1,2-dicarba-closo-dodecaboran-1-yl)ethanal (20), MeOHanh, 24 h, 70 °C (for 22, 24, 26, and 28); 2–(1,7-dicarba-closo-dodecaboran-1-yl)ethanal (21), MeOHanh, 24 h, 70 °C (for 23, 25, 27, and 29); ii. NaBH3CN, 24 h, rt.
The formation of amide bonds is an immanent feature in organic and synthetic medicinal chemistry. Amides are the central building blocks in a number of interesting pharmaceuticals, proteins, peptides, polymers, natural products, functional materials, and biologically relevant carbocyclic or heterocyclic molecules and are also used in many industriesCitation27. In the present study, methods for synthesising 4-carboranyl-3-nitro-1,8-naphthalimide derivatives bearing ortho-/meta-carborane clusters 12–19 were developed based on the formation of an amide bond between naphthalimide and carborane using appropriate acids containing a carborane cluster as carborane cluster donors (Scheme 1). Briefly, 4-[(2-aminoethyl)amino]-N-[2-(dimethylamino)ethyl]-3-nitro-1,8-naphthalimide (6) or 4-[(2-aminoethyl)amino]-3-nitro-N-[2-(N-pyrrolidinyl)ethyl]-1,8-naphthalimide (7) or 4-[(6-aminohexyl)amino]-N-[2-(dimethylamino)ethyl]-3-nitro-1,8-naphthalimide (8), and 4-[(6-aminohexyl)amino]-3-nitro-N-[2-(N-pyrrolidinyl)ethyl]-1,8-naphthalimide (9) with 3–(1,2-dicarba-closo-dodecaboran-1-yl)propionic acid (10)Citation28 or 3–(1,7-dicarba-closo-dodecaboran-1-yl)propionic acid (11)Citation29 were dissolved in anhydrous CH2Cl2, and then anhydrous benzotriazol-1-yl-oxytripyrrolidinophosphonium hexafluorophosphate (PyBOP) and triethylamine (TEA) were added to the solution. Upon completion of the reaction, the crude products were purified using column silica gel chromatography (twice for compounds 16, 18, and 19), following which conjugates 12–19 were obtained as orange solid in a moderate or good yield (32–73%). The structure, purity, and homogeneity of these compounds were confirmed using 1H-NMR, 13C-NMR, 11B-NMR, FT-IR, MS, RP-HPLC (Figures S6–S61, ESI), and TLC. 3-Carboranyl-1,8-naphthalimide derivatives were synthesised with good yields using the same methodologyCitation12, whereas 4-carboranyl-1,8-naphthalimide derivativesCitation13 were synthesised using appropriate active esters bearing carborane clustersCitation16. The methodology using active esters was unsuccessful for the synthesis of 12–19. After 24 h, the desired product was not obtained.
Reductive amination is one of the key approaches to C–N bond construction because of its operational easiness and a wide-ranging toolbox of protocols. Recent studies have shown that at least one-fourth of C–N-bond-forming reactions in the pharmaceutical industry are performed via reductive aminationCitation30.
Treatment of 4-[(2-aminoethyl)amino]-N-[2-(dimethylamino)ethyl]-3-nitro-1,8-naphthalimide (6) or 4-[(2-aminoethyl)amino]-3-nitro-N-[2-(N-pyrrolidinyl)ethyl]-1,8-naphthalimide (7) or 4-[(6-aminohexyl)amino]-N-[2-(dimethylamino)ethyl]-3-nitro-1,8-naphthalimide (8), and 4-[(6-aminohexyl)amino]-3-nitro-N-[2-(N-pyrrolidinyl)ethyl]-1,8-naphthalimide (9) with aldehydes containing ortho-carborane (20) or meta-carborane (21)Citation31 in MeOH at 70 °C for 24 h under an inert (Ar) atmosphere yielded the corresponding Schiff bases 22–29. However, due to their instability, the resulting compounds could not be isolated (Scheme 2).
Conjugates 30–37 were synthesised by treating Schiff bases 22–29 with NaBH3CN followed by column chromatography. The structure, purity, and homogeneity of these compounds were confirmed using 1H-NMR, 13C-NMR, 11B-NMR, FT-IR, MS, RP-HPLC (Figures S62–S121, ESI), and TLC.
X-Ray structural analysis
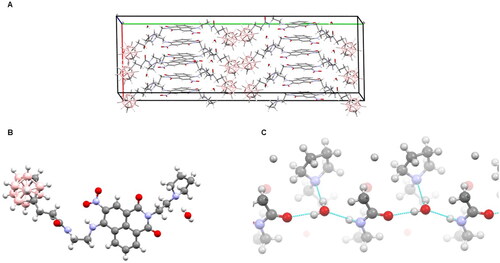
The crystal structure showed three molecules of 15 and three water molecules in the asymmetric unit, with similar structures and zipper-like arrangement. The 1,8-naphthalimide ring systems stacked extensively, in the antiparallel fashion, whereas the carborane clusters formed separate zones (). Intramolecular hydrogen bonding between the nitro group and the amine group adjacent to the naphthalene rings was observed. The bond stabilised the two groups to be nearly coplanar with the ring system. Clearly defined water molecules formed a network of hydrogen bonds, each water molecule linking three neighbouring 15 molecules via (1) the carbonyl oxygen atom of the amide group of one molecule, (2) the amine group of the amide of another molecule, and (3) the nitrogen atom of the pyrrole group of a third molecule (). The arrays of amide groups were oriented in the same direction, resulting in a clear electrostatic polarity for the crystal lattice.
Figure 2. Crystallographic structure of 15: (A) crystal packing within the unit cell, showing the distinct zones of rings stacking and carborane clustering. (B) A view of a single 15 molecule with an associated water molecule. (C) Some polar groups of 15 together with water molecules form an intermolecular hydrogen bond network; each water molecule links three neighbouring 15 molecules. Oxygen atoms are drawn red, nitrogen blue, carbon grey, boron pale pink, hydrogen white.
Physicochemical investigation with DNA
Melting temperature measurements
Small molecules can disturb the natural structure and dynamics of nucleic acids, and thus, they have potential applications in cancer therapeutics.
Melting temperature (Tm) of DNA is defined as the temperature where half of the DNA population is melted—one half of the DNA is in the double-helical state and the other half is in a random coiled stateCitation32. An increase in the temperature transforms the double-stranded DNA into single strands by disrupting the hydrogen bonds between base pairsCitation33. Tm depends on the length and sequence of the DNA. The majority of the DNA-binding small molecules known so far stabilise duplex DNA against heat denaturation. 1,8-Naphthalimides are valuable anticancer agents that stack between the DNA bases and exhibit stabilising effects depending on the substituent attached to the naphthalimide, the position of the substituent, and the sequence of DNA. In some cases, the 4-substituents have exhibited different trends than the 3-substituentsCitation34.
In the present study, Tm was measured to estimate the impact of the obtained compounds 12–19 and 30–37 on DNA stabilisation (, and Figures S122–S125, ESI).
Table 1. ΔTm and binding constant (Kb) based on UV–vis of ct-DNA in the presence of 1,8-naphthalimide–carborane conjugates.
Thermal melting experiments indicated that the studied conjugates obtained via the amidation reaction (12–19) showed weaker DNA stabilisation compared with the conjugates synthesised via reductive amination (30–37). In the first group of compounds, 18 and 19 destabilised ct-DNA, whereas 12–15 stabilised ct-DNA with ΔTm values = 3.33–5.00 °C. Conjugates 16 and 17 showed no effect on the tested DNA. In the second group of compounds, all conjugates stabilised ct-DNA, although derivatives 30–33 with a shorter linker between carborane modification and the 1,8-naphthalimide residue stabilised ct-DNA more weakly than compounds 34–37 with a (CH2)6 linker. The thermal denaturation experiment conducted for ct-DNA in the absence of the modified 1,8-naphthalimide revealed a Tm value of 74 °C. In contrast, in the presence of 34–37, the Tm of ct-DNA significantly increased within the range of values 84–87 °C (ΔTm = 10.00–13.00 °C, ) with derivatives 35 and 37 bearing meta-carborane showing the highest value. In comparison with unmodified mitonafide and pinafide (ΔTm = 5.17 and 6.50 °C, respectively)Citation12, this may indicate an intercalative interaction with DNA as the dominant binding mode. In addition, conjugates 35 and 37 stabilised ct-DNA most strongly among all 1,8-naphthalimides containing carborane clusters obtained in our laboratoryCitation12,Citation13: the ΔTm values of selected 4-carboranyl-1,8-naphthalimides increased within the range of 81.67–86.33 °C (ΔTm = 7.67–12.33 °C), also suggesting their intercalation with DNACitation13.
Circular dichroism (CD) spectra measurements
For an in-depth understanding of the interactions of the modified 1,8-naphthalimides 12–19 and 30–37 with DNA, CD measurements were conducted. The characteristic right-handed B-form CD spectra of the DNA in the 200–300 nm region can provide information relevant to the structural change of the DNA on interaction with ligands. The CD spectra of free DNA exhibited a negative peak around 245 nm due to helicity and a positive peak around 270 nm due to base stackingCitation35. As described earlier, treatment of the DNA with mitonafide and pinafide caused a decrease in the negative peak and an increase in the positive peakCitation12. As illustrated in Figures S126, S128-S131 (ESI), an increase in the concentration of conjugates bearing a carborane cluster 12, 13, 16–19, 31 and 33 did not cause any appreciable change in the CD spectra of ct-DNA. In the presence of conjugates 14, 15, 30, 32, and 36, the positive and negative bands of ct-DNA were disturbed (Figures S127, S130, S131, and S133, ESI). Simple groove binding and electrostatic interaction of ligands caused less or no disturbance to the base-stacking and helicity bands, whereas the intensities of both positive and negative bands were affected in the intercalative mode of bindingCitation36. In contrast, CD spectra of ct-DNA were remarkably disturbed in the presence of conjugates 34, 35, and 37 (Figures S132 and S133, ESI), resulting in the increase and decrease in the positive and negative bands, respectively, without any shift in the band positions. Both effects are consistent with the intercalative properties of the compounds. No conformational change from the B-form structure of DNA was observed. The obtained data for those compounds are in good agreement with their melting curve results.
UV–vis spectra measurement
Similar to CD spectroscopy and thermal denaturation studies, UV–vis absorption spectroscopy is also one of the simplest and most commonly used techniques for studying the stability of DNA and its interactions with small ligand molecules. Drug–DNA interactions can be studied using UV–vis absorption spectroscopy by monitoring the changes in the absorption properties of the drug or the DNA. Whether there is any interaction between the DNA and the drug can therefore be easily examined by the shifting of the position of the maximum of this band when the ligand is free in the solution and when the ligand is bound with DNACitation37. Compounds binding with DNA through intercalation usually exhibit hypochromism and bathochromism. In the case of an electrostatic attraction between the compound and the DNA, a hyperchromic effect is observed, which reflects the corresponding changes of the DNA in its conformation and structure after the complex–DNA interaction has occurredCitation37.
The spectral changes observed in the electronic absorption of 12–19 and 30–37 in the absence and the presence of ct-DNA are illustrated in Figures S134–S148 (ESI). The progressive addition of ct-DNA at the concentration of 1.25–15 µM to a fixed amount of 1,8-naphthalimide (10 µM concentration) decreased the absorbance for almost all the tested modified conjugates, except for conjugate 33, for which changes in the absorbance were not observed. For conjugates 12–19, 30, and 32, a slight bathochromic effect (2–4 nm) was observed. In contrast, the bathochromic effect was observed for conjugates 31 (6 nm), 34 (9 nm), 35 (10 nm), 36 (7 nm), and 37 (8 nm). Hypochromicity was observed for 12–19, 30–32, and 34–37 (10–53%), with compound 13 showing the highest value.
To compare the DNA-binding strength of the tested conjugates, the binding constant Kb was calculated () as described in the Materials and Methods section. The Kb values of compounds 12, 14, 15, 17, 31, and 36 were similar to that of mitonafide (2.54 × 10⁵)Citation12. Derivatives 16, 18, 32, and 35 showed approximately 1.5-fold higher Kb values compared to that of mitonafide. The Kb value could not be determined for conjugate 33 due to the lack of noticeable changes in the UV spectra.
Biological Investigation
In vitro cytotoxic activity
The in vitro cytotoxic activity of the obtained carborane-1,8-naphthalimide conjugates was investigated by examining their cytotoxic effects using the MTT (3–(4,5-dimethylthiazol-2-yl)-2,5-diphenyltetrazolium bromide) dye assayCitation38,Citation39 against the human cancer cell line HepG2 established from hepatocellular carcinoma (for compounds 12–19 and 30–37) and against human lung fibroblasts (MRC-5) (for compounds 34–37). The IC50 values—the drug concentration (µM) required to inhibit cell growth by 50%—determined for the synthesised compounds are summarised in .
Table 2. Cellular cytotoxic activity of compounds 12–19 and 30–37.
Generally, mitonafide derivatives were less cytotoxic than the modified pinafide derivatives, and conjugates modified with meta-carboranes were less active than the corresponding conjugates modified with ortho-carborane. A comparison of the activity of the 1,8-naphthalimides in the series showed that the conjugates obtained via amidation reaction 12–19 were slightly less cytotoxic than the modified 1,8-naphthalimides obtained using the reductive amination reaction 30–37. Recently, we have reported that 4-carboranyl-1,8-naphthalimides synthesised using the reductive amination reaction were more cytotoxic against the HepG2 cell line than the conjugates obtained via the “click reaction,” Mitsunobu reaction, or amidation reactionCitation13. Among compounds 12–19 and 30–37, the conjugates containing a shorter linker (CH2)2 between the heteroaromatic system and carborane modification (12–15 and 30–33) were less cytotoxic than those containing a longer linker (CH2)6 between the heteroaromatic system and carborane (16–19 and 34–37). The highest cytotoxicity to the tested cell line was shown by the pinafide analog 36 containing ortho-carborane, at a concentration as low as 3.63 µM, whereas the pinafide analog 37 containing meta-carborane was less cytotoxic, with an IC50 value of 4.23 µM. The mitonafide analogs bearing ortho-carborane 34 (IC50 = 4.78 µM) or meta-carborane 35 (IC50 = 4.32 µM) were slightly less cytotoxic than their pinafide analogs. Furthermore, conjugates 34–37 were more active than the mitonafide and pinafide analogs also obtained through reductive amination but containing a carborane cluster at position 3 of the heteroaromatic system (IC50 = 4.77–53.09 µM)Citation12 and less active than 4-carboranyl-1,8-naphthalimide derivativesCitation13. The conjugates 34–37 were slightly more cytotoxic against the MRC-5 cell line (IC50 = 2.13–2.33 µM) than against HepG2.
Considering the physicochemical and cytotoxic properties of conjugates 34–37, they were used for further biological studies.
Apoptosis/necrosis assay by flow cytometry
Anticancer agents induce cancer cell death primarily through apoptosis or necrosis. As anticancer agents cause apoptosis and necrosis at low and high concentrations, respectively, cancer cells may merely be injured by an anticancer agent in apoptosis and their death may result from the activation of the internal constituents to induce apoptosisCitation38.
To investigate whether conjugates 34–37 induced apoptosis in HepG2 cells, the cells were incubated with the conjugates for 24 h, and a flow cytometry analysis was carried out. The concentration corresponding to the half and total IC50 values was chosen for each compound (34–2.5; 5 µM, 35–2.3; 4.5 µM, 36–2; 4 µM; 37–2.3; 4.5 µM). After incubation, the cells were stained by YO-PRO1/PI dual staining. All the studied compounds induced early apoptosis in HepG2 after 24-h treatment; however, the rate of this type of cell death was not the prominent one (, Figure S149, ESI). The highest percentage of early apoptotic cells was observed in HepG2 cells treated with compounds 36 and 37 (12.55 and 12.56%, respectively). Compounds 34 and 35 caused apoptotic changes only in 9.12 and 6.7% of cells. This suggests that apoptosis is not the dominant cell death process, while the most significant fluorescent signal was observed from necrotic cells (PI positive). The highest percentage of necrosis was found in HepG2 cells treated with compound 35 (55.75%).
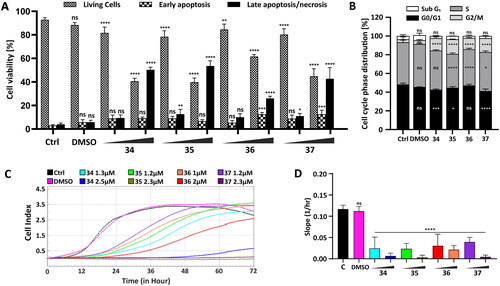
Figure 3. Influence of compounds 34–37 on cellular viability, migration, and cell cycle progression. (A) Flow cytometry analysis of apoptosis induction by the analysed compounds in HepG2 cells after 24-h treatment with compounds 34–37 in a concentration corresponding to the half (34–2.5 µM, 35–2.3 µM, 36–2 µM, 37–2.3 µM) and the total (34–5 µM, 35–4.5 µM, 36–4 µM, 37–4.5 µM) IC50 value using YO-PRO 1/PI dual staining. The number of live and apoptotic and necrotic cells was evaluated for each compound after 24 h and presented as a bar graph. The data are presented as a mean percentage ± SD from three independent experiments. (B) Cell cycle phase distribution in HepG2 cells treated for 24 h with the compounds in a final concentration: 34–5 µM, 35–4.5 µM, 36–4 µM, 37–4.5 µM. Percentage cell distribution in each of the cell cycle phases was calculated and presented as a mean ± SD from three independent experiments. (C) Real-time migration potential in HepG2 cells treated with compounds 34–37. The inhibitory potential of the compounds was analysed using the xCELLigence system in a concentration corresponding to the half (34–2.5 µM, 35–2.3 µM, 36–2 µM, 37–2.3 µM) and one-fourth (34–1.3 µM, 35–1.2 µM, 36–1 µM, 37–1.2 µM of their IC50 value. The rate of cellular migration was monitored every 30 min for 72 h. (D) Impedance-based signals were recorded, and the slope parameter representing the rate of changes in CI values was calculated for HepG2 cells within the first 24 h. Statistical significance is indicated with asterisks: (ns) p > 0.05, *p < 0.05, **p < 0.01, ***p < 0.001, ****p < 0.0001.
In studies of 1,8-naphthalimide derivatives containing boron clusters, the majority of the conjugates promoted the apoptosis mode of cell death. Some derivatives triggered autophagy or ferroptosisCitation11,Citation13.
Cell cycle analysis by flow cytometry
Cell cycle involves coordinated events that result in the formation of two cells from one mother cell. It comprises four major phases: G1 (growth phase 1), S (DNA synthesis phase), G2 (growth phase 2), and M (mitosis phase). These phases function to integrate environment-sensing signalling pathways with cell growth and proliferationCitation39. Cancer cells often deregulate the cell cycle and undergo unscheduled cell divisions; therefore, inhibition of the cell cycle presents an opportunity for therapeutic intervention in treating proliferative diseases like cancerCitation40. Most of the anticancer drugs disturb the proliferation cycle of tumour cells by inhibiting/damaging cell cycle events, which activate checkpoints, arrest cells, and induce apoptosisCitation41.
To understand the mechanism underlying the inhibitory effect of the carborane-1,8-naphthalimide conjugates on cellular viability, cell cycle regulation was studied. For this purpose, HepG2 cells were exposed to compounds 34–37 (34 (4.78 µM), 35 (4.32 µM), 36 (3.63 µM), and 37 (4.23 µM)). The concentration chosen for each of these compounds corresponded to their total IC50 value. After exposure, the HepG2 cells were examined using flow cytometry, and their DNA content was measured via PI staining. Based on the DNA content, it was observed that the tested compounds affected the cell cycle progression, resulting in G2M phase arrest. Compounds 35 and 37 showed the greatest impact, in which the observed accumulation of the cells in this phase was the most prominent (15 vs 5% in untreated cells) (, Figure S150, ESI).
In comparison, unmodified mitonafide and pinafide induced cell cycle arrest at the S and G2M phases, respectivelyCitation11. The studied 1,8-naphthalimide derivatives containing carborane group at the N-imide position caused cell cycle arrest at the G0/G1 phaseCitation11, 3-carboranyl-1,8-naphthalimides halted the cell cycle at the G2M phaseCitation12, and 4-carboranyl-1,8-naphthalimides affected the cell cycle at the G0/G1 or G2M phasesCitation13.
Cell migration inhibition assay
Cell migration is fundamental to establishing and maintaining the proper organisation of multicellular organisms. In an adult organism, cell migration is essential for proper immune response, wound repair, and tissue homeostasis, and aberrant cell migration results in various pathologiesCitation42.
Using the xCELLigence platform, the migration potential of HepG2 cells after the administration of compounds was evaluated. The cells were incubated with compounds 34–37 at the concentration corresponding to one-fourth and half of their IC50 value for 24 h (34–1.3; 2.5 µM, 35–1.2; 2.3 µM, 36–1; 2 µM, 37–1.2; 2.3 µM) before the analysis and were then seeded on a cell invasion and migration (CIM) plate. Impedance-based cell index (CI) of the HepG2 cells was measured every 30 min for 72 h. Control cells were grown only in a culture medium. To eliminate potentially misleading solvent effects, the cells were incubated only with DMSO (). The rate of migration was determined by calculating the slope parameter representing the changes in the CI within the first 24 h of the analysis (). The obtained data clearly showed that all of the analysed compounds affected the migration of HepG2 cells compared with control. Conjugates 34, 35, and 37 showed the highest influence on the migration activity. However, mitonafide analog 35 containing a meta-carborane cluster showed the highest impairment ().
Oxidative stress measurement in HepG2 cells by flow cytometry
ROS, a group of ions and molecules, include hydroxyl radicals, alkoxyl radicals, superoxide anion, singlet oxygen, and hydrogen peroxide. Endogenous ROS are mainly formed in the mitochondrial respiratory chain. At low levels, ROS play important roles in the regulation of biological functions in mammalian cells, whereas excess production of ROS can induce cell death due to their oxidative damaging effects on intracellular biomacromolecules. The types of cancer cell death induced by ROS are apoptotic, autophagic, ferroptotic, and necrotic cell death. Some anticancer drugs currently used in clinics, such as molecular targeted drugs and chemotherapeutic agents, effectively kill cancer cells by inducing ROS generationCitation43. A previous study showed that 1,8-naphthalimide derivatives could trigger apoptosis via activating the ROS-p38 MAPK pathwayCitation44 and induce apoptosis signal transduction through the ROS/lysosomal/mitochondrial pathwayCitation4.
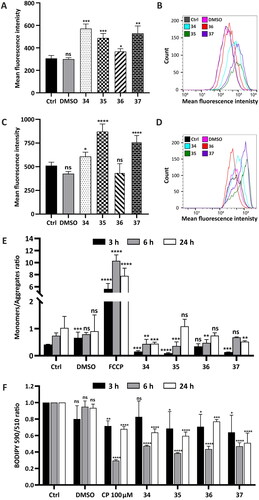
To determine the effect of compounds 34–37 on the HepG2 cells, the oxidative status of the cells was analysed after 3, 6, and 24 h of treatment as the pathological level of ROS affects the proper functioning of biomacromolecules. The compounds were added to the growth medium at a concentration that corresponds to their total IC50 value (34 (4.78 µM), 35 (4.32 µM), 36 (3.63 µM), and 37 (4.23 µM)). The ability to generate ROS in the HepG2 cells was investigated using a FACSCalibur flow cytometer, via H2DCFDA staining. Negligible ROS production after 3 and 6 h of treatment with conjugates 34–37 was observed (Figure S151, ESI). After 24 h, flow cytometry analysis was performed which indicated that the most potent inductors of ROS were compounds 34 and 37 as the green fluorescence intensity in HepG2-treated cells increased approximately twofold. The weakest ROS inductor was compound 36. Compound 35 showed a moderate effect on ROS generation after 24-h treatment ().
Figure 4. Bioenergetic and metabolic impairment in HepG2 cells treated with compounds 34–37. (A–E) Analysis of oxidative stress parameters in HepG2 cells treated with the analysed compounds for 24 h in a following concentration: 34–5 µM, 35–4.5 µM, 36–4 µM, 37–4.5 µM. ROS production (A and B) was investigated using a FACSCalibur flow cytometer with H2DCFDA/PI double staining in a final concentration 0.5 µM and 10 µM/mL respectively. Antioxidant defense system (C and D) was investigated using Thiolite Green sensor. (A) Green fluorescence intensity was analysed (∼ 510/525 ex/em), and the data are shown as a bar graph of the three independent experiments (mean ± SD) or as representative histograms (B). (C) Flow cytometry analysis of GSH using Thiolite Green dye (50 µM). The GSH level was estimated, and the fluorescence intensity changes are presented as a bar graph (mean ± SD) from three replicates or as representative histograms (D). (E) Flow cytometry mitochondrial membrane potential (MMP) analysis using JC-1 fluorescent dye (final concentration 2.5 µM). Green fluorescence emitted by monomers of the dye and red fluorescence corresponding to its aggregates were counted and presented as a monomers/aggregates ratio on a bar graph from three replicates after 3, 6, and 24 h of incubation. FCCP (3 µM) emitting a strong green fluorescent signal was used as a negative control. (F) Detection of lipid peroxidation estimated via fluorescent BODIPY 581/591 C11 reagent (10 µM). Upon oxidation, a fluorescence shift from red to green was measured after 3, 6, and 24 h of incubation with the analysed compounds in a concentration that corresponded to their IC50 value and presented as a 590/510 ratio on bar graphs. As a positive control, 100 µM cumene hydroxyperoxide (CP) for 2 h was used. Statistical significance is indicated with asterisks: (ns) p > 0.05, *p < 0.05, **p < 0.01, ***p < 0.001, ****p < 0.0001.
In the series of 1,8-naphthalimides bearing boron clusters we have reported so far, the most potent inducers of intracellular ROS production were N-imide derivatives. The most promising ones were N-[3–(1,2-dicarba-closo-dodecaborane-1-yl)propyl]-1,8-naphthalimide, N-[2–(3,3′-commo-bis(1,2-dicarba-3-cobalta(III)-closo-dodecaborate-1-yl)ethyl)]-1,8-naphthalimide, and N-{[2–(3,3′-commo-bis(1,2-dicarba-3-cobalta(III)-closo-dodecaborate-1-yl)ethyl]-1′-aminoethyl)}-1,8-naphthalimide] with an approximately twofold increase in fluorescence intensityCitation11.
Reduced glutathione (GSH) level measurement
GSH is a tripeptide compound composed of glutamate, cysteine, and glycine. It plays a role in many cell life activities involved in the occurrence and development of various human diseases, including cardiovascular diseases, ageing diseases, and diabetes. GSH is one of the major physiological free radical scavengers and can effectively remove excess ROS as well as endogenous and exogenous electrophilic species to protect cellsCitation45.
To confirm the ability of conjugates 34–37 to generate ROS, GSH level in HepG2 cells was determined by flow cytometry using Thiolite Green dye, whose fluorescence is enhanced upon reaction with thiol-containing compounds. The cells were incubated with compounds 34–37 in a final concentration corresponding to their total IC50 value (34 −5 µM, 35–4.5 µM, 36–4 µM, 37–4.5 µM). After 24 h, an increase in the intensity of green fluorescence was observed. The highest change was observed in the cells treated with compound 35 (70% higher compared to control), whereas the slightest change was observed in the cells treated with compound 36 (not statistically significant) (). These changes were in correlation with the oxidative stress induced by the compounds, and this forced natural antioxidant defense system activation.
MMP measurement
A strong positive correlation between MMP (ΔΨ) and ROS production has been repeatedly demonstrated in different experimental modelsCitation46.
In this study, mitochondrial functions in the HepG2 cells treated with the analysed compounds 34–37 were analysed. Final concentrations of the compounds were as follows: 34–5 µM, 35–4.5 µM, 36–4 µM, 37–4.5 µM. To follow the changes in the cells over time and find out whether they correlated with our previous observations, the same experimental conditions as above were chosen (3, 6, and 24 h of treatment). MMP was analysed by flow cytometry using JC-1 fluorescent dye. A high MMP allows the dye to aggregate, emitting red fluorescence. In the case of a low MMP, the dye is present in mitochondria as monomers, emitting green fluorescence. To create a strong green signal, 3 µM FCCP was used for 15 min. Results revealed that the analysed compounds affected the MMP, leading to its hyperpolarization, which is shown as a monomers/aggregates ratio (). The highest changes were observed in the HepG2 cells after 3-h treatment with compound 35 (90.8% aggregates vs 69.9% in control cells, Figure S152, ESI). Further incubation did not decrease the potential, after neither 6 h nor 24 h.
Lipid peroxidation measurement
Cell membranes are sensitive to free radical damage as they contain polyunsaturated fatty acids. Another main effect of ROS is lipid peroxidation, which occurs when membrane phospholipids come into contact with an ROS oxidising agent. In this reaction, the free radical oxidises an unsaturated lipid chain, leading to the formation of a hydroperoxidized lipid and an alkyl radical. This process of lipoperoxidation results in alterations of the membrane structure, thus affecting its fluidity and damaging its integrityCitation47. Lipid peroxidation is also the central biochemical and metabolic event leading to plasma membrane damage during ferroptosisCitation48.
The induction of lipid peroxidation in HepG2 cells after 3, 6 and 24 h of treatment with the tested compounds was studied. The cells were treated with compounds 34–37 in a concentration that corresponded to their total IC50 value (34 −5 µM, 35–4.5 µM, 36–4 µM, 37–4.5 µM). Peroxidation of lipids was estimated by flow cytometry using the BODIPY 581/591 C11 reagent, which displays a shift in emitted fluorescence. As a positive control, 100 µM CP was used for the last 2 h of the experiment. Results revealed that all of the analysed compounds caused peroxidation of lipids, which started within the first 3 h of incubation and increased over time. The tested compounds affected the HepG2 cells similarly, causing extensive fluorescence shift expressed as a 590/510 ratio ().
Intracellular Fe2+ level determination
Lipid peroxidation observed in HepG2 upon incubation with compounds 34–37 prompted us to analyse the iron level of the compounds taking into account their ability to induce ferroptosis. Ferroptosis is a new type of cell death discovered recently and is usually accompanied by a large amount of iron accumulation and lipid peroxidation during the cell death processCitation49. Activating or blocking the ferroptosis pathway to alleviate the progression of the disease has proved to be a promising therapeutic strategy for many diseases. As a new type of programmed cell death, ferroptosis has been increasingly used in the treatment of many cancers with clinical drugs and experimental compoundsCitation50.
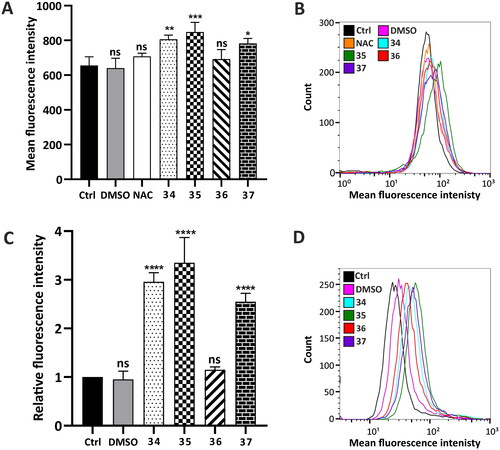
To detect the intracellular level of Fe2+ ions, a FerHo-Nox-1 fluorescent probe was used, which emits a red fluorescent signal specifically after reaction with free Fe2+ ions. Flow cytometry analysis was performed after 24-h treatment with the compounds in a concentration that corresponds to their total IC50 value (34 −5 µM, 35–4.5 µM, 36–4 µM, 37–4.5 µM). N-Acetyl-L-cysteine (NAC) (3 mM) was used as the inhibitor of ferrous accumulation. Quantitative analysis of fluorescence intensity demonstrated that the analysed compounds induced ferrous accumulation. The highest ferrous level was observed in the cells treated with compound 35, whereas the lowest was observed in the cells treated with compound 36 ().
Figure 5. Hallmarks of ferroptosis in HepG2 cells induced by compounds 34–37—intracellular Fe2+ level determination and Ca2+ homeostasis determination. (A and B) Fe2+ content was determined using a FeRhoNox-1 fluorescent probe (5 µM) after 24-h incubation with the analysed compounds (final concentration: 34–5 µM, 35–4.5 µM, 36–4 µM, 37–4.5 µM). Red fluorescence emitted by the dye upon reaction with Fe2+ was analysed using a FACSCalibur flow cytometer and presented as a bar graph from two independent experiments (six replicates) or representative histograms (B). 3 mM N-acetyl-L-cysteine (NAC) for 2 h was used as a negative control. (C and D) Intracellular calcium level was defined in 24 h-treated HepG2 cells using flow cytometry. Fluorescent signals correlated with Ca2+ accumulation were counted and presented as a bar graph from two independent experiments (six replicates, C) or as representative histograms (D). Statistical significance is indicated with asterisks: (ns) p > 0.05, *p < 0.05, **p < 0.01, ***p < 0.001, ****p < 0.0001.
Ca2+ homeostasis determination
The impact of the analysed compounds on Ca2+ homeostasis in HepG2 cells after 24-h incubation was also investigated, taking into consideration the calcium–iron connection in ferroptosisCitation51. Flow cytometry analysis revealed that all of the analysed compounds, except for compound 36, significantly affected calcium homeostasis, leading to its high accumulation within the cells. The strongest effect on Ca2+ homeostasis was observed in the HepG2 cells treated with compound 35 (more than threefold compared to control), and the slightest effect was observed in the cells treated with compound 36 ().
Results of the analysis of ROS production, lipid peroxidation, accumulation of iron, and disturbance of Ca2+ homeostasis confirmed that conjugates 34–37 were the strongest inducers of ferroptosis in HepG2 cells. Interestingly, ferroptosis was also induced by 3-{[1–(3-(1,2-dicarba-closo-dodecaborane-1-yl)propyl)-1H-1,2,3-triazol-4-yl]methoxy}-1,8-naphthalic anhydride, 3-{[1–(3–(1,7-dicarba-closo-dodecaborane-1-yl)propyl)-1H-1,2,3-triazol-4-yl]methoxy}-1,8-naphthalic anhydride, and 3-[(1,7-dicarba-closo-dodecaborane-1-yl)ethylamino]-1,8-naphthalic anhydrideCitation12. The rest of the studied conjugates primarily induced apoptosisCitation11,Citation13. To the best of our knowledge, these are the first examples of 1,8-naphthalimide derivatives and boron cluster derivatives inducting ferroptosis.
Status of lysosomes in cancer and normal cell lines after treatment with compounds 34–37
Our previous studies showed that 1,8-naphthalimides modified with the carborane group at positions 3 and 4 targeted the lysosomes of living cells, with good cell membrane permeability, which also enabled the localisation of the carborane cluster in the cellsCitation12,Citation13.
Cell death can be induced by lysosomes, and this type of cell death is called lysosomal membrane permeabilization (LMP)Citation52. In LMP, impaired lysosomal membranes allow the release of specific lysosomal enzymes into the cytosol, resulting in the hydrolysis of various organelles. Lipophilic or amphiphilic compounds with a basic moiety get protonated and trapped within lysosomes, and such a lysosomotropic behaviour is found in many pharmacological drugsCitation53. LMP and cathepsin release activates effectors, such as ROS, and iron that result in other types of cell death such as apoptosis, pyroptosis, and ferroptosisCitation54. A recent study clearly demonstrated that ferroptosis is a lysosomal cell death processCitation55,Citation56.
Lysosome-targeting anticancer agents based on the 1,8-naphthalimide derivatives were limited. A previous study has demonstrated that 1,8-naphthalimide derivatives containing polyamines and long hydrocarbon chains could induce LPMCitation7.
Differences in hydrophobicity between boron cluster compounds affect modes of interaction of their derivatives with lipid membranes. The mercaptododecaborate dianion ([B12H11SH]2−, BSH)—one of the most important boron carriers in BNCT—interacts with liposomes containing cationic or zwitterionic lipids through positively charged headgroups of these lipidsCitation57. Interestingly, globular dodecaborate clusters, and prominently B12Br122−, can function as anionic inorganic membrane carriers, including liposomal membranes, for a wide range of hydrophilic cargo molecules (with a molecular mass of 146–4500 Da)Citation58. Moreover, metallacarboranes like [COSAN]− have the ability to incorporate into or cross lipid membranes in liposomes without damaging the membranesCitation59,Citation60. Carboranes and their derivatives interact with model lipid membranes and exhibit a proton-carrying activity in planar bilayers and liposomes in a concentration- and pH-dependent mannerCitation61.
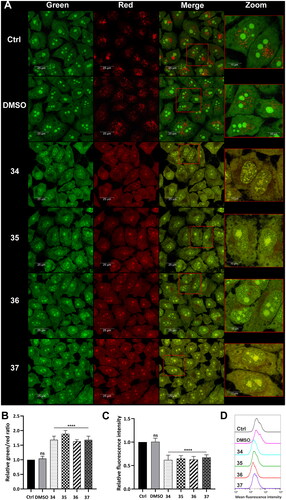
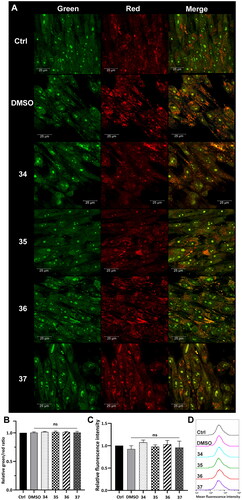
Lysosomal integrity was analysed in HepG2 cells after 3-h treatment with compounds 34–37 in a final concentration corresponding to the total IC50 value (5, 4.5, 4, and 4.5 µM, respectively). After the incubation, the cells were stained with acridine orange (AO) and Lysotracker Deep Red. AO is a lysomotropic dye that accumulates in acidic lysosomes. Upon excitation with blue light, it emits red fluorescence. During lysosome membrane permeabilization, it dissipates throughout the membrane and emits green fluorescence. Confocal microscopy visualisation clearly showed the diffuse fluorescence pattern in the HepG2 cells after treatment with the analysed compounds (). Simultaneously, flow cytometry analysis was carried out, which confirmed this observation. Green and red fluorescence intensity was quantified using a FACSCalibur flow cytometer, and the green/red ratio was calculated to measure LMPCitation62. Results showed that the treatment of the HepG2 cells with the modified 1,8-naphthalimides markedly increased the ratio. The highest change was observed in the cells treated with compounds 34 and 35 (approximately twofold, ). Moreover, the HepG2 cells were stained with Lysotracker Deep Red, which selectively stains acidic organelles like lysosomes. Red fluorescence intensity was analysed using a flow cytometer. Results showed that only 3-h treatment with the analysed compounds significantly affected the lysosomes, which was manifested by a decrease in fluorescence intensity compared to control ().
Figure 6. Lysosome status in HepG2 cells after treatment with compounds 34–37. Confocal microscopy (A) and flow cytometry (B) analysis of lysosome integrity using AO staining in HepG2 cells treated with compounds 34–37 for 3 h at the final concentration corresponding to the total IC50 value (34–5 µM, 35–4.5 µM, 36–4 µM, 37–4.5 µM). Untreated cells and cells treated with DMSO were used as controls. (A) AO fluorescence was visualised at two spectral settings at an ex/em wavelength of 488/505–550 nm for green fluorescence and 488/600–650 nm for red fluorescence. Merged images and magnifications of their fragments are shown on the right panels. (B) Intensity of the red and green fluorescence of the stained cells was quantified and expressed as a green/red ratio. (C and D) Flow cytometry analysis of lysosomes in HepG2 cells after 3 h of incubation with the analysed compounds using Lysotracker Deep Red staining. Intensity of the red fluorescence was measured and quantified (C). The observed fluorescence intensity shift was presented as representative histograms (D). Statistical significance is indicated with asterisks: (ns) not significant, (****) p < 0.0001.
1,8-Naphthalimide–boron cluster conjugates are lipophilic compounds. The RM0 values of the conjugates were in the range of 2.62–4.48, and the highest lipophilicity was found for conjugates bearing carborane clusters. A parallel artificial membrane permeability assay revealed that conjugates bearing carborane clusters exhibited a high degree of permeationCitation22. Our results suggested that compounds 34–37 intercalate into the cell membrane of lysosomes within 3 h and induce LPM. This is consistent with the findings of Stark et al., who reported that compounds containing a lipophilic polyaromatic ring fragment undergo marked sequestration and concentration within lysosomal membranes, inducing alterations in membrane fluidity and integrity. The lysosomal membrane concentration of lysosomotropic drugs provides the first molecular basis for the disruption of the lysosomal central signalling functions and cue sensingCitation63. In the present study, it was considered that ferroptosis induced by tested compounds 34–37 is supported by LPM. It was reported that redox-active iron from ferritin or transferrin is presumably involved in local ROS generation within endosomes/lysosomes. It has been shown labile iron was consistently observed in endosomes or lysosomes in primary hepatocytes or hepatocellular carcinoma using iron-specific fluorescent probes. Lysosomal ROS or some ferrous ions (Fe2+) may relocate to the cytoplasm, which in turn could induce an ROS burst. In addition, lysosomal ROS and iron may contribute to lipid ROS production because oxidising membranes were observed in the perinuclear compartments during the early phase of ferroptosisCitation55.
Tumour cell lysosomes are more fragile than lysosomes of normal cells and thus are more susceptible to LMPCitation64,Citation65. To verify lysosome status, the same analysis was conducted in normal human fibroblasts (MRC-5). The cells were incubated with compounds 34–37 in a concentration corresponding to the total IC50 value (). Using confocal microscopy, a strong punctate red fluorescence signal was observed in the treated MRC-5 derived from unaffected lysosomes (). Red and green fluorescence emitted from AO staining was also measured using a flow cytometer, and no changes in the green/red ratio were observed (). Lysosomal status was also analysed using Lysotracker Deep Red staining. The decrease in fluorescence intensity observed in HepG2 cells treated with the compounds was not observed for MRC-5, which indicates that the lysosomal membrane stayed intact (). This confirms the selectivity of the modified 1,8-naphthalimides.
Figure 7. Lysosome status in MRC-5 cells after treatment with compounds 34–37. Confocal microscopy (A) and flow cytometry (B) analysis of lysosome integrity using AO staining in MRC-5 cells treated with compounds 34–37 for 3 h at the final concentration corresponding to the total IC50 value (34–2.1 µM, 35–2.1 µM, 36–2.3 µM, 37 -2.3 µM). Untreated cells and cells treated with DMSO were used as controls. (A) AO fluorescence was visualised at two spectral settings at an ex/em wavelength of 488/505–550 nm for green fluorescence and 488/600–650 nm for red fluorescence. Merged images and magnifications of their fragments are shown on the right panels. (B) Intensity of the red and green fluorescence of the stained cells was quantified and expressed as a green/red ratio. (C and D) Flow cytometry analysis of lysosomes in MRC-5 cells after 3 h of incubation with the analysed compounds using Lysotracker Deep Red staining. Intensity of the red fluorescence was measured and quantified (C). The fluorescence intensity distribution was presented as representative histograms (D). Statistical significance is indicated with asterisks: (ns) not significant.
Human topoisomerase IIα relaxation assay
DNA topoisomerases I and II (Topo I and II, respectively) play a role in solving the topological problems associated with DNA replication, transcription, recombination, and chromatin remodelling by introducing temporary single- or double-strand breaks in the DNA before changing the linking number of a helix and then resealing phosphodiester bonds. In addition, these enzymes fine-tune the steady-state level of DNA supercoiling to facilitate protein interactions with the DNA as well as prevent excessive supercoilingCitation66. 1,8-Naphthalimides can exert their antitumor activities also through topoisomerase I/II inhibitionCitation7,Citation8.
Our earlier study showed that the presence of the carboranyl cluster at position 3 of 1,8-naphthalimide moieties did not promote them as effective Topo II inhibitorsCitation12. The 4-carboranyl-1,8-naphthalimides studied showed anti-Topo II activity with IC50 = 0.58–61.59 µM. Two compounds—N-[2-(dimethylamino)ethyl]-4-{1-[3-(1,2-dicarba-closo-dodecaborane-1-yl)propyl]-1H-1,2,3-triazol-4-yl}-1,8-naphthalimide (IC50 = 0.58 µM) and N-[2-(N-pyrrolidinyl)ethyl]-4-[(2–(3–(1,2-dicarba-closo-dodecaborane-1-yl)propanamido)ethyl)amino]-1,8-naphthalimide (IC50 = 2.81 µM)—were found to be more active than mitonafide (IC50 = 5.13 µM).
Based on these findings, conjugates 34–37 were tested in the screening assay for human topoisomerase IIα inhibitory activity at the concentration of 100 µM (Figure S153, ESI). However, they inhibited DNA migration in the gel, probably due to intercalation, and it was impossible to determine their effect on human topoisomerase IIα. Therefore, these compounds were subjected to further detailed analyses of inhibitory potential at concentrations of 1, 5, and 10 µM (Figure S154, ESI). None of the tested compounds inhibited Topo II activity. However, a difference in DNA migration in the gel was observed with an increase in the concentration of compounds, indicating intercalation into the DNA strands.
DNA unwinding assay
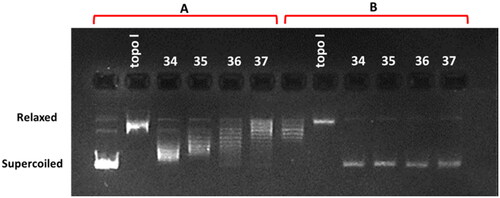
Compounds that are able to intercalate into DNA or bind in the groove are involved in the local unwinding of the DNA, leading to a decrease in the twist number and an increase in the writhe number of the previously relaxed plasmid DNA used in the assay, resulting in a positively supercoiled DNA. If this DNA is then nicked by a topoisomerase, the enzyme will remove supercoils and relax the DNA, followed by religation. Upon removal of the compound and the enzyme by butanol extraction, the twist will increase, so the writhe will decrease, resulting in more negatively supercoiled DNA, which runs faster on agarose gel. The occurrence of a band representing supercoiled plasmid DNA on agarose gel indicates that the compound is an intercalator or groove binder. If the compound does did not interact with the DNA, then it will be a relaxed plasmid will be observed. This assay should be verified by performing a second reaction using a negatively supercoiled plasmid as a substrate to confirm that the compound is not simply acting as an inhibitor of the Topo I.
Incubation of the relaxed plasmid with the tested compounds 34–37 in the presence of Topo I showed the appearance of a supercoiled DNA fraction in each case, which proves the intercalating effect of these compounds (). This was further confirmed in the second reaction using a supercoiled plasmid as a substrate. The absence of an intensive supercoiled DNA on agarose gel after incubation of the tested compounds with Topo I indicates that they are not strong inhibitors of this enzyme (). Depending on the degree of supercoiling, DNA runs as a ladder of topoisomers on the gel when poor intercalators were tested but also when strong intercalators were used at low concentrations, or at the same position as the substrate. Among the studied compounds, the most relaxed topoisomers were observed in the presence of conjugate 37, which indicates that it was the strongest DNA intercalator in this pool what is consistent with physicochemical studies.
Figure 8. DNA unwinding assay in the presence of compounds 34–37 at a concentration of 10 μM. Panel A indicates the reaction with a supercoiled pBR 322 as a substrate for wheat germ topoisomerase I (Topo I), and panel B indicates the reaction with a relaxed plasmid as a substrate. Topo I indicates control reactions without any drug. Supercoiled and relaxed fractions of the plasmid DNA are marked.
Conclusions
In this study, convenient protocols for the synthesis of novel 1,8-naphthalimide derivatives containing ortho- or meta-carborane cluster at position 4 and nitro group at position 3 of the heteroaromatic skeleton as analogs of mitonafide and pinafide were tested. The X-ray structure of the pinafide analog bearing meta-carborane 15 was established. The DNA-binding properties of the synthesised compounds were investigated using thermal denaturation experiments, CD spectroscopy, and UV–vis spectroscopy. Conjugates 34–37, which were obtained via reductive amination, with an amine linker -NH-(CH2)6-NH-(CH2)2- between the carborane group and the 1,8-naphthalimide moiety, were found to interact most strongly with ct-DNA among all the 1,8-naphthalimide–carborane conjugates synthesised in our laboratory, containing boron clusters attached to imide, at position 3 or 4 of the ring systems, and also mitonafide. Among this group of derivatives, the conjugates containing meta-carborane showed the strongest effect. This indicated an intercalative binding mode, which was additionally confirmed using the DNA unwinding assay. A similar compound with a shorter linker -NH-(CH2)2-NH-(CH2)2- showed weak DNA stabilisation. Compounds 34–37 were cytotoxic against HepG2 cells with IC50 values in the range of 3.62–4.78 µM. In vitro cytotoxic activity decreased in the order 36 > 37 > 35 > 34. This study also showed that these compounds could effectively induce cell cycle arrest at the G2M phase and inhibit cell migration but did not have inhibitory activity against Topo II. This study further demonstrated that compounds 34–37 induced ferroptosis as a dominant cell death process in the tested cancer cells (HepG2), which was confirmed by intracellular iron accumulation and subsequent lipid peroxidation measurement. The same compounds also induced LMP. Lysosomes contribute to ferroptosis by modulating iron equilibria and ROS expression. In comparison with the normal cell line (MRC-5), LMP process was not confirmed, which ensures the selectivity of the modified compounds. The results showed mitonafide analog 35 bearing meta-carborane as the most promising among the tested compounds. It interacted most strongly with DNA, was most effective in inhibiting cell migration, and had the greatest impact on GSH and Fe2+ levels, MMP changes, and Ca2+ homeostasis. These properties play an important role in anticancer activity through ferroptosis induction.
This study showed that selected 4-carboranyl-3-nitro-1,8-naphthalimide derivatives have the structural features of DNA intercalators, ferroptosis inducers, and lysosomotropic detergents. These encouraging results suggest that such inorganic–organic hybrids can be considered novel multitarget compounds with anticancer activity. Further studies on these compounds are under way in our laboratory.
Materials and methods
Chemistry
Most of the chemicals used in this study were obtained from the Acros Organics (Geel, Belgium) and used without further purification unless otherwise stated. 4-Bromonaphthalic anhydride (1) was obtained from the TCI (Tokyo, Japan) and used without further purification. Boron clusters were purchased from KATCHEM spol. s.r.o. (Řež/Prague, Czech Republic). All experiments involving water-sensitive compounds were conducted under thorough dry conditions and an argon atmosphere. Flash column chromatography was performed on silica gel 60 (230–400 mesh, Sigma-Aldrich). Rf refers to analytical TLC performed using precoated silica gel 60 F254 plates purchased from Sigma-Aldrich (Steinheim, Germany) and developed in the solvent system indicated. The compounds were visualised using UV light (254 nm) or a 0.5% acidic solution of PdCl2 in HCl/methanol by heating with a heat gun for boron-containing derivatives. The yields were not optimised.
1H-NMR, 13C-NMR, and 11B-NMR spectra were recorded on a Bruker Avance III 600 MHz spectrometer equipped with a direct ATM probe. The spectra for 1H, 13C, and 11B nuclei were recorded at 600.26, 150.94, and 192.59 MHz, respectively. Deuterated solvents were used as standards. The following abbreviations are used to denote the multiplicities: s = singlet, d = doublet, dd = doublet of doublets, ddd = doublet of doublets of doublets, t = triplet, dt = doublet of triplets, q = quartette, quin = quintet, br s = broad singlet, and m = multiplet. J values were expressed in Hz.
Mass spectra were recorded on a CombiFlash PurIon Model Eurus35 (Teledyne ISCO, Lincoln, USA). Ionisation was achieved by atmospheric pressure chemical ionisation (APCI) ionisation in the positive ion mode (APCI+) and the negative ion mode (APCI−). The entire flow was directed to the APCI ion source operating in the positive ion mode. Total ion chromatograms were recorded in the m/z range of 100–700. Vaporisation and capillary temperature were set at 400 and 300 °C, respectively. Capillary voltage was 150 V, and current discharge was 10 µA. High-resolution mass spectrometry (HRMS) measurements were performed using Synapt G2-Si mass spectrometer (Waters) equipped with an ESI/APCI source and quadrupole-Time-of-flight mass analyser. To ensure accurate mass measurements, data were collected in centroid mode and mass was corrected during acquisition using leucine enkephalin solution as an external reference (Lock-SprayTM). The results of the measurements were processed using the MassLynx 4.1 software (Waters) incorporated with the instrument. Data were presented for the most abundant mass in the boron distribution plot of the base peak (100%) and for the peak corresponding to the highest m/z value with its relative abundance (%).
The theoretical molecular mass peaks of the compounds were calculated using the “Show Analysis Window” option in the ChemDraw Ultra 12.0 program. The calculated m/z corresponded to the average mass of the compounds consisting of natural isotopes.
Infrared spectra (IR) were recorded using a Nicolet 6700 Fourier-transform infrared spectrometer (Thermo Scientific) equipped with an ETC EverGlo* source for the IR range, a Geon-KBr beam splitter, and a DLaTGS/KBr detector with a smart orbit sampling compartment and a diamond window. The samples were placed directly on the diamond crystal, and pressure was applied to make the surface of the sample conform to that of the diamond crystal.
UV measurements were performed using a GBC Cintra10 UV–VIS spectrometer (Dandenong, Australia). Before the UV experiment, the samples were dissolved in 99.8% C2H5OH. The measurement was performed at ambient temperature.
RP-HPLC analysis was performed on a Hewlett–Packard 1050 system equipped with a UV detector and a Hypersil Gold C18 column (4.6 × 250 mm, 5 µm particle size, Thermo Scientific, Runcorn, UK). UV detection was carried out at 380 nm. The flow rate was set at 1 ml min−1. All analyses were run at ambient temperature. The gradient elution was as follows: 10 min from 0 to 25% A, 10 min from 25 to 60% A, and 10 min from 60 to 0% A. Buffer A contained 0.1% HCOOH in CH3CN, and buffer B contained 0.1% HCOOH in H2O.
Crystals of 15 were obtained by slow evaporation from the mixture of MeOH and CH2Cl2 (3:2, v/v). X-ray diffraction measurements were carried out under cryogenic conditions on an XtaLab Synergy four-circle diffractometer (Oxford Diffraction) equipped with a Cu rotating anode PhotonJet X-ray source and a HyPis-6000HE CCD detector. The data were processed using the CRYSALISPRO software (Rigaku Oxford Diffraction), and the structure was solved with SHELXT and refined with SHELXL programsCitation67,Citation68. The refinement of atomic positions was unrestrained except for hydrogen atoms that were maintained at riding positions. Table S1 (ESI) summarises the crystallographic data.
4-Bromo-N-[2-(dimethylamino)ethyl]-1,8-naphthalimide (2) and 4-bromo-N-[2-(N-pyrrolidinyl)ethyl]-1,8-naphthalimide (3) were obtained via the reaction of 4-bromonaphthalic anhydride (1) with appropriate amine N,N-dimethylethylenediamine and N-(2-aminoethyl)pyrrolidine, respectivelyCitation69. 3–(1,2-Dicarba-closo-dodecaboran-1-yl)propionic acid (10) was synthesised as described in the literatureCitation28. 3-(1,7-Dicarba-closo-dodecaboran-1-yl)propionic acid (11) was also synthesised as described earlierCitation29. 2–(1,2-Dicarba-closo-dodecaboran-1-yl)ethanal (20) and 2–(1,7-dicarba-closo-dodecaboran-1-yl)ethanal (51) were synthesised using a procedure described in the literatureCitation31.
Synthesis of 4-bromo-3-nitro-N-[2-(N-pyrrolidinyl)ethyl]-1,8-naphthalimide (5)
4-Bromo-N-[2-(N-pyrrolidinyl)ethyl]-1,8-naphthalimide (3) (42 mg, 112.9 µmol) was dissolved in concentrated H2SO4 (0.6 ml) at 0 °C, and NaNO3 (14.5 mg, 170.6 µmol) was added in several portions. The reaction mixture was stirred for 1 h at 0 °C and for 3 h at rt, poured on ice, and then neutralised with saturated NaHCO3. The crude product was extracted to CH2Cl2 (4 × 5 ml), the organic layer was dried over MgSO4. Then, the drying agent was filtered off and washed with CH2Cl2. Filtrate and washings were combined and evaporated to dryness under a vacuum. The crude product was purified by column chromatography on silica gel (230–400 mesh) using a gradient of MeOH (0–7%) in CH2Cl2 as an eluting solvent system, and a brown solid was obtained. Yield: 35.1 mg (75%). TLC (MeOH/CH2Cl2, 1:9, v/v): Rf = 0.52; 1H-NMR (CDCl3, 600.26 MHz): δ (ppm) = 8.82–8.79 (m, 3H, 3Harom), 8.02 (t, J = 7.9 Hz, 1H, Harom), 4.41 (t, J = 6.9 Hz, 2H, CH2-N(CO)2), 2.90 (br s, 2H, CH2-pyrrolidine), 2.73 (br s, 4H, 2 × N-CH2pyrrolidine-CH2), 1.83 (br s, 4H, 2 × CH2-CH2pyrrolidine-CH2).
Synthesis of 1,8-naphthalimide derivatives 6–9
4-Bromo-N-[2-(dimethylamino)ethyl]-3-nitro-1,8-naphthalimide (4) or 4-bromo-3-nitro-N-[2-(N-pyrrolidinyl)ethyl]-1,8-naphthalimide (5) was suspended in absolute EtOH (30 ml per 1 mmol). Then, ethane-1,2-diamine or hexane-1,6-diamine (9.5 equiv.) was added, and the mixture was refluxed under dry argon for 2 h. The mixture was subsequently cooled down to rt, and the solvent was evaporated. The crude product was purified by column chromatography on silica gel (230–400 mesh) using MeOH (5–20%) in CH2Cl2 with the addition of 1% of TEA as an eluting solvent system.
4-[(2-Aminoethyl)amino]-N-[2-(dimethylamino)ethyl]-3-nitro-1,8-naphthalimide (6)
orange solid, yield: 58.1 mg (79%). TLC (2 × TEA/MeOH/CH2Cl2, 1:20:80, v/v): Rf = 0.58; 1H-NMR (acetone-d6, 600.26 MHz): δ (ppm) = 9.06 (s, 1H, Harom), 8.95 (d, J = 8.5 Hz, 1H, Harom), 8.61 (d, J = 7.3 Hz, 1H, Harom), 7.82 (t, J = 7.9 Hz, 1H, Harom), 4.26 (t, J = 5.6 Hz, 2H, CH2-NH), 4.21 (t, J = 6.9 Hz, 2H, CH2-N(CO)2), 3.55 (t, J = 5.5 Hz, 2H, CH2-NH2), 2.56 (t, J = 6.9 Hz, 2H, CH2-N(CH3)2), 2.25 (s, 6H, N(CH3)2).
4-[(2-Aminoethyl)amino]-3-nitro-N-[2-(N-pyrrolidinyl)ethyl]-1,8-naphthalimide (7)
orange solid, yield: 17.5 mg (77%). TLC (2 × TEA/MeOH/CH2Cl2, 1:20:80, v/v): Rf = 0.58; 1H-NMR (acetone-d6, 600.26 MHz): δ (ppm) = 9.05 (s, 1H, Harom), 8.94 (d, J = 8.5 Hz, 1H, Harom), 8.60 (d, J = 7.3 Hz, 1H, Harom), 7.81 (t, J = 7.9 Hz, 1H, Harom), 4.31 (t, J = 6.8 Hz, 2H, CH2-N(CO)2), 4.25 (t, J = 5.6 Hz, 2H, CH2-NH), 3.55 (t, J = 5.6 Hz, 2H, CH2-NH2), 3.06 (br s, 2H, CH2-pyrrolidine), 2.95 (br s, 4H, 2 × N-CH2pyrrolidine-CH2 overlapped with H2O), 1.80 (br s, 4H, 2 × CH2-CH2pyrrolidine-CH2).
4-[(6-Aminohexyl)amino]-N-[2-(dimethylamino)ethyl]-3-nitro-1,8-naphthalimide (8)
orange solid, yield: 17.4 mg (70%). TLC (2 × TEA/MeOH/CH2Cl2, 1:20:80, v/v): Rf = 0.43; 1H-NMR (MeOH-d4, 600.26 MHz): δ (ppm) = 8.94 (s, 1H, Harom), 8.78 (dd, J = 8.5, 1.1 Hz, 1H, Harom), 8.56 (dd, J = 7.4, 1.0 Hz, 1H, Harom), 7.74 (dd, J = 8.5, 7.4 Hz, 1H, Harom), 4.22 (t, J = 7.0 Hz, 2H, CH2-N(CO)2), 3.94 (t, J = 6.9 Hz, 2H, CH2-NH), 2.83–2.78 (m, 2H, CH2-N(CH3)2 overlapped with TEA), 2.65 (t, J = 7.0 Hz, 2H, CH2-NH2), 2.35 (s, 6H, N(CH3)2), 1.93–1.84 (m, 2H, CH2-CH2-CH2), 1.65–1.57 (m, 4H, 2 × CH2-CH2-CH2), 1.56–1.49 (m, 2H, CH2-CH2-CH2).
4-[(6-Aminohexyl)amino]-3-nitro-N-[2-(N-pyrrolidinyl)ethyl]-1,8-naphthalimide (9)
orange solid, yield: 26.6 mg (70%). TLC (2 × TEA/MeOH/CH2Cl2, 1:20:80, v/v): Rf = 0.43; 1H-NMR (MeOH-d4, 600.26 MHz): δ (ppm) = 8.88 (s, 1H, Harom), 8.78 (dd, J = 8.5, 1.1 Hz, 1H, Harom), 8.54 (d, J = 7.4, 1.0 Hz, 1H, Harom), 7.73 (dd, J = 8.6, 7.3 Hz, 1H, Harom), 4.23 (t, J = 6.9 Hz, 2H, CH2-N(CO)2), 3.94 (t, J = 6.9 Hz, 2H, CH2-NH), 2.96–2.91 (m, 2H, CH2-NH2), 2.87 (t, J = 6.9 Hz, 2H, CH2-pyrrolidine), 2.79–2.77 (m, 4H, 2 × N-CH2pyrrolidine-CH2), 1.94–1.84 (m, 6H, 2 × CH2-CH2pyrrolidine-CH2 overlapped with CH2-CH2-CH2), 1.72–1.69 (m, 2H, CH2-CH2-CH2), 1.61–1.48 (m, 4H, 2 × CH2-CH2-CH2).
Synthesis of 1,8-naphthalimide derivatives 12–19 modified with carborane cluster via amidation reaction
4-[(2-Aminoethyl)amino]-N-[2-(dimethylamino)ethyl]-3-nitro-1,8-naphthalimide (6), 4-[(2-aminoethyl)amino]-3-nitro-N-[2-(N-pyrrolidinyl)ethyl]-1,8-naphthalimide (7), 4-[(6-aminohexyl)amino]-N-[2-(dimethylamino)ethyl]-3-nitro-1,8-naphthalimide (8), or 4-[(6-aminohexyl)amino]-3-nitro-N-[2-(N-pyrrolidinyl)ethyl]-1,8-naphthalimide (9) and 3–(1,2-dicarba-closo-dodecaboran-1-yl)propionic acid (10) (1.05 equiv.) or 3–(1,7-dicarba-closo-dodecaboran-1-yl)propionic acid (11) (1.05 equiv.) were dissolved in anhydrous CH2Cl2 (22 ml per 1 mmol), and then anhydrous TEA (2.1 equiv.) and PyBOP (1.1 equiv.) were added. The reaction mixture was stirred for 2–5 h at rt under an inert (Ar) atmosphere. Then, it was diluted with CH2Cl2 (33 ml per 1 mmol) and washed with the same volume of H2SO4 (2.5%) (compound 17 was diluted with CH2Cl2 and incubated with 2 M HCl (2 × 1 h)), NaHCO3 (2.5%), and finally twice with water. The organic phase was separated, dried over MgSO4, filtered, and evaporated to dryness. Then, the product was purified by column chromatography on silica gel (230–400 mesh) using a gradient of MeOH (3–10%) in CH2Cl2 as an eluting solvent system. Compounds 16, 18, and 19 were purified again by column chromatography under the same conditions as described above.
4-[(2-[3–(1,2-Dicarba-closo-dodecaborane-1-yl)propanamido]ethyl)amino]-N-[2-(dimethylamino)ethyl]-3-nitro-1,8-naphthalimide (12)
orange solid, yield: 11.2 mg (73%). TLC (MeOH/CH2Cl2, 3:7, v/v): Rf = 0.51; 1H-NMR (MeOH-d4, 600.26 MHz): δ (ppm) = 8.84 (s, 1H, Harom), 8.67 (dd, J = 8.5, 0.9 Hz, 1H, Harom), 8.53 (dd, J = 7.3, 0.9 Hz, 1H, Harom), 7.73 (dd, J = 8.5, 7.5 Hz, 1H, Harom), 4.49 (br s, 1H, CHcarborane), 4.27 (t, J = 6.8 Hz, 2H, CH2-N(CO)2), 3.90 (t, J = 5.7 Hz, 2H, CH2-NH), 3.55 (t, J = 5.7 Hz, 2H, CH2-NH), 2.91 (t, J = 6.8 Hz, 2H, CH2-N(CH3)2), 2.57 (s, 6H, N(CH3)2), 2.50 (dd, J = 9.0, 6.6 Hz, 2H, CH2-carborane), 2.36 (dd, J = 9.0, 6.6 Hz, 2H, NH-C(O)-CH2), 3.0–1.5 (m, 10H, B10H10); 13C-NMR (MeOH-d4, 150.95 MHz): δ (ppm) = 173.89 (1 C, C(O)-NH), 165.15, 164.14 (2 C, C11, C12), 151.19–111.50 (10 C, 10 Carom), 76.21 (1 C, Ccarborane), 63.93 (1 C, CHcarborane), 57.56 (1 C, CH2-N(CH3)2), 50.58 (1 C, CH2-NH), 45.27 (2 C, 2 × CH3), 40.92 (1 C, CH2-NH), 38.03 (1 C, CH2-N(CO)2), 35.74–33.97 (2 C, CH2-carborane and NH-C(O)-CH2); 11B-NMR {1H BB} (MeOH-d4, 192.59 MHz): δ (ppm) = −2.79 (s, 1B, B9), −5.99 (s, 1B, B12), −9.70 (s, 2B, B8,10), −11.92–−13.07 (m, 6B, B3,4,5,6,7,11); UV (99.8% CH3CH2OH): λmax = 246, 393 nm, λmin = 226, 329 nm, λsh = 311 nm; FT-IR: νmax (cm–1) = 2930 (C-Haliphat), 2577 (B-H), 1697 (C = O), 1647 (C = O), 723 (B-B); RP-HPLC: tR = 20.52 min; APCI-MS: m/z: 570 [M + H]+, calcd for C23H35B10N5O5 = 569.
4-[(2-[3–(1,7-Dicarba-closo-dodecaborane-1-yl)propanamido]ethyl)amino]-N-[2-(dimethylamino)ethyl]-3-nitro-1,8-naphthalimide (13)
orange solid, yield: 9.8 mg (65%). TLC (MeOH/CH2Cl2, 3:7, v/v): Rf = 0.52; 1H-NMR (MeOH-d4, 600.26 MHz): δ (ppm) = 8.86 (s, 1H, Harom), 8.67 (dd, J = 8.5, 0.8 Hz, 1H, Harom), 8.54 (dd, J = 7.4, 0.8 Hz, 1H, Harom), 7.74 (dd, J = 8.5, 7.5 Hz, 1H, Harom), 4.26 (t, J = 6.9 Hz, 2H, CH2-N(CO)2), 3.88 (t, J = 5.7 Hz, 2H, CH2-NH), 3.52 (t, J = 5.6 Hz, 2H, CH2-NH), 3.48 (br s, 1H, CHcarborane), 2.83 (t, J = 6.8 Hz, 2H, CH2-N(CH3)2), 2.50 (s, 6H, N(CH3)2), 2.20–2.17 (m, 2H, CH2-carborane), 2.14–2.11 (m, 2H, NH-C(O)-CH2), 3.0–1.5 (m, 10H, B10H10); 13C-NMR (MeOH-d4, 150.95 MHz): δ (ppm) = 174.34 (1 C, C(O)-NH), 165.14, 164.13 (2 C, C11, C12), 151.17–111.58 (10 C, 10 Carom), 76.52 (1 C, Ccarborane), 57.61 (1 C, CH2-N(CH3)2), 57.04 (1 C, CHcarborane), 50.56 (1 C, CH2-NH), 45.44 (2 C, 2 × CH3), 40.94 (1 C, CH2-NH), 38.27 (1 C, CH2-N(CO)2), 36.59–33.29 (2 C, CH2-carborane and NH-C(O)-CH); 11B-NMR {1H BB} (MeOH-d4, 192.59 MHz): δ (ppm) = −4.55 (s, 1B, B5), −9.87–−11.03 (m, 5B, B4,6,9,10,12), −13.56 (s, 2B, B8,11), −15.24 (s, 2B, B2,3); UV (99.8% CH3CH2OH): λmax = 247, 393 nm, λmin = 226, 329 nm, λsh = 309 nm; FT-IR: νmax (cm–1) = 2931 (C-Haliphat), 2595 (B-H), 1697 (C = O), 1647 (C = O), 729 (B-B); RP-HPLC: tR = 20.40 min; APCI-MS: m/z: 570 [M + H]+, calcd for C23H35B10N5O5 = 569.
4-[(2-[3–(1,2-Dicarba-closo-dodecaborane-1-yl)propanamido]ethyl)amino]-3-nitro-N-[2-(N-pyrrolidinyl)ethyl]-1,8-naphthalimide (14)
orange solid, yield: 13.5 mg (52%). TLC (MeOH/CH2Cl2, 3:7, v/v): Rf = 0.50; 1H-NMR (MeOH-d4, 600.26 MHz): δ (ppm) = 8.80 (s, 1H, Harom), 8.66 (d, J = 7.9 Hz, 1H, Harom), 8.52 (d, J = 6.8 Hz, 1H, Harom), 7.72 (dd, J = 8.3, 7.5 Hz, 1H, Harom), 4.50 (br s, 1H, CHcarborane), 4.31 (t, J = 6.5 Hz, 2H, CH2-N(CO)2), 3.89 (t, J = 5.6 Hz, 2H, CH2-NH), 3.56 (t, J = 5.6 Hz, 2H, CH2-NH), 3.18 (t, J = 6.6 Hz, 2H, CH2-pyrrolidine), 3.12 (br s, 4H, 2 × N-CH2pyrrolidine-CH2), 2.50 (dd, J = 9.1, 6.5 Hz, 2H, CH2-carborane), 2.37 (dd, J = 9.1, 6.5 Hz, 2H, NH-C(O)-CH2), 2.01–1.93 (m, 4H, 2 × CH2-CH2pyrrolidine-CH2), 3.0–1.5 (m, 10H, B10H10); 13C-NMR (MeOH-d4, 150.95 MHz): δ (ppm) = 173.92 (1 C, C(O)-NH), 165.14, 164.11 (2 C, C11, C12), 151.14–111.27 (10 C, 10 Carom), 76.23 (1 C, Ccarborane), 63.94 (1 C, CHcarborane), 55.63 (2 C, 2 × N-CH2pyrrolidine-CH2), 54.54 (1 C, CH2-pyrrolidine), 50.57 (1 C, CH2-NH), 40.86 (1 C, CH2-NH), 38.67 (1 C, CH2-N(CO)2), 35.75–33.97 (2 C, CH2-carborane and NH-C(O)-CH2), 24.14 (2 C, 2 × CH2-CH2pyrrolidine-CH2); 11B-NMR {1H BB} (MeOH-d4, 192.59 MHz): δ (ppm) = −2.79 (s, 1B, B9), −6.01 (s, 1B, B12), −9.70 (s, 2B, B8,10), −11.92–−13.00 (m, 6B, B3,4,5,6,7,11); UV (99.8% CH3CH2OH): λmax = 246, 394 nm, λmin = 227, 329 nm, λsh = 309 nm; FT-IR: νmax (cm–1) = 2930 (C-Haliphat), 2577 (B-H), 1697 (C = O), 1647 (C = O), 722 (B-B); RP-HPLC: tR = 20.74 min; APCI-MS: m/z: 596 [M + H]+, calcd for C25H37B10N5O5 = 595.
4-[(2-[3–(1,7-Dicarba-closo-dodecaborane-1-yl)propanamido]ethyl)amino]-3-nitro-N-[2-(N-pyrrolidinyl)ethyl]-1,8-naphthalimide (15)
orange solid, yield: 15.6 mg (60%). TLC (MeOH/CH2Cl2, 3:7, v/v): Rf = 0.50; 1H-NMR (MeOH-d4, 600.26 MHz): δ (ppm) = 8.82 (s, 1H, Harom), 8.67 (d, J = 8.5 Hz, 1H, Harom), 8.53 (dd, J = 7.3, 0.8 Hz, 1H, Harom), 7.73 (dd, J = 8.4, 7.4 Hz, 1H, Harom), 4.32 (d, J = 6.6 Hz, 2H, CH2-N(CO)2), 3.87 (t, J = 5.6 Hz, 2H, CH2-NH), 3.53 (t, J = 5.6 Hz, 2H, CH2-NH), 3.49 (br s, 1H, CHcarborane), 3.19 (t, J = 6.6 Hz, 2H, CH2-pyrrolidine), 3.13 (br s, 4H, 2 × N-CH2pyrrolidine-CH2), 2.21 (dt, J = 6.8, 4.0 Hz, 2H, CH2-carborane), 2.15 (dd, J = 7.8, 4.1 Hz, 2H, NH-C(O)-CH2), 1.99–1.95 (m, 4H, 2 × CH2-CH2pyrrolidine-CH2), 3.0–1.5 (m, 10H, B10H10); 13C-NMR (MeOH-d4, 150.95 MHz): δ (ppm) = 174.39 (1 C, C(O)-NH), 165.18, 164.14 (2 C, C11, C12), 151.13–111.28 (10 C, 10 Carom), 76.53 (1 C, Ccarborane), 57.05 (1 C, CHcarborane), 55.63 (2 C, 2 × N-CH2pyrrolidine-CH2), 54.56 (1 C, CH2-pyrrolidine), 50.53 (1 C, CH2-NH), 40.84 (1 C, CH2-NH), 38.69 (1 C, CH2-N(CO)2), 36.60–33.29 (2 C, CH2-carborane and NH-C(O)-CH2), 24.13 (2 C, 2 × CH2-CH2pyrrolidine-CH2); 11B-NMR {1H BB} (MeOH-d4, 192.59 MHz): δ (ppm) = −4.53 (s, 1B, B5), −9.89–−11.04 (m, 5B, B4,6,9,10,12), −13.57 (s, 2B, B8,11), −15.23 (s, 2B, B2,3); UV (99.8% CH3CH2OH): λmax = 247, 394 nm, λmin = 226, 329 nm, λsh = 309 nm; FT-IR: νmax (cm–1) = 2928 (C-Haliphat), 2595 (B-H), 1697 (C = O), 1650 (C = O), 730 (B-B); RP-HPLC: tR = 20.61 min; APCI-MS: m/z: 596 [M + H]+, calcd for C25H37B10N5O5 = 595.
4-[(6-[3–(1,2-Dicarba-closo-dodecaborane-1-yl)propanamido]hexyl)amino]-N-[2-(dimethylamino)ethyl]-3-nitro-1,8-naphthalimide (16)
orange solid, yield: 8.6 mg (32%). TLC (MeOH/CH2Cl2, 3:7, v/v): Rf = 0.40; 1H-NMR (MeOH-d4, 600.26 MHz): δ (ppm) = 8.83 (s, 1H, Harom), 8.73 (d, J = 7.7 Hz, 1H, Harom), 8.51 (dd, J = 7.3, 0.9 Hz, 1H, Harom), 7.70 (dd, J = 8.5, 7.3 Hz, 1H, Harom), 4.53 (br s, 1H, CHcarborane), 4.20 (t, J = 6.9 Hz, 2H, CH2-N(CO)2), 3.90 (t, J = 7.0 Hz, 2H, CH2-NH), 3.17 (t, J = 7.0 Hz, 2H, CH2-NH), 2.78 (t, J = 6.9 Hz, 2H, CH2-N(CH3)2), 2.58 (dd, J = 8.8, 6.9 Hz, 2H, CH2-carborane), 2.47 (s, 6H, N(CH3)2), 2.40 (dd, J = 8.7, 6.8 Hz, 2H, NH-C(O)-CH2), 1.90–1.81 (m, 2H, CH2-CH2-CH2), 1.56–1.50 (m, 4H, 2 × CH2-CH2-CH2), 1.48–1.40 (m, 2H, CH2-CH2-CH2), 3.0–1.5 (m, 10H, B10H10); 13C-NMR (MeOH-d4, 150.95 MHz): δ (ppm) = 172.73 (1 C, C(O)-NH), 165.05, 164.00 (2 C, C11, C12), 151.45–111.08 (10 C, 10 Carom), 76.44 (1 C, Ccarborane), 63.95 (1 C, CHcarborane), 57.55 (1 C, CH2-N(CH3)2), 51.14 (1 C, CH2-NH), 45.45 (2 C, 2 × CH3), 40.26 (1 C, CH2-NH), 38.24 (1 C. CH2-N(CO)2), 35.94–34.20 (2 C, CH2-carborane and NH-C(O)-CH2), 31.76 (CH2-CH2-CH2), 30.14 (1 C, CH2-CH2-CH2), 27.50 (1 C, CH2-CH2-CH2), 27.43 (1 C, CH2-CH2-CH2); 11B-NMR {1H BB} (MeOH-d4, 192.59 MHz): δ (ppm) = −2.76 (s, 1B, B9), −6.06 (s, 1B, B12), −9.70 (s, 2B, B8,10), −11.90–−13.07 (m, 6B, B3,4,5,6,7,11); UV (99.8% CH3CH2OH): λmax = 246, 395 nm, λmin = 226, 328 nm, λsh = 307 nm; FT-IR: νmax (cm–1) = 2931 (C-Haliphat), 2577 (B-H), 1697 (C = O), 1648 (C = O), 723 (B-B); RP-HPLC: tR = 21.80 min; APCI-MS: m/z: 626 [M + H]+, calcd for C27H43B10N5O5 = 625.
4-[(6-[3–(1,7-Dicarba-closo-dodecaborane-1-yl)propanamido]hexyl)amino]-N-[2-(dimethylamino)ethyl]-3-nitro-1,8-naphthalimide (17)
orange solid, yield: 12 mg (41%). TLC (MeOH/CH2Cl2, 3:7, v/v): Rf = 0.40; 1H-NMR (MeOH-d4, 600.26 MHz): δ (ppm) = 8.82 (s, 1H, Harom), 8.73 (d, J = 8.5 Hz, 1H, Harom), 8.51 (d, J = 7.2 Hz, 1H, Harom), 7.70 (t, J = 7.9 Hz, 1H, Harom), 4.16 (t, J = 7.0 Hz, 2H, CH2-N(CO)2), 3.91 (t, J = 7.0 Hz, 2H, CH2-NH), 3.51 (br s, 1H, CHcarborane), 3.16 (t, J = 7.0 Hz, 2H, CH2-NH), 2.65 (t, J = 7.1 Hz, 2H, CH2-N(CH3)2), 2.37 (s, 6H, N(CH3)2), 2.30–2.25 (m, 4H, NH-C(O)-CH2 and CH2-carborane), 1.87 (dd, J = 14.4, 7.2 Hz, 2H, CH2-CH2-CH2), 1.57–1.50 (m, 4H, 2 × CH2-CH2-CH2), 1.47–1.40 (m, 2H, CH2-CH2-CH2), 3.0–1.5 (m, 10H, B10H10); 13C-NMR (MeOH-d4, 150.95 MHz): δ (ppm) = 173.21 (1 C, C(O)-NH), 165.06, 164.04 (2 C, C11, C12), 151.51–111.27 (10 C, 10 Carom), 57.62 (1 C, CH2-N(CH3)2), 57.05 (1 C, CHcarborane), 51.15 (1 C, CH2-NH), 45.69 (2 C, 2 × CH3), 40.23 (1 C, CH2-NH), 38.59 (1 C, CH2-N(CO)2), 36.76–33.51 (2 C, CH2-carborane and NH-C(O)-CH2), 31.77 (1 C, CH2-CH2-CH2), 30.14 (1 C, CH2-CH2-CH2), 27.50 (1 C, CH2-CH2-CH2), 27.42 (1 C, CH2-CH2-CH2); 11B-NMR {1H BB} (MeOH-d4, 192.59 MHz): δ (ppm) = −4.49 (s, 1B, B5), −9.88–−11.01 (m, 5B, B4,6,9,10,12), −13.55 (s, 2B, B8,11), −15.17 (s, 2B, B2,3); UV (99.8% CH3CH2OH): λmax = 246, 395 nm, λmin = 225, 328 nm, λsh = 306 nm; FT-IR: νmax (cm–1) = 2933 (C-Haliphat), 2593 (B-H), 1697 (C = O), 1648 (C = O), 729 (B-B); RP-HPLC: tR = 21.70 min; APCI-MS: m/z: 626 [M + H]+, calcd for C27H43B10N5O5 = 625.
4-[(6-[3–(1,2-Dicarba-closo-dodecaborane-1-yl)propanamido]hexyl)amino]-3-nitro-N-[2-(N-pyrrolidinyl)ethyl]-1,8-naphthalimide (18)
orange solid, yield: 16.7 mg (47%). TLC (MeOH/CH2Cl2, 3:7, v/v): Rf = 0.38; 1H-NMR (MeOH-d4, 600.26 MHz): δ (ppm) = 8.83 (s, 1H, Harom), 8.75 (d, J = 7.9 Hz, 1H, Harom), 8.53 (dd, J = 7.4, 0.8 Hz, 1H, Harom), 7.72 (dd, J = 8.4, 7.4 Hz, 1H, Harom), 4.53 (br s, 1H, CHcarborane), 4.31 (t, J = 6.3 Hz, 2H, CH2-N(CO)2), 3.90 (t, J = 6.9 Hz, 2H, CH2-NH), 3.27 (t, J = 6.3 Hz, 2H, CH2-pyrrolidine), 3.21 (br s, 4H, 2 × N-CH2pyrrolidine-CH2), 3.17 (t, J = 7.0 Hz, 2H, CH2-NH), 2.58 (dd, J = 8.8, 6.8 Hz, 2H, CH2-carborane), 2.40 (dd, J = 8.8, 6.8 Hz, 2H, NH-C(O)-CH2), 2.03–1.98 (m, 4H, 2 × CH2-CH2pyrrolidine-CH2), 1.89–1.83 (m, 2H, CH2-CH2-CH2), 1.57–1.50 (m, 4H, 2 × CH2-CH2-CH2), 1.46–1.41 (m, 2H, CH2-CH2-CH2), 3.0–1.5 (m, 10H, B10H10); 13C-NMR (MeOH-d4, 150.95 MHz): δ (ppm) = 172.73 (1 C, C(O)-NH), 165.19, 164.12 (2 C, C11, C12), 151.49–110.82 (10 C, 10 Carom), 76.44 (1 C, Ccarborane), 63.94 (1 C, CHcarborane), 55.62 (2 C, 2 × N-CH2pyrrolidine-CH2), 54.40 (1 C, CH2-pyrrolidine), 51.12 (1 C, CH2-NH), 40.26 (1 C, CH2-NH), 38.39 (1 C, CH2-N(CO)2), 35.94–34.20 (2 C, CH2-carborane and NH-C(O)-CH2), 31.72 (1 C, CH2-CH2-CH2), 30.12 (1 C, CH2-CH2-CH2), 27.48 (1 C, CH2-CH2-CH2), 27.41 (1 C, CH2-CH2-CH2), 24.11 (2 C, 2 × CH2-CH2pyrrolidine-CH2); 11B-NMR {1H BB} (MeOH-d4, 192.59 MHz): δ (ppm) = −2.75 (s, 1B, B9), −5.97 (s, 1B, B12), −9.68 (s, 2B, B8,10), −11.77–−13.00 (m, 6B, B3,4,5,6,7,11); UV (99.8% CH3CH2OH): λmax = 246, 395 nm, λmin = 226, 329 nm, λsh = 309 nm; FT-IR: νmax (cm–1) = 2931 (C-Haliphat), 2576 (B-H), 1697 (C = O), 1648 (C = O), 722 (B-B); RP-HPLC: tR = 22.05 min; APCI-MS: m/z: 652 [M + H]+, calcd for C29H45B10N5O5 = 651.
4-[(6-[3–(1,7-Dicarba-closo-dodecaborane-1-yl)propanamido]hexyl)amino]-3-nitro-N-[2-(N-pyrrolidinyl)ethyl]-1,8-naphthalimide (19)
orange solid, yield: 14.1 mg (39%). TLC (MeOH/CH2Cl2, 3:7, v/v): Rf = 0.40; 1H-NMR (MeOH-d4, 600.26 MHz): δ (ppm) = 8.82 (s, 1H, Harom), 8.75 (d, J = 8.5 Hz, 1H, Harom), 8.52 (d, J = 7.3 Hz, 1H, Harom), 7.72 (dd, J = 8.4, 7.4 Hz, 1H, Harom), 4.29 (t, J = 6.3 Hz, 2H, CH2-N(CO)2), 3.90 (t, J = 7.0 Hz, 2H, CH2-NH), 3.50 (br s, 1H, CHcarborane), 3.22 (t, J = 6.4 Hz, 2H, CH2-pyrrolidine), 3.17–3.14 (m, 6H, CH2-NH and 2 × N-CH2pyrrolidine-CH2), 2.30–2.22 (m, 4H, NH-C(O)-CH2 and CH2-carborane), 2.00–1.96 (m, 4H, 2 × CH2-CH2pyrrolidine-CH2), 1.90–1.84 (m, 2H, CH2-CH2-CH2), 1.57–1.51 (m, 4H, 2 × CH2-CH2-CH2), 1.46–1.42 (m, 2H, CH2-CH2-CH2), 3.0–1.5 (m, 10H, B10H10); 13C-NMR (MeOH-d4, 150.95 MHz): δ (ppm) = 173.21 (1 C, C(O)-NH), 165.14, 164.07 (2 C, C11, C12), 151.45–110.85 (10 C, 10 Carom), 76.78 (1 C, Ccarborane), 57.06 (1 C, CHcarborane), 55.56 (2 C, 2 × N-CH2pyrrolidine-CH2), 54.44 (1 C, CH2-pyrrolidine), 51.11 (1 C, CH2-NH), 40.23 (1 C, CH2-NH), 38.57 (1 C, CH2-N(CO)2), 36.77–33.50 (2 C, CH2-carborane and NH-C(O)-CH2), 31.71 (1 C, CH2-CH2-CH2), 30.13 (1 C, CH2-CH2-CH2), 27.49 (1 C, CH2-CH2-CH2), 27.41 (1 C, CH2-CH2-CH2), 24.13 (2 C, 2 × CH2-CH2pyrrolidine-CH2); 11B-NMR {1H BB} (MeOH-d4, 192.59 MHz): δ (ppm) = −4.45 (s, 1B, B5), −9.83–−10.99 (m, 5B, B4,6,9,10,12), −13.54 (s, 2B, B8,11), −15.15 (s, 2B, B2,3); UV (99.8% CH3CH2OH): λmax = 246, 395 nm, λmin = 226, 328 nm, λsh = 307 nm; FT-IR: νmax (cm–1) = 2933 (C-Haliphat), 2593 (B-H), 1698 (C = O), 1650 (C = O), 729 (B-B); RP-HPLC: tR = 21.91 min; APCI-MS: m/z: 652 [M + H]+, calcd for C29H45B10N5O5 = 651.
Synthesis of 1,8-naphthalimide derivatives 30–37 modified with carborane cluster via reductive amination
4-[(2-Aminoethyl)amino]-N-[2-(dimethylamino)ethyl]-3-nitro-1,8-naphthalimide (6), 4-[(2-aminoethyl)amino]-3-nitro-N-[2-(N-pyrrolidinyl)ethyl]-1,8-naphthalimide (7), 4-[(6-aminohexyl)amino]-N-[2-(dimethylamino)ethyl]-3-nitro-1,8-naphthalimide (8), or 4-[(6-aminohexyl)amino]-3-nitro-N-[2-(N-pyrrolidinyl)ethyl]-1,8-naphthalimide (9) was dissolved in anhydrous MeOH (3 ml per 0.1 mmol), and 2–(1,2-dicarba-closo-dodecaborane-1-yl)ethanal (20) (1.35 equiv.) or 2–(1,7-dicarba-closo-dodecaborane-1-yl)ethanal (21) (1.35 equiv.) was added. The reaction mixture was stirred for 24 h at 70 °C under an inert (Ar) atmosphere. Then, NaBH3CN (3.5 equiv.) was added to the Schiff base 22–29, and the reaction mixture was stirred for 24 h at rt under an inert (Ar) atmosphere. Subsequently, the solvent was evaporated to dryness under vacuum, and the crude product was purified by column chromatography on silica gel (230–400 mesh) with a gradient of MeOH (3–15%) in CH2Cl2 as the eluent. Additionally, the purified products 34–37 were dissolved in MeOH/CH2Cl2 (1:39, v/v) and washed with the same volume of NaHCO3 (2.5%) and thrice with water. The organic phase was separated, dried over MgSO4, filtered, and evaporated to dryness. Then, the product was purified again by column chromatography under the same conditions as described above.
4-[(2-[(1,2-Dicarba-closo-dodecaborane-1-yl)ethylamino]ethyl)amino]-N-[2-(dimethylamino)ethyl]-3-nitro-1,8-naphthalimide (30)
orange solid, yield: 7.5 mg (40%). TLC (MeOH/CH2Cl2, 3:7, v/v): Rf = 0.35; 1H-NMR (CDCl3, 600.26 MHz): δ (ppm) = 10.18 (br s, 1H, NH), 9.20 (s, 1H, Harom), 8.65 (d, J = 7.2 Hz, 1H, Harom), 8.59 (d, J = 8.3 Hz, 1H, Harom), 7.67 (t, J = 7.9 Hz, 1H, Harom), 4.28 (t, J = 7.0 Hz, 2H, CH2-N(CO)2), 3.99 (dd, J = 10.6, 4.8 Hz, 2H, CH2-NH), 3.88 (br s, 1H, CHcarborane), 2.97 (t, J = 5.5 Hz, 2H, CH2-NH), 2.88 (t, J = 7.3 Hz, 2H, CH2-CH2-carborane), 2.65 (t, J = 6.8 Hz, 2H, CH2-N(CH3)2), 2.48 (t, J = 7.2 Hz, 2H, CH2-carborane), 2.36 (s, 6H, N(CH3)2), 3.0–1.5 (m, 10H, B10H10); 13C-NMR (CDCl3, 150.95 MHz): δ (ppm) = 163.89, 162.72 (2 C, C11, C12), 150.64–111.23 (10 C, 10 Carom), 73.27 (1 C, Ccarborane), 61.57 (1 C, CHcarborane), 57.07 (1 C, CH2-N(CH3)2), 49.77 (1 C, CH2-NH), 49.28 (1 C, CH2-NH), 48.25 (1 C CH2-CH2-carborane), 45.86 (2 C, 2 × CH3), 38.26 (1 C, CH2-N(CO)2), 38.23 (1 C, CH2-carborane); 11B-NMR {1H BB} (CDCl3, 192.59 MHz): δ (ppm) = −2.20 (s, 1B, B9), −5.49 (s, 1B, B12), −9.34 (s, 2B, B8,10), −11.53–−12.91 (m, 6B, B3,4,5,6,7,11); UV (99.8% CH3CH2OH): λmax = 247, 397 nm, λmin = 226, 329 nm, λsh = 305 nm; FT-IR: νmax (cm–1) = 2922 (C-Haliphat), 2579 (B-H), 1695 (C = O), 1649 (C = O), 723 (B-B); RP-HPLC: tR = 17.56 min; APCI-MS: m/z: 542 [M + H]+, calcd for C22H35B10N5O4 = 541.
4-[(2-[(1,7-Dicarba-closo-dodecaborane-1-yl)ethylamino]ethyl)amino]-N-[2-(dimethylamino)ethyl]-3-nitro-1,8-naphthalimide (31)
orange solid, yield: 8.5 mg (42%). TLC (MeOH/CH2Cl2, 3:7, v/v): Rf = 0.34; 1H-NMR (CDCl3, 600.26 MHz): δ (ppm) = 10.18 (br 1H, NH), 9.23 (s, 1H, Harom), 8.64 (d, J = 7.3 Hz, 1H, Harom), 8.60 (d, J = 8.5 Hz, 1H, Harom), 7.66 (t, J = 7.9 Hz, 1H, Harom), 4.28 (t, J = 6.9 Hz, 2H, CH2-N(CO)2), 3.95 (dd, J = 10.7, 4.9 Hz, 2H, CH2-NH), 2.96–2.92 (m, 3H, CHcarborane overlapped with CH2-NH), 2.73 (t, J = 7.8 Hz, 2H, CH2-CH2-carborane), 2.66 (t, J = 6.8 Hz, 2H, CH2-N(CH3)2), 2.35 (s, 6H, N(CH3)2), 2.19 (t, J = 7.7 Hz, 2H, CH2-carborane), 3.0–1.5 (m, 10H, B10H10); 13C-NMR (CDCl3, 150.95 MHz): δ (ppm) = 163.88, 162.77 (2 C, C11, C12), 150.64–110.99 (10 C, 10 Carom), 73.93 (1 C, Ccarborane), 57.06 (1 C, CH2-N(CH3)2), 55.21 (1 C, CHcarborane), 49.79 (1 C, CH2-NH), 49.01 (1 C, CH2-NH), 48.81 (1 C, CH2-CH2-carborane), 45.86 (2 C, 2CH3), 38.26 (1 C, CH2-N(CO)2), 36.92 (1 C, CH2-carborane); 11B-NMR {1H BB} (CDCl3, 192.59 MHz): δ (ppm) = −4.20 (s, 1B, B5), −9.65–−10.73 (m, 5B, B4,6,9,10,12), −13.51 (s, 2B, B8,11), −15.22 (s, 2B, B2,3); UV (99.8% CH3CH2OH): λmax = 246, 397 nm, λmin = 225, 328 nm, λsh = 306 nm; FT-IR: νmax (cm–1) = 2926 (C-Haliphat), 2592 (B-H), 1693 (C = O), 1648 (C = O), 729 (B-B); RP-HPLC: tR = 16.17 min; APCI-MS: m/z: 542 [M + H]+, calcd for C22H35B10N5O4 = 541.
4-[(2-[(1,2-Dicarba-closo-dodecaborane-1-yl)ethylamino]ethyl)amino]-3-nitro-N-[2-(N-pyrrolidinyl)ethyl]-1,8-naphthalimide (32)
orange solid, yield: 10 mg (43%). TLC (MeOH/CH2Cl2, 3:7, v/v): Rf = 0.34; 1H-NMR (DMSO-d6, 600.26 MHz): δ (ppm) = 8.86 (d, J = 8.1 Hz, 1H, Harom), 8.83 (s, 1H, Harom), 8.53 (dd, J = 7.4, 0.8 Hz, 1H, Harom), 7.78 (dd, J = 8.3, 7.5 Hz, 1H, Harom), 5.17 (br s, 1H, CHcarborane), 4.15 (t, J = 6.8 Hz, 2H, CH2-N(CO)2), 3.85 (t, J = 5.4 Hz, 2H, CH2-NH), 2.84–2.78 (m, 4H, CH2-NH overlapped with CH2-pyrrolidine), 2.70–2.63 (m, 6H, CH2-CH2-carborane overlapped with 2 × N-CH2pyrrolidine-CH2), 2.41 (t, J = 7.5 Hz, 2H, CH2-carborane), 1.71 (br s, 4H, 2 × CH2-CH2pyrrolidine-CH2), 3.0–1.5 (m, 10H, B10H10); 13C-NMR (DMSO-d6, 150.95 MHz): δ (ppm) = 163.12, 162.02 (2 C, C11, C12), 149.99–109.16 (10 C, 10 Carom), 74.78 (1 C, Ccarborane), 62.78 (1 C, CHcarborane), 53.78 (2 C, 2 × N-CH2pyrrolidine-CH2), 52.79 (1 C, CH2-pyrrolidine), 48.85–47.61 (3 C, 2 × CH2-NH and CH2-CH2-carborane), 38.15 (1 C, CH2-N(CO)2), 36.60 (1 C, CH2-carborane), 23.11 (2 C, 2 × CH2-CH2pyrrolidine-CH2); 11B-NMR {1H BB} (DMSO-d6, 192.59 MHz): δ (ppm) = −3.25 (s, 1B, B9), −6.16 (s, 1B, B12), −9.94–−12.93 (m, 8B, B3,4,5,6,7,8,10,11); UV (99.8% CH3CH2OH): λmax = 246, 397 nm, λmin = 226, 328 nm, λsh = 307 nm; FT-IR: νmax (cm–1) = 2958 (C-Haliphat), 2579 (B-H), 1694 (C = O), 1649 (C = O), 728 (B-B); RP-HPLC: tR = 17.42 min; APCI-MS: m/z: 568 [M + H]+, calcd for C24H37B10N5O4 = 567.
4-[(2-[(1,7-Dicarba-closo-dodecaborane-1-yl)ethylamino]ethyl)amino]-3-nitro-N-[2-(N-pyrrolidinyl)ethyl]-1,8-naphthalimide (33)
orange solid, yield: 5.1 mg (40%). TLC (MeOH/CH2Cl2, 3:7, v/v): Rf = 0.34; 1H-NMR (CDCl3, 600.26 MHz): δ (ppm) = 10.18 (br s, 1H, NH), 9.23 (s, 1H, Harom), 8.64 (d, J = 7.3 Hz, 1H, Harom), 8.59 (d, J = 8.5 Hz, 1H, Harom), 7.66 (t, J = 7.9 Hz, 1H, Harom), 4.35 (t, J = 7.1 Hz, 2H, CH2-N(CO)2), 3.95 (dd J = 10.7, 4.9 Hz, 2H, CH2-NH), 2.99–2.92 (m, 3H, CHcarborane overlapped with CH2-NH), 2.88 (br s, 2H, CH2-pyrrolidine), 2.80–2.69 (m, 6H, CH2-CH2-carborane overlapped with 2 × N-CH2pyrrolidine-CH2), 2.19 (t, J = 7.8 Hz, 2H, CH2-carborane), 1.83 (br s, 4H, 2 × CH2-CH2pyrrolidine-CH2), 3.0–1.5 (m, 10H, B10H10); 13C-NMR (CDCl3, 150.95 MHz): δ (ppm) = 163.89, 162.77 (2 C, C11, C12), 150.69–111.0 (10 C, 10 Carom), 73.92 (1 C, Ccarborane), 55.21 (1 C, CHcarborane), 54.55 (2 C, 2 × N-CH2pyrrolidine-CH2), 53.76 (1 C, CH2-pyrrolidine), 49.81–48.82 (3 C, 2 × CH2-NH and CH2-CH2-carborane), 39.05 (1 C, CH2-N(CO)2), 36.93 (1 C, CH2-carborane), 23.72 (2 C, 2 × CH2-CH2pyrrolidine-CH2); 11B-NMR {1H BB} (CDCl3, 192.59 MHz): δ (ppm) = −4.22 (s, 1B, B5), −9.72–−10.73 (m, 5B, B4,6,9,10,12), −13.52 (s, 2B, B8,11), −15.23 (s, 2B, B2,3); UV (99.8% CH3CH2OH): λmax = 246, 397 nm, λmin = 226, 328 nm, λsh = 310 nm; FT-IR: νmax (cm–1) = 2920 (C-Haliphat), 2589 (B-H), 1692 (C = O), 1649 (C = O), 730 (B-B); RP-HPLC: tR = 17.48 min; APCI-MS: m/z: 568 [M + H]+, calcd for C24H37B10N5O4 = 567.
4-[(6-[(1,2-Dicarba-closo-dodecaborane-1-yl)ethylamino]hexyl)amino]-N-[2-(dimethylamino)ethyl]-3-nitro-1,8-naphthalimide (34)
orange solid, yield: 11.1 mg (28%). TLC (MeOH/CH2Cl2, 3:7, v/v): Rf = 0.32; 1H-NMR (acetone-d6, 600.26 MHz): δ (ppm) = 9.77 (br s, 1H, NH), 9.02 (s, 1H, Harom), 8.92 (dd, J = 8.5, 1.0 Hz, 1H, Harom), 8.60 (dd, J = 7.3, 0.9 Hz, 1H, Harom), 7.81 (dd, J = 8.5, 7.5 Hz, 1H, Harom), 4.93 (br s, 1H, CHcarborane), 4.20 (t, J = 6.9 Hz, 2H, CH2-N(CO)2), 4.05 (t, J = 6.9 Hz, 2H, CH2-NH), 2.77 (t, J = 7.1 Hz, 2H, CH2-NH), 2.61–2.54 (m, 4H, CH2-CH2-carborane overlapped with CH2-N(CH3)2), 2.50 (t, J = 7.1, 2H, CH2-carborane), 2.27 (s, 6H, N(CH3)2), 1.93–1.87 (m, 2H, CH2-CH2-CH2), 1.55–1.45 (m, 4H, 2 × CH2-CH2-CH2), 1.45–1.39 (m, 2H, CH2-CH2-CH2), 3.0–1.5 (m, 10H, B10H10); 13C-NMR (acetone-d6, 150.95 MHz): δ (ppm) = 163.23, 162.19 (2 C, C11, C12), 150.50–110.63 (10 C, 10 Carom), 75.05 (1 C, Ccarborane), 61.89 (1 C, CHcarborane), 56.69 (1 C, CH2-N(CH3)2), 50.11–48.20 (3 C, 2 × CH2-NH and CH2-CH2-carborane), 45.05 (2 C, 2 × CH3), 37.74 (1 C, CH2-carborane), 36.68 (1 C, CH2-N(CO)2), 30.64 (1 C, CH2-CH2-CH2), 29.46 (1 C, signal of CH2-CH2-CH2 overlapped with acetone), 26.58 (1 C, CH2-CH2-CH2), 26.31 (1 C, CH2-CH2-CH2); 11B-NMR {1H BB} (acetone-d6, 192.59 MHz): δ (ppm) = −3.03 (s, 1B, B9), −6.03 (s, 1B, B12), −9.95–−13.21 (m, 8B, B3,4,5,6,7,8,10,11); UV (99.8% CH3CH2OH): λmax = 246, 395 nm, λmin = 228, 326 nm, λsh = 307 nm; FT-IR: νmax (cm–1) = 2934 (C-Haliphat), 2572 (B-H), 1697 (C = O), 1650 (C = O), 724 (B-B); RP-HPLC: tR = 17.51 min; APCI-MS: m/z: 598 [M + H]+, calcd for C26H43B10N5O4 = 597; HRMS (ESI+) 598.4420 [M + H]+, calcd for C26H43B10N5O4 = 597.4318.
4-[(6-[(1,7-Dicarba-closo-dodecaborane-1-yl)ethylamino]hexyl)amino]-N-[2-(dimethylamino)ethyl]-3-nitro-1,8-naphthalimide (35)
orange solid, yield: 12.3 mg (31%). TLC (MeOH/CH2Cl2, 3:7, v/v): Rf = 0.31; 1H-NMR (MeOH-d4, 600.26 MHz): δ (ppm) = 8.93 (s, 1H, Harom), 8.78 (d, J = 8.5 Hz, 1H, Harom), 8.56 (d, J = 7.3 Hz, 1H, Harom), 7.73 (dd, J = 8.3, 7.5 Hz, 1H, Harom), 4.22 (t, J = 7.0 Hz, 2H, CH2-N(CO)2), 3.93 (t, J = 6.9 Hz, 2H, CH2-NH), 3.54 (br s, 1H, CHcarborane), 2.71–2.60 (m, 6H, CH2-NH and CH2-CH2-carborane overlapped with CH2-N(CH3)2), 2.38 (s, 6H, N(CH3)2), 2.22–2.17 (m, 2H, CH2-carborane), 1.90–1.84 (m, 2H, CH2-CH2-CH2), 1.57–1.50 (m, 4H, 2 × CH2-CH2-CH2), 1.46–1.41 (m, 2H, CH2-CH2-CH2), 3.0–1.5 (m, 10H, B10H10); 13C-NMR (MeOH-d4, 150.95 MHz): δ (ppm) = 165.13, 164.13 (2 C, C11, C12), 151.61–111.39 (10 C, 10 Carom), 74.93 (1 C, Ccarborane), 57.66 (1 C, CH2-N(CH3)2), 57.10 (1 C, CHcarborane), 51.18–49.85 (3 C, 2 × CH2-NH and CH2-CH2-carborane), 45.70 (2 C, 2 × CH3), 38.59 (1 C, CH2-N(CO)2), 36.29 (1 C, CH2-carborane), 31.70 (1 C, CH2-CH2-CH2), 29.69 (1 C, CH2-CH2-CH2), 27.67 (1 C, CH2-CH2-CH2), 27.50 (1 C, CH2-CH2-CH2); 11B-NMR {1H BB} (MeOH-d4, 192.59 MHz): δ (ppm) = −4.47 (s, 1B, B5), −9.76–−11.00 (m, 5B, B4,6,9,10,12), −13.52 (s, 2B, B8,11), −15.16 (s, 2B, B2,3); UV (99.8% CH3CH2OH): λmax = 246, 394 nm, λmin = 227, 328 nm, λsh = 309 nm; FT-IR: νmax (cm–1) = 2928 (C-Haliphat), 2593 (B-H), 1697 (C = O), 1651 (C = O), 730 (B-B); RP-HPLC: tR = 18.24 min; APCI-MS: m/z: 598 [M + H]+, calcd for C26H43B10N5O4 = 597; HRMS (ESI+) 598.4412 [M + H]+, calcd for C26H43B10N5O4 = 597.4318.
4-[(6-[(1,2-Dicarba-closo-dodecaborane-1-yl)ethylamino]hexyl)amino]-3-nitro-N-[2-(N-pyrrolidinyl)ethyl]-1,8-naphthalimide (36)
orange solid, yield: 8 mg (31%). TLC (MeOH/CH2Cl2, 3:7, v/v): Rf = 0.30; 1H-NMR (acetone-d6, 600.26 MHz): δ (ppm) = 9.77 (br s, 1H, NH), 8.99 (s, 1H, Harom), 8.90 (d, J = 8.5 Hz, 1H, Harom), 8.58 (d, J = 7.3 Hz, 1H, Harom), 7.79 (dd, J = 8.3, 7.5 Hz, 1H, Harom), 4.93 (br s, 1H, CHcarborane), 4.25 (t, J = 6.9 Hz, 2H, CH2-N(CO)2), 4.04 (t, J = 6.9 Hz, 2H, CH2-NH), 2.83 (t, J = 6.9 Hz, 2H, CH2-pyrrolidine), 2.77 (t, J = 7.1 Hz, 2H, CH2-NH), 2.69 (br s, 4H, N-CH2pyrrolidine-CH2), 2.56 (t, J = 6.9 Hz, 2H, CH2-carborane), 2.51 (t, J = 7.1 Hz, 2H, CH2-CH2-carborane), 1.93–1.88 (m, 2H, CH2-CH2-CH2), 1.78–1.73 (m, 4H, 2 × CH2-CH2pyrrolidine-CH2), 1.54–1.47 (m, 4H, 2 × CH2-CH2-CH2), 1.45–1.40 (m, 2H, CH2-CH2-CH2), 3.0–1.5 (m, 10H, B10H10); 13C-NMR (acetone-d6, 150.95 MHz): δ (ppm) = 164.13, 163.09 (2 C, C11, C12), 151.33–111.50 (10 C, 10 Carom), 75.90 (1 C, Ccarborane), 62.79 (1 C, CHcarborane), 54.85 (2 C, 2 × N-CH2pyrrolidine-CH2), 54.07 (1 C, CH2-pyrrolidine), 50.95–49.04 (3 C, 2 × CH2-NH and CH2-CH2-carborane), 39.42 (1 C, CH2-N(CO)2), 37.51 (1 C, CH2-carborane), 31.50 (1 C, CH2-CH2-CH2), 30.35 (signal of CH2-CH2-CH2 overlapped with acetone), 27.44 (1 C, CH2-CH2-CH2), 27.18 (1 C, CH2-CH2-CH2), 24.24 (2 C, 2 × CH2-CH2pyrrolidine-CH2), 11B-NMR {1H BB} (acetone-d6, 192.59 MHz): δ (ppm) = −3.01 (s, 1B, B9), −6.05 (s, 1B, B12), −9.93–−13.17 (m, 8B, B3,4,5,6,7,8,10,11); UV (99.8% CH3CH2OH): λmax = 246, 394 nm, λmin = 227, 326 nm, λsh = 307 nm; FT-IR: νmax (cm–1) = 2926 (C-Haliphat), 2580 (B-H), 1697 (C = O), 1651 (C = O), 722 (B-B); RP-HPLC: tR = 18.32 min; APCI-MS: m/z: 624 [M + H]+, calcd for C28H45B10N5O4 = 623; HRMS (ESI+) 624.4568 [M + H]+, calcd for C28H45B10N5O4 = 623.4475.
4-[(6-[(1,7-Dicarba-closo-dodecaborane-1-yl)ethylamino]hexyl)amino]-3-nitro-N-[2-(N-pyrrolidinyl)ethyl]-1,8-naphthalimide (37)
orange solid, yield: 8.5 mg (33%). TLC (MeOH/CH2Cl2, 3:7, v/v): Rf = 0.32; 1H-NMR (MeOH-d4, 600.26 MHz): δ (ppm) = 8.79 (s, 1H, Harom), 8.72 (d, J = 8.1 Hz, 1H, Harom), 8.49 (d, J = 7.3 Hz, 1H, Harom), 7.68 (dd, J = 8.4, 7.6 Hz, 1H, Harom), 4.17 (t, J = 7.1 Hz, 2H, CH2-N(CO)2), 3.90 (t, J = 6.9 Hz, 2H, CH2-NH), 3.53 (br s, 1H, CHcarborane), 2.86 (t, J = 7.1 Hz, 2H, CH2-pyrrolidine), 2.78 (br s, 4H, 2 × N-CH2pyrrolidine-CH2), 2.68–2.60 (m, 4H, CH2-carborane overlapped with CH2-NH), 2.22–2.16 (m, 2H, CH2-CH2-carborane), 1.88–1.82 (m, 6H, 2 × CH2-CH2pyrrolidine-CH2 overlapped with CH2-CH2-CH2), 1.58–1.50 (m, 4H, 2 × CH2-CH2-CH2), 1.47–1.40 (m, 2H, CH2-CH2-CH2), 3.0–1.5 (m, 10H, B10H10); 13C-NMR (MeOH-d4, 150.95 MHz): δ (ppm) = 163.56, 162.51 (2 C, C11, C12), 150.06–109.76 (10 C, 10 Carom), 75.55 (1 C, Ccarborane), 55.72 (1 C, CHcarborane), 53.94 (2 C, 2 × N-CH2pyrrolidine-CH2), 53.14 (1 C, CH2-pyrrolidine), 49.75–48.45 (3 C, 2 × CH2-NH and CH2-CH2-carborane), 38.06 (1 C, CH2-N(CO)2), 34.87 (1 C, CH2-carborane), 30.29 (1 C, CH2-CH2-CH2), 28.28 (1 C CH2-CH2-CH2), 26.29 (1 C, CH2-CH2-CH2), 26.11 (1 C, CH2-CH2-CH2), 22.83 (2 C, 2 × CH2-CH2pyrrolidine-CH2); 11B-NMR {1H BB} (MeOH-d4, 192.59 MHz): δ (ppm) = −4.46 (s, 1B, B5), −9.65–−10.93 (m, 5B, B4,6,9,10,12), −13.49 (s, 2B, B8,11), −15.13 (s, 2B, B2,3); UV (99.8% CH3CH2OH): λmax = 246, 395 nm, λmin = 225, 326 nm, λsh = 309 nm; FT-IR: νmax (cm–1) = 2930 (C-Haliphat), 2592 (B-H), 1697 (C = O), 1634 (C = O), 729 (B-B); RP-HPLC: tR = 18.08 min; APCI-MS: m/z: 624 [M + H]+, calcd for C28H45B10N5O4 = 623; HRMS (ESI+) 624.4566 [M + H]+, calcd for C28H45B10N5O4 = 623.4475.
Physicochemical investigation with DNA
Materials
ct-DNA was purchased from Sigma (USA) and used without purification. Sodium cacodylate (used for the preparation of cacodylate buffer) was purchased from Acros Organics (Geel, Belgium). Water was obtained from a Milli-Q purification system. All experiments were performed with freshly prepared solutions.
Preparation of ct-DNA
The ct-DNA was dissolved in H2O and reconstituted overnight at 4 °C to dissolve all the material. The molar concentration of ct-DNA was determined from UV–vis spectra based on the molar absorption coefficient (ε) of 6600 M–1 cm−1 at 260 nm. The purity of ct-DNA was confirmed using UV–vis spectroscopy by measuring the ratio of absorbance at 260 to 280 nm, and the value was found to be ≥1.8, indicating that DNA was sufficiently free of proteins.
Tm measurements
The measurements were carried out by adding aliquots of DMSO stock solution of the tested compounds to the buffer solution (pH 7.0, 20 mM, cacodylate buffer, DMSO content of the final solution = 0.33–0.39%). Tm curves were collected at r = 0.3 (r = [compound]/[ct-DNA]) to assure the dominant binding mode. Thermal melting curves were plotted considering the absorption change at 260 nm as a function of temperature using a GBC Cintra10 UV–VIS spectrometer (Dandenong, Australia) equipped with a GBC Thermocell Peltier Power Supply (Dandenong, Australia) with the use of a 1-cm-path-length cell. The absorbance of the samples was monitored at 260 nm from 35 to 95 °C with a heating rate of 1 °C/min. Tm values are the midpoints or the transition curves determined from the maximum of the first derivative. ΔTm values were calculated by subtracting the Tm of the free nucleic acid from the Tm of the sample. All ΔTm values reported in the study were measured in triplicate. The error in ΔTm was ±0.5 °C.
CD Measurements
The measurements were performed by adding aliquots of DMSO stock solution of the tested compounds to the buffer solution (pH 7.0, 20 mM, cacodylate buffer, DMSO content of the final solutions = 0.22–1.30%). Changes in the CD spectrum of ct-DNA upon the addition of compound were measured at different molar ratios r = [compound]/[ct-DNA]. CD spectra were recorded on a JASCO J-815 CD spectrometer with a JASCO PFD-425S Peltier thermostated cell holder (JASCO, Tokyo, Japan) by using a square quartz cuvette of path length 0.5 cm (0.5 ml) in the 230–400 nm region. The CD profiles reported were an average of three successive scans with a scan time of 200 nm per minute and an appropriately corrected baseline. Temperature was maintained at 20 °C during the experiment.
UV–vis spectra titration
The measurements were performed by adding aliquots of DMSO stock solution of the tested compounds to the buffer solution (pH 7.4, 20 mM, 50 mM NaCl, Tris–HCl buffer, DMSO content of the final solutions = 0.54–0.65%) to the final concentration 10 µM. The tested compounds were incubated for 5 min, with increasing concentrations ranging from 0 to 15 µM of ct-DNA at 37 °C. Then, the UV–vis absorption spectra between 300 and 500 nm were recorded using a GBC Cintra10 UV–VIS spectrometer equipped with a GBC Thermocell Peltier Power Supply with the use of a 1-cm-path-length cell. The binding constant was calculated according to the following equationCitation70:
where Kb is the binding constant; A0 and a are absorbances of the free tested compound and the apparent one; εG and εH–G are their coefficient, respectively; [DNA] is the concentration of DNA in base pairs. The slope to intercept ratio of the plot between A0/A − A0 and 1/[DNA] yielded the binding constant.
Biological investigation
Cytotoxicity assay
The cytotoxic properties of the synthesised compounds were evaluated using the human hepatocellular carcinoma cell line (HepG2) and human lung fibroblasts (MRC-5). The HepG2 and MRC-5 cell lines were purchased from American Type Culture Collection (ATCC, Manassas, VA, USA). The HepG2 cells were propagated in Eagle’s minimal essential medium (EMEM, ATCC, Manassas, VA, USA), supplemented with 10% inactivated foetal bovine serum (FBS, Life Technologies, Warsaw, Poland) and 100 units/ml penicillin G with 100 mg/ml streptomycin (Life Technologies, Warsaw, Poland). The cells were incubated at 37 °C in a humidified atmosphere containing 5% CO2. Upon reaching 80–90% confluency, the cells were harvested with 0.25% trypsin in 1 mM EDTA (Life Technologies, Warsaw, Poland) and transferred to 96-well microplates at 2 × 10⁴ cells/well. After overnight incubation of cells at 37 °C in a humidified atmosphere containing 5% CO2, the culture medium was removed and replaced with a freshly prepared solution of compounds in the culture medium or medium itself as the control group. The stock solutions of each compound were prepared in DMSO at a concentration of 100 mM and were diluted with the growth medium supplemented with 10% FBS to ensure drug dissolution to obtain concentrations ranging from 0.1 to 1000 µM. Cytotoxicity was evaluated using the MTT assay. After incubation with the compounds, the cells were treated with MTT dye solution (5 mg/ml) for 2 h and lysed with a solvent solution containing DMF (45 ml), sodium dodecylsulfate (13.5 g), and distilled water (55 ml). After overnight incubation at 37 °C, optical density at 550 nm, with a reference wavelength of 670 nm, was measured in an ELISA reader (VarioskanLux, Thermo Scientific, Waltham, MA, USA). All determinations were carried out in triplicate. Results were calculated as the percentage of control group viability. The IC50 values of the compounds were calculated in an Excel add-in ED50V10.
Apoptosis/necrosis assay by flow cytometry
Apoptosis/necrosis assay was carried out by double staining of cells with YO-PRO-1 (Thermo Fisher Scientific) and propidium iodide (PI, Sigma-Aldrich) fluorescent dyes. Briefly, HepG2 cells (2 × 10⁵) were seeded onto 6-well plates. The next day, the cells were treated for 24 h with the analysed compounds at a concentration corresponding to half of their IC50 (34–2.5 µM, 35–2.3 µM, 36–2 µM, 37–2.3 µM)and total IC50 values (34–5 µM, 35–4.5 µM, 36–4 µM, 37–4.5 µM). Subsequently, the cells were detached with trypsin (Thermo Fisher Scientific), washed twice with DPBS (1 ml) (Thermo Fisher Scientific), and stained with YO-PRO-1 (0.5 µM) and PI (10 µg/ml) according to the manufacturer’s protocol for 30 min at 37 °C in the dark. Immediately after staining, the cells were analysed with 488 nm excitation using a FACSCalibur flow cytometer (Becton Dickinson), and data were analysed using the FlowJo software (Becton Dickinson).
Cell cycle analysis
The HepG2 (5 × 10⁵) cells were seeded onto 6-well cell culture plates and incubated for 24 h in a fully supplemented EMEM (Corning®) with the addition of the analysed compounds at a concentration corresponding to the total IC50 values (34–5 µM, 35–4.5 µM, 36–4 µM, 37–4.5 µM). The DNA content was determined using flow cytometry with PI (Sigma-Aldrich, Steinheim, Germany) staining. After incubation, the cells were trypsinized and washed twice with 1 ml of PBS (Capricorn). In the next step, the cells were fixed with an ice-cold 80% ethanol. After incubation for 1 h at 4 °C, the fixed cells were washed twice with PBS and suspended in the staining PI/RNAse A/PBS buffer (PI 50 µg/ml, RNAse A 100 µg/ml) for 30 min at 37 °C in the dark. PI (Sigma) fluorescence was measured using a FACSCalibur (Becton Dickinson), and data were analysed using the FlowJo software (Becton Dickinson).
Real-time migration potential analysis using the xCELLigence system
Transwell cell migration experiments were performed using an xCELLigence RTCA Analyser (Roche, Switzerland) in CIM plates (ACEA Biosciences, San Diego, CA, USA). Each well consisted of an upper and a lower chamber separated by a microporous polyethylene terephthalate membrane containing randomly distributed 8-µm pores. Prior to the migration assay, the HepG2 cells (2 × 10⁴) were seeded onto 48-well plates containing the growth medium (EMEM) and incubated until 70–80% confluency at 37 °C in a humidified atmosphere containing 5% CO2. Subsequently, the cells were treated for 24 h with the tested compounds at final concentrations corresponding to their one-fourth (34–1.3 µM, 35–1.2 µM, 36–1 µM, 37–1.2 µM) and half (34–2.5 µM, 35–2.3 µM, 36–2 µM, 37–2.3 µM ) of their IC50 value. Then, 160 µl of complete growth medium (supplemented with 10% FBS) was added to the lower chamber, and 50 µl of serum-free growth medium was added to the upper chambers of the CIM plate. The plates were incubated at 37 °C under 5% CO2 saturation for 1 h prior to insertion into the xCELLigence platform. To initiate a transwell migration experiment, the cells were detached with trypsin (Corning®), resuspended in the serum-free growth medium, and seeded in the upper chamber at a density of 1 × 10⁴ cells in 100 µl per well that was previously treated with the compounds. The impedance of the microelectrode array was monitored and converted to CI. Normalisation values were recorded using the RTCA Software 1.2.1. Readouts were performed every 30 min for 72 h.
Oxidative stress measurement in HepG2 cells by flow cytometry
The HepG2 cells were seeded (2 × 10⁵ cells/well) onto 12-well plates and cultured in supplemented EMEM at 37 °C under 5% CO2 saturation until 70–80% confluency was reached. Subsequently, the cells were exposed for 24 h to the tested compounds at the final concentration equal to the total IC50 values (34–5 µM, 35–4.5 µM, 36–4 µM, 37–4.5 µM). The intracellular ROS level was analysed by staining with H2DCFDA (ex/em: ∼492–495/517–527 nm) in accordance with the manufacturer’s protocol (Thermo Fisher Scientific, Waltham, MA, USA), wherein ROS trigger the fluorescence. The cells were separated by trypsin (Corning®) and washed twice with DPBS (1 ml, Capricorn). The pelleted cells were suspended in 0.5 ml of DPBS containing H2DCFDA at the final concentration of 0.5 µM. In order to eliminate dead cells from analysis, propidium iodide (10 µg/ml) was also added to the staining mix. The cells were then incubated at 37 °C for 30 min in the dark and then analysed with excitation at 488 nm using a FACSCalibur flow cytometer (Becton Dickinson, Franklin Lakes, NJ, USA), and the data were analysed using the FlowJo software (Becton Dickinson).
Analysis of GSH level
The HepG2 cells were seeded at a density of 2 × 10⁵ cells/well onto 12-well plates and under the same environmental conditions as the above experiments. The cells were then treated with the tested compounds at the final concentration equal to the total IC50 values for 24 h. The cellular GSH level was measured by staining with the nonfluorescent Thiolite Green dye, which emits strong fluorescence after reaction with thiols (ex/em: ∼540/590 nm) according to the manufacturer’s protocol (AAT Bioquest, Sunnyvale, CA, USA). After incubation with the compounds (34–5 µM, 35–4.5 µM, 36–4 µM, 37–4.5 µM) the cells were detached with trypsin (Corning®) and washed twice with 1 ml of DPBS (Capricorn). Subsequently, the cells were suspended in a staining solution (50 µM) and incubated at 37 °C in a 5% CO2 environment for 30 min. After staining, the fluorescence intensity was analysed using a FACSCalibur flow cytometer with excitation at 488 nm, and the data were analysed using the FlowJo software (Becton Dickinson).
MMP measurement
The HepG2 cells were seeded at the density of 2 × 10⁵ cells/well onto 12-well plates and cultured with EMEM at 37 °C under 5% CO2 saturation until 70–80% confluency was reached. Subsequently, the cells were treated for 3, 6, and 24 h with the tested compounds at the final concentration corresponding to the total IC50 values (34–5 µM, 35–4.5 µM, 36–4 µM, 37–4.5 µM). After incubation, the cells were detached with trypsin (Corning®) and washed twice with 1 ml of DPBS (Capricorn), and alterations in ΔΨm were analysed using the MMP-sensitive cationic dye 5,5′,6,6′-tetrachloro-1,1′,3,3′-tetraethylbenzimidazolylcarbocyanine iodide (JC-1; Thermo Fisher Scientific), which can selectively enter mitochondria and change colour from red to green as the membrane potential decreases. The cells were stained with 2.5 µM JC-1 for 30 min at 37 °C in the dark. The maximum emission wavelengths of JC-1 monomers and “J-aggregates” were ∼ 525 (FL-1 channel) and ∼ 590 (FL-2 channel) nm, respectively. To create a strong, single positive green fluorescence signal, 3 µM FCCP was used. The mean fluorescence intensity representing the intracellular MMP level was analysed after incubation with the dye, with excitation at 488 nm using a FACSCalibur flow cytometer (Becton Dickinson), and the data were analysed using the FlowJo software (Becton Dickinson).
Lipid peroxidation measurement
The HepG2 cells were seeded at a density of 2 × 10⁵ cells/well onto 12-well plates and cultured under the same environmental conditions as the above experiments. Then, the cells were treated for 24 h with the tested compounds at the final concentration corresponding to the total IC50 values. The cells were then detached with trypsin (Corning®) and washed twice with 1 ml of DPBS (Capricorn), and intracellular oxidation of lipids was analysed by staining with the BODIPY® 581/591 C11 reagent according to the manufacturer’s protocol (Thermo Fisher Scientific, Waltham, MA, USA). Upon oxidation in living cells, the reagent shifts the fluorescence emission peak from 590 (red) to 510 nm (green). The cells were analysed after 30 min incubation in a 10 µM staining solution at 488 nm excitation using a FACSCalibur flow cytometer (Becton Dickinson, Franklin Lakes, NJ, USA), and the data were analysed using the FlowJo software (Becton Dickinson). The ratios of the signal from the 590 to 510 channels were used to determine lipid peroxidation in cells.
Intracellular Fe2+ level determination
The HepG2 cells were seeded at the density of 2 × 10⁵ cells/well onto 12-well plates and cultured with supplemented EMEM at 37 °C under 5% CO2 saturation until 70–80% confluency was reached. Then, the cells were treated with compounds 34–37 at the final concentration corresponding to the total IC50 values (34–5 µM, 35–4.5 µM, 36–4 µM, 37–4.5 µM) for 24 h. Subsequently, the cells were detached with trypsin (Corning®), washed with 1 ml DPBS (Capricorn), and then resuspended in the growth medium with 5 µM FeRhoNox™-1 (Goryo Chemical) for 1 h. The dye specifically detects labile Fe2+ ions via orange (red) fluorescence, irreversibly fluoresces upon reaction with Fe2+ ions, but does not react with other ions. The cells were analysed after incubation with the dye with excitation at 488 nm using a FACSCalibur flow cytometer (Becton Dickinson), and the data were analysed using the FlowJo software (Becton Dickinson). To create a strong, single, positive red fluorescence signal, 3 mM N-acetylcysteine (2 h incubation; Sigma-Aldrich) was used.
Ca2+ homeostasis determination
The HepG2 cells were incubated in the presence of the tested compounds at the final concentration corresponding to the total IC50 values (34–5 µM, 35–4.5 µM, 36–4 µM, 37–4.5 µM) for 24 h. Ca2+ released was determined by the selective dye Calcium Rhod-2 AM (Thermo Fisher Scientific), which binds specifically to Ca2+ ions that are related to an increase in dihydrorhod-2 AM concentration, and thus, an enhancement in fluorescence intensity occurred. After treatment, the cells were detached with trypsin (Corning®), washed with 1 ml of DPBS (Capricorn), and then resuspended in EMEM with 2.5 µM Rhod-2 AM. All the samples were incubated for 15 min at 37 °C in the dark, and fluorescence intensity was then analysed at an excitation/emission wavelength of 552/581 nm. The cells were analysed after incubation with the dye with excitation at 488 nm using a FACSCalibur flow cytometer (Becton Dickinson), and the data were analysed using the FlowJo software (Becton Dickinson).
Lysotracker red and acridine orange staining
To analyse the condition of the lysosomes, the cells (2 × 10⁵) were stained with the 100 nM LysoTracker™ Deep Red (Thermo Fisher Scientific) fluorescent dye for 30 min under growth conditions. The HepG2 and MRC-5 cells were treated with the tested compounds for 3 h.Final concentration of the compounds for HepG2 cells were as follows: 34–5 µM, 35–4.5 µM, 36–4 µM, 37–4.5 µM, whereas for MRC-5 were: 34–2.1 µM, 35–2 µM, 36–2.3 µM, 37–2.3 µM. Subsequently, the cells were trypsinized, rinsed with 1 ml of DPBS (Capricorn), and then incubated with the dye. Then, cytometric analysis of the stained cells was performed at an excitation/emission wavelength of 647/668 nm.
Lysosomal permeabilization was tested using the acridine orange (AO) dye. After treatment with the compounds, the cell pellets were suspended in 500 µl of DBPS containing AO (Sigma-Aldrich) at the final concentration of 0.5 µg/ml. After 15 min of staining at 37 °C in the dark, the cells were washed with DPBS to remove the unbound dye and resuspended in 500 µl of DPBS. Fluorescence intensity was analysed at an excitation wavelength of 488 nm, and two emission spectra were acquired at 505–550 and 600–650 nm for green and red fluorescence, respectively. The cells were analysed after incubation with the dye, with excitation at 488 nm, using a FACSCalibur flow cytometer (Becton Dickinson), and the data were analysed using the FlowJo software (Becton Dickinson).
Confocal microscopy analysis of lysosome integrity and nuclei morphology using AO staining
The HepG2 or MCR-5 cells were seeded onto a 10-well CELLview Slide (34 mm2, Greiner Bio-One GmbH, Austria) at the density of 1.5 × 10⁴ cells/well and grown in 200 µl of supplemented EMEM at 37 °C in a 5% CO2 atmosphere. After 24 h, the cells were treated with compounds 34–37 at the final concentration: 34–5 µM, 35–4.5 µM, 36–4 µM, 37–4.5 µM for 3 h. The untreated cells and cells incubated with DMSO were used as controls for the experiments. The final amount of DMSO was 5 and 2.3 µl for HepG2 and MRC-5, respectively, which correlated with the highest volume of the compound with the lowest IC50 value. After incubation, the cells were stained with AO at the final concentration of 1 µg/ml for 15 min under growth conditions. The medium was then removed, and the cells were rinsed with PBS, placed in FluoroBrite DMEM (Thermo Fisher Scientific, USA), and immediately examined under a Leica TCS SP5 II confocal microscope at 37 °C using an environmental cell culture chamber and an HC PL APO 63×/1.2 water-immersion objective. Sequentially scanned Z-stack images were collected at an excitation wavelength of 488 nm, and two emission spectra were acquired at 505–550 and 600–650 nm for green and red fluorescence, respectively. Image acquisition was carried out using the Leica LAS AF 2.7.3 software. Image processing and fluorescence intensity analysis were performed using the Leica LAS X 3.3.3 software with 2D or 3D deconvolution modules.
Human Topoisomerase IIα relaxation assay
The Human Topoisomerase IIα Relaxation Assay Kit (Cat. No. HTR 201) was purchased from Inspiralis (Norwich, UK). The Topo IIα inhibition assay was performed according to the manufacturer’s instructions. Briefly, the reaction mixture (30 µl) containing the tested compound (100 µM) dissolved in DMSO (whose final concentration of 2% did not influence the Topo IIα activity), supercoiled pBR322 (0.5 µg) in 1X Assay Buffer, and ATP (1 mM) was incubated at 37 °C for 15 min. Then, Topo IIα (1 U) was added, and the reaction mixture was incubated at 37 °C for an additional 45 min. The reaction was terminated by the addition of the STEB buffer (40% (w/v) sucrose, Tris–HCl (100 mM, pH 8), EDTA (1 mM), bromophenol blue (0.5 mg/ml)). The products were analysed by electrophoresis using agarose gel (1%) in TAE buffer at 70 V for 2 h, followed by ethidium bromide staining. For the most active compounds 34–37, the reaction was repeated at concentrations of 1, 5, and 10 µM. The percentage of Topo IIα activity inhibition was calculated by densitometric quantification (Quantity One software, Bio-Rad). The occurrence of a band representing the supercoiled DNA on an agarose gel indicated the inhibition of enzyme activity.
DNA unwinding assay
The DNA Unwinding Assay Kit (Cat no. DUKSR001) was purchased from Inspiralis (Norwich, UK). This assay is based on two reactions with different DNA substrates (relaxed or supercoiled pBR 322) and is used to investigate whether a compound intercalates into the DNA double-helix or binds in the minor groove, leading to unwinding of the DNA. In the first reaction, 0.5 µg of relaxed plasmid was incubated for 15 min with compounds 34, 35, 36, or 37 at a concentration of 10 µM in 2X assay buffer. After incubation, 2.5 U of wheat germ topoisomerase I (Topo I) was added, and the samples were incubated for 45 min at 37 °C. Then, 20 µl of water and 50 µl of butanol were added, vortexed briefly, and centrifuged. After extraction, the aqueous layer was mixed with an equal volume of STEB buffer (40% (w/v) sucrose, Tris–HCl (100 mM, pH 8), EDTA (1 mM), bromophenol blue (0.5 mg/ml)), extracted with chloroform/isoamyl alcohol (24:1), and analysed on 1% agarose gel in TAE buffer at 70 V for 2 h, followed by ethidium bromide staining. The second reaction was performed as described in the case of relaxed DNA but using a supercoiled plasmid as a substrate for Topo I.
Supplemental Material
Download PDF (5.7 MB)Disclosure statement
No potential conflict of interest was reported by the author(s).
Additional information
Funding
References
- Kamal A, Bolla NR, Srikanth PS, Srivastava AK. Naphthalimide derivatives with therapeutic characteristics: a patent review. Expert Opin Ther Pat. 2013;23(3):299–317.
- Braña M, Ramos A. Naphthalimides as anticancer agents: synthesis and biological activity. Curr Med Chem Anticancer Agents. 2001;1(3):237–255.
- Tandon R, Luxami V, Kaur H, Tandon N, Paul K. 1,8-Naphthalimide: a potent DNA intercalator and target for cancer therapy. Chem Rec. 2017;17(10):956–993.
- Shen K, Sun L, Zhang H, Xu Y, Qian X, Lu Y, Li Q, Ni L, Liu J. A ROS-mediated lysosomal-mitochondrial pathways is induced by a novel Amonafide analogue, 7c, in human HeLa cervix carcinoma cells. Cancer Lett. 2013;333(2):229–238.
- Pain A, Samanta S, Dutta S, Saxena AK, Shanmugavel M, Kampasi H, Quazi GN, Sanyal U. Synthesis and evaluation of substituted naphthalimide nitrogen mustards as rationally designed anticancer compound. Acta Pol Pharm. 2003;60(4):285–291.
- Dai F, Li Q, Wang Y, Ge C, Feng C, Xie S, He H, Xu X, Wang C. Design, synthesis, and biological evaluation of mitochondrial-targeted flavone-naphthalimide-polyamine conjugates with antimetastatic activity. J Med Chem. 2017;60(5):2071–2083.
- Chen Z, Liang X, Zhang H, Xie H, Liu J, Xu Y, Zhu W, Wang Y, Wang X, Tan S, et al. A new class of naphthalimide-based antitumor agents that inhibit Topoisomerase II and induce lysosomal membrane permeabilization and apoptosis. J Med Chem. 2010;53(6):2589–2600.
- Tomczyk MD, Byczek-Wyrostek A, Strama K, Wawszków M, Kasprzycki P, Walczak KZ. Anticancer activity and Topoisomerase II inhibition of naphthalimides with ω-hydroxylalkylamine side-chains of different lengths. Med Chem. 2019;15(5):550–560.
- Tomczyk MD, Walczak KZ. 1,8-Naphthalimide based DNA intercalators and anticancer agents. A systematic review from 2007 to 2017. Eur J Med Chem. 2018;159:393–422.
- Tandon R, Luxami V, Tandon N, Paul K. Recent developments on 1,8-naphthalimide moiety as potential target for anticancer agents. Bioorg Chem. 2022;121:105677.
- Nekvinda J, Różycka D, Rykowski S, Wyszko E, Fedoruk-Wyszomirska A, Gurda D, Orlicka-Płocka M, Giel-Pietraszuk M, Kiliszek A, Rypniewski W, et al. Synthesis of naphthalimide-carborane and metallacarborane conjugates: anticancer activity, DNA binding ability. Bioorg Chem. 2020;94:103432.
- Rykowski S, Gurda-Woźna D, Orlicka-Płocka M, Fedoruk-Wyszomirska A, Giel-Pietraszuk M, Wyszko E, Kowalczyk A, Stączek P, Bak A, Kiliszek A, et al. Design, synthesis, and evaluation of novel 3-carboranyl-1,8-naphthalimide derivatives as potential anticancer agents. IJMS. 2021;22(5):2772.
- Rykowski S, Gurda-Woźna D, Orlicka-Płocka M, Fedoruk-Wyszomirska A, Giel-Pietraszuk M, Wyszko E, Kowalczyk A, Stączek P, Biniek-Antosiak K, Rypniewski W, et al. Design of DNA intercalators based on 4-carboranyl-1,8-naphthalimides: investigation of their DNA-binding ability and anticancer activity. IJMS. 2022;23(9):4598.
- Leśnikowski ZJ. Challenges and opportunities for the application of boron clusters in drug design. J Med Chem. 2016;59(17):7738–7758.
- Leśnikowski ZJ. Recent developments with boron as a platform for novel drug design. Expert Opin Drug Discov. 2016;11(6):569–578.
- Różycka D, Leśnikowski ZJ, Olejniczak AB. Synthesis of boron cluster analogs of penicillin and their antibacterial activity. J Organomet Chem. 2019;881(15):19–24.
- Messner K, Vuong B, Tranmer GK. The boron advantage: the evolution and diversification of boron’s applications in medicinal chemistry. Pharmaceuticals. 2022;15(3):264.
- Fink K, Uchman M. Boron clusters compounds as new chemical leads for antimicrobial therapy. Coord Chem Rev. 2021;431:213684.
- Das BC, Nandwana NK, Das S, Nandwana V, Shareef MA, Das Y, Saito M, Weiss LM, Almaguel F, Hosmane NS, et al. Boron chemical in drug discovery and development: synthesis and medicinal perspective. Molecules. 2022;27(9):2615.
- Chen Y, Du F, Tang L, Xu J, Zhao Y, Wu X, Li M, Shen J, Wen Q, Cho CH, et al. Carboranes as unique pharmacophores in antitumor medicinal chemistry. Mol Ther Oncolytics. 2022;24:400–416.
- Marfavi A, Kavianpour P, Rendina LM. Carboranes in drug discovery, chemical biology and molecular imaging. Nat Rev Chem. 2022;6(7):486–504.
- Bogucka-Kocka A, Kołodziej P, Makuch-Kocka A, Różycka D, Rykowski S, Nekvinda J, Grüner B, Olejniczak AB. Nematicidal activity of naphthalimide-boron cluster conjugates. Chem Commun (Camb). 2022;58(15):2528–2531.
- Olejniczak AB, Adamska AM, Paradowska E, Studzińska M, Suski P, Leśnikowski ZJ. Modification of selected anti-HCMV drugs with lipophilic boron cluster modulator. Acta Pol Pharm–Drug Res. 2013;70(3):489–504.
- Ibrahim MK, Taghour MS, Metwaly AM, Belal A, Mehany ABM, Elhendawy MA, Radwan MM, Yassin AM, El-Deeb NM, Hafez EE, ElSohly MA, Eissa IH. Design, synthesis, molecular modeling and anti-proliferative evaluation of novel quinoxaline derivatives as potential DNA intercalators and topoisomerase II inhibitors. Eur J Med Chem. 2018;155:117–134.
- Abbass EM, Khalil AK, Mohamed MM, Eissa IH, El-Naggar AM. Design, efficient synthesis, docking studies, and anticancer evaluation of new quinoxalines as potential intercalative Topo II inhibitors and apoptosis inducers. Bioorg Chem. 2020;104:104255.
- Khalifa MM, Al-Karmalawy AA, Elkaeed EB, Nafie MS, Tantawy MA, Eissa IH, Mahdy HA. Topo II inhibition and DNA intercalation by new phthalazine-based derivatives as potent anticancer agents: design, synthesis, anti-proliferative, docking, and in vivo studies. J Enzyme Inhib Med Chem. 2022;37(1):299–314.
- Reddy TN, Beatriz A, Rao VJ, de Lima DP. Carbonyl compounds’ journey to amide bond formation. Chem Asian J. 2019;14(3):344–388.
- Malmquist J, Sjöberg S. Asymmetric synthesis of p-carboranylalanine (p-Car) and 2-methyl-o-carboranylalanine (Me-o-Car). Tetrahedron. 1996;52(27):9207–9218.
- Naeslund C, Ghirmai S, Sjöberg S. Enantioselective synthesis of m-carboranylalanine, a boron rich analogue of phenylalanine. Tetrahedron. 2005;61(5):1181–1186.
- Afanasyev OI, Kuchuk E, Usanov DL, Chusov D. Reductive amination in the synthesis of pharmaceuticals. Chem Rev. 2019;119(23):11857–11911.
- Dozzo P, Kasar RA, Kahl SB. Simple, high-yield methods for the synthesis of aldehydes directly from o-, m-, and p-carborane and their further conversions. Inorg Chem. 2005;44(22):8053–8057.
- Mergny JL, Duval-Valentin G, Nguyen CH, Perrouault L, Faucon B, Rougée M, Montenay-Garestier T, Bisagni E, Hélène C. Triple helix-specific ligands. Science. 1992;256(5064):1681–1684.
- Mukherjee A, Sasikala WB. Drug-DNA intercalation: from discovery to the molecular mechanism. Adv Protein Chem Struct Biol. 2013;92:1–62.
- Jolley EA, Hardebeck LKE, Ren Y, Adams MS, Lewis M, Znosko BM. The effects of varying the substituent and DNA sequence on the stability of 4-substituted DNA-naphthalimide complexes. Biophys Chem. 2018;239:29–37.
- Jiang H, Shang L, Wang ZX, Dong SJ. Spectrometric and voltammetric investigation of interaction of neutral red with calf thymus DNA: pH effect. Biophys Chem. 2005;118(1):42–50.
- Kong D-M, Wang J, Zhu L-N, Jin Y-W, Li X-Z, Shen H-X, Mi H-F. Oxidative DNA cleavage by Schiff base tetraazamacrocyclic oxamido nickel(II) complexes. J Inorg Biochem. 2008;102(4):824–832.
- Sirajuddin M, Ali S, Badshah A. Drug-DNA interactions and their study by UV-Visible, fluorescence spectroscopic and cyclic voltammetry. J Photochem Photobiol B-Biol. 2013;124:1–19.
- Inoue S, Salah-Eldin AE, Omoteyama K. Apoptosis and anticancer drug resistance. Hum Cell. 2001;14(3):211–221.
- Schwartz GK, Shah MA. Targeting the cell cycle: a new approach to cancer therapy. J Clin Oncol. 2005;23(36):9408–9421.
- Williams GH, Stoeber K. The cell cycle and cancer. J Pathol. 2012;226(2):352–364.
- Manchado E, Guillamot M, Malumbres M. Killing cells by targeting mitosis. Cell Death Differ. 2012;19(3):369–377.
- Trepat X, Chen Z, Jacobson K. Cell Migration. Compr Physiol. 2012;2(4):2369–2392.
- Zou Z, Chang H, Li H, Wang S. Induction of reactive oxygen species: an emerging approach for cancer therapy. Apoptosis. 2017;22(11):1321–1335.
- Dabiri Y, Schmid A, Theobald J, Blagojevic B, Streciwilk W, Ott I, Wölfl S, Cheng X. A ruthenium(II) N-heterocyclic carbene (NHC) complex with naphthalimide ligand triggers apoptosis in colorectal cancer cells via activating the ROS-p38 MAPK pathway. IJMS. 2018;19(12):3964.
- Liu T, Sun L, Zhang Y, Wang Y, Zheng J. Imbalanced GHS/ROS and sequential cell death. J Biochem Mol Toxicol. 2022;36(1):e22942.
- Suski JM, Lebiedzinska M, Bonora M, Pinton P, Duszynski J, Wieckowski MR. Relation between mitochondrial membrane potential and ROS formation. In: Palmeira CM, Moreno AJ, editors. Mitochondrial Bioenergetics. New York (USA): Humana Press; 2011. p. 183–205.
- Andrés-Juan C, de la Lastra P, Plou JM, Pérez-Lebeña FJ. E. The chemistry of Reactive Oxygen Species (ROS) revisited: outlining their role in biological macromolecules (DNA, lipids and proteins) and induced pathologies. IJMS. 2021;22(9):4642.
- Chen X, Kang R, Kroemer G, Tang D. Organelle-specific regulation of ferroptosis. Cell Death Differ. 2021;28(10):2843–2856.
- Stockwell BR. Ferroptosis turns 10: emerging mechanisms, physiological functions, and therapeutic applications. Cell. 2022;185(14):2401–2421.
- Li B, Yang L, Peng X, Fan Q, Wei S, Yang S, Li X, Jin H, Wu B, Huang M, et al. Emerging mechanisms and applications of ferroptosis in the treatment of resistant cancers. Biomed Pharmacother. 2020;130:110710.
- Gleitze S, Paula-Lima A, Núnez MT, Hidalgo C. The calcium–iron connection in ferroptosis-mediated neuronal death. Free Radic Biol Med. 2021;175:28–41.
- Serrano-Puebla A, Boya P. Lysosomal membrane permeabilization as a cell death mechanism in cancer cells. Biochem Soc Trans. 2018;46(2):207–215.
- Villamil Giraldo AM, Appelqvist H, Ederth T, Ollinger K. Lysosomotropic agents: impact on lysosomal membrane permeabilization and cell death. Biochem Soc Trans. 2014;42(5):1460–1464.
- Wang F, Gomez-Sintes R, Boya P. Lysosomal membrane permeabilization and cell death. Traffic. 2018;19(12):918–931.
- Torii S, Shintoku R, Kubota C, Yaegashi M, Torii R, Sasaki M, Suzuki T, Mori M, Yoshimoto Y, Takeuchi T, et al. An essential role for functional lysosomes in ferroptosis of cancer cells. Biochem J. 2016;473(6):769–777.
- Gao H, Bai Y, Jia Y, Zhao Y, Kang R, Tang D, Dai E. Ferroptosis is a lysosomal cell death process. Biochem Biophys Res Commun. 2018;503(3):1550–1556.
- Awad D, Damian L, Winterhalter M, Karlsson G, Edwards K, Gabel D. Interaction of Na2B12H11SH with dimyristoyl phosphatidylcholine liposomes. Chem Phys Lipids. 2009;157(2):78–85.
- Barba-Bon A, Salluce G, Lostalé-Seijo I, Assaf KI, Hennig A, Montenegro J, Nau WM. Boron clusters as broadband membrane carriers. Nature. 2022;603(7902):637–642.
- Verdia-Baguena C, Alcaraz A, Aguilella VM, Cioran AM, Tachikawa S, Nakamura H, Teixidor F, Vinas C. Amphiphilic COSAN and I2-COSAN crossing synthetic lipid membranes: planar bilayers and liposomes. Chem Commun (Camb)). 2014;50(51):6700–6703.
- Assaf KI, Begaj B, Frank A, Nilam M, Mougharbel AS, Kortz U, Nekvinda J, Gruner B, Gabel D, Nau WM. High-Affinity binding of metallacarborane cobalt bis(dicarbollide) anions to cyclodextrins and application to membrane translocation. J Org Chem. 2019;84(18):11790–11798.
- Rokitskaya TI, Khailova LS, Makarenkov AV, Shunaev AV, Tatarskiy VV, Shtil AA, Ol’shevskaya VA, Antonenko YN. Carborane derivatives of 1,2,3-triazole depolarize mitochondria by transferring protons through the lipid part of membranes. Biochim Biophys Acta-Rev Biomembr. 2019;1861(3):573–583.
- Gutierrez EM, Seebacher N, Arzuman L, Kovacevic Z, Lane D, Richardson V, Merlot A, Lok H, Kalinowski D, Sahni S, et al. Lysosomal membrane stability plays a major role in the cytotoxic activity of the anti-proliferative agent, di-2-pyridylketone 4,4-dimethyl-3-thiosemicarbazone (Dp44mT). Biochim Biophys Acta. 2016;1863(7):1665–1681.
- Stark M, Silva TFD, Levin G, Machuqueiro M, Assaraf YG. The lysosomotropic activity of hydrophobic weak base drugs is mediated via their intercalation into the lysosomal membrane. Cells. 2020;9(5):1082.
- Piao S, Amaravadi RK. Targeting the lysosome in cancer. Ann N Y Acad Sci. 2016;1371(1):45–54.
- Iulianna T, Kuldeep N, Eric F. The Achilles’ heel of cancer: targeting tumors via lysosome induced immunogenic cell death. Cell Death Dis. 2022;13(5):509.
- Champoux JJ. DNA topoisomerases: structure, function, and mechanism. Annu Rev Biochem. 2001;70:369–413.
- Sheldrick GM. SHELXT - Integrated space-group and crystal-structure determination. Acta Crystallogr A Found Adv. 2015;71(1):3–8.
- Sheldrick GM. Crystal structure refinement with SHELXL. Acta Crystallogr C Struct Chem. 2015;71(1):3–8.
- Braña MF, Castellano JM, Roldan CM, Santos A, Vazquez D, Jimenez A. Synthesis and mode(s) of action of a new series of imide derivatives of 3-nitro-1,8-naphthalic. Cancer Chemother Pharmacol. 1980;4(1):61–66.
- Nie MY, Wang Y, Li HL. Electrochemical and spectral properties of phenylhydrazine in the presence of ß-cyclodextrin. Pol J Chem. 1997;71:816–822.