
 ?Mathematical formulae have been encoded as MathML and are displayed in this HTML version using MathJax in order to improve their display. Uncheck the box to turn MathJax off. This feature requires Javascript. Click on a formula to zoom.
Abstract
Nur77 modulators have emerged as a promising therapeutic approach for hepatocellular carcinoma. In this study, a structure-based rational drug design approach was used to design and synthesise a series of 4-((8-hydroxy-2-methylquinolin-4-yl)amino)benzoylhydrazone derivatives based on the binding characteristics of our previously reported 10g and the native ligand 3NB at the binding Site C of Nur77. Cell-based cytotoxicity assays revealed that compound TMHA37 demonstrated the highest cytotoxicity against all tested cancer cells. The induced fit docking and binding pose metadynamics simulation suggested that TMHA37 was the most promising Nur77 binder at Site C. Molecular dynamics simulation validated the stable binding of TMHA37 to Nur77’s Site C but not to Sites A or B. Specifically, TMHA37 bound strongly to Nur77-LBD (KD = 445.3 nM) and could activate Nur77’s transcriptional activity. Furthermore, TMHA37 exhibited antitumor effects by blocking the cell cycle at G2/M phase and inducing cell apoptosis in a Nur77-dependent manner.
GRAPHIC ABSTRACT
Introduction
Liver cancer is the third leading cause of cancer death, accounting for an estimated 8.3% of all cancer deathsCitation1. Hepatocellular carcinoma (HCC) is a primary subtype of liver cancer that is a global health problem, and its incidence and mortality rates continue to riseCitation2,Citation3. Therefore, the identification of effective therapeutic targets and the development of innovative drugs for the treatment of HCC are critical to human health. The orphan nuclear receptor Nur77, also known as TR3 or NR4A1, is a member of the NR4A subfamily of the nuclear receptor superfamily and is involved in a diverse range of important biological processesCitation4–6. Nur77 exerts its genomic and non-genomic functions through transcriptional regulation or nucleoplasmic translocation, resulting in the regulation of many cellular processes such as cell cycle, apoptosis, lipid metabolism, and inflammationCitation7–9. The role of Nur77 in cancer development is paradoxical, as it has both cancer-promoting and cancer-inhibiting activitiesCitation10,Citation11. Even in the same cancer, Nur77 can act in opposite ways. For instance, Nur77 have opposite regulatory effects on colon tumours depending on the level of TGFβ signallingCitation12. The expression of Nur77 was significantly increased in some tumour cells, including rhabdomyosarcoma, colorectal cancer, and breast cancerCitation13–15. However, Nur77 is significantly downregulated in HCC, in which Nur77 acts as a tumour suppressor gene and exhibits antitumor activityCitation11,Citation16,Citation17. Therefore, the screening and optimisation of small molecules that can upregulate the expression of Nur77 and further activate the antitumor function of Nur77 have become a new therapeutic strategy for HCC.
In our previous study, we found that (E)-5-((8-methoxy-2-methylquinolin-4-yl)amino)-N'-(4-(methylthio) benzylidene)-1H-indole-2-carbohydrazide (10g)Citation18, a potent activator of Nur77, exhibited good anti-HCC activity both in vitro and in vivo. In HCC cells, 10g can upregulate the Nur77 expression and mediate the translocation of Nur77 from the nucleus to the cytoplasm, subsequently inducing ER stress-mediated autophagy and autophagy-dependent cell apoptosis. In addition, we found another active compound 4-PQBHCitation19, which also has a strong binding affinity to Nur77 as well as good anti-HCC activity in vitro and in vivo. The antitumor effect of 4-PQBH is dependent on Nur77-mediated cytoplasmic vacuolation and paraptosis. To obtain more anti-HCC Nur77 modulators with druggability potential that could induce Nur77 to exert extra-nuclear non-genomic functions, in this paper, we designed and synthesised thirty-seven 4-((8-hydroxy-2-methylquinolin-4-yl)amino) benzoylhydrazone derivatives according to the structural features of Nur77’s binding Site C and its previously reported modulators (3NB, 10g, and PCH4). All of the synthesised compounds were characterised by 1H NMR (nuclear magnetic resonance spectroscopy), 13C NMR, and HR-ESI-MS (high-resolution electrospray ionisation mass spectrometry), and their purity was checked by HPLC (high-performance liquid chromatography). Surprisingly, based on our rational drug design, TMHA37 has the strongest binding affinity to Nur77 among all the synthesised compounds, which was demonstrated by long-time scale MD (molecular dynamics) simulation in silico and SPR (surface plasmon resonance) experiment in vitro. Further biological mechanism studies showed that TMHA37 bound to Nur77 and induced Nur77 translocation to mitochondria, which then caused autophagy and apoptosis of cancer cells.
Results and discussion
Design strategies
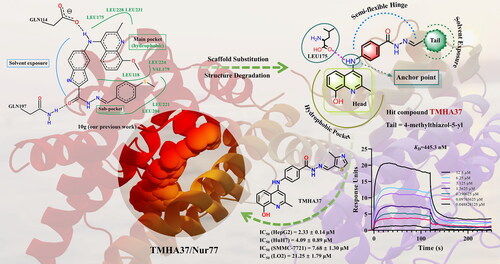
Four possible small-molecule binding sites for Nur77 have been identified (Supplementary Figure S1), and their spatial regions were analysed separately using Sitemap softwareCitation20,Citation21. The results showed that only Site C and Site D had SiteScore and Dscore values greater than 1, suggesting that they are potential drug-binding sites. However, the resolution of the only available cocrystal structure of Site D (PDB No: 6KZ5) is too low (4.45 Å) for structure-based drug design. Therefore, this work will focus on Site C-based drug design. The binding region of the native ligand 3NB to Site C (, Native Site C) consists of a hydrophobic map (yellow mesh), a hydrogen-bond donor map (blue mesh), and a hydrogen-bond acceptor map (red mesh). Hydrophobic interactions play a dominant role in this binding, with the long aliphatic chain of 3NB penetrating deep into the hydrophobic cavity of Site C. Interestingly, the 3,4,5-trihydroxyphenyl moiety of 3NB is in the solvent-exposed region, and the phenolic hydroxyl group forms hydrogen bonds with surrounding amino acid residues. In our previous studyCitation18, we identified compound 10g as a potent Nur77 modulator that could inhibit tumour growth by inducing apoptosis in cancer cells. The binding site area of 10g (, 10g Site C) is mainly composed of hydrophobic and hydrogen-bond acceptor maps, where hydrophobic interactions dominate. The 3D conformation of 10g resembles a “U” shaped insertion into the main pocket of Site C and the adjacent smaller hydrophobic sub-pocket.
Figure 1. Design strategy of novel Nur77 modulators.
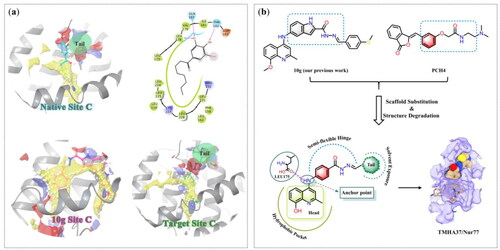
Solvent-exposed regions, within or adjacent to the ligand-binding site, are often considered promising for developing new drugs in structure-based drug design, leveraging known active compounds. Herein, we performed a rational drug design based on Nur77’s Site C, using 10g as the lead compound, to obtain novel Nur77 ligands that establish additional binding interactions with the solvent-exposed region. Initially, we retained the quinoline fragment of 10g to bind to the hydrophobic pocket of Site C. However, due to potential steric clashes between the methyl group of 8-OCH3 and residues LEU165, VAL167 and PHE172 in the hydrophobic pocket, we substituted it with 8-OH using the structure degradation method. This substitution enhanced the compatibility of the quinoline fragment with the hydrophobic pocket (). Moreover, the 8-OH substituent provided a hydrogen bond donor, thereby improving the binding affinity of the fragment. As an anchor, the amino group (-NH-) at the C4-position of the quinoline ring was maintained to stabilise the hydrophobic head fragment of 10g within Nur77’s hydrophobic cavityCitation18, while also enabling the orientation of the remaining structure towards the solvent-exposed region. In our design, the -NH- group was strategically positioned to form a hydrogen bond with the backbone carbonyl oxygen of key residue LEU175. This interaction effectively immobilised the 8-hydroxy-2-methylquinoline moiety of the target compounds in the hydrophobic pocket, while aligning the rest of the structure towards the solvent-exposed region. To make various functional groups fit well into the solvent-exposed region, we replaced the indole group of 10g with the benzene ring of PCH4, a Nur77 modulator and antitumor agent. Additionally, we retained the acylhydrazone part to create a semi-flexible hinge. Notably, in the solvent region of the 3NB/Nur77 complex, there is an unoccupied binding space near the 3,4,5-trihydroxyphenyl moiety of the native ligand 3NB (highlighted as Tail area in a green circle in ). Hence, we introduced a tail fragment onto the semi-flexible hinge to fill this vacant binding region beyond the benzene ring within the solvent region. In general, we synthesised a series of 4-((8-hydroxy-2-methylquinolin-4-yl)amino)benzoylhydrazone derivatives, designed through scaffold substitution and structure degradation methods, using 10g, PCH4, and 3NB as lead compounds. Among these derivatives, TMHA37 exhibited the highest Nur77 binding affinity and demonstrated potent antitumor activity.
2.2. Chemistry
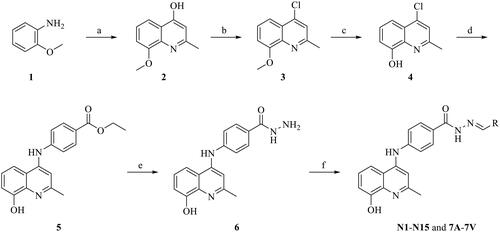
The synthetic route of 4-((8-hydroxy-2-methylquinolin-4-yl)amino) benzoylhydrazone derivatives was depicted in Scheme 1. The reaction sequence started with the cyclisation of 2-methoxyaniline (1) with ethyl acetoacetate, yielding 8-methoxy-2-methylquinolin-4-ol (2). Compound 2 was then treated with POCl3, affording 4-chloro-8-methoxy-2-methylquinoline (3). The demethylation of intermediate 3 to obtain 4-chloro-2-methylquinolin-8-ol (4), which was refluxed with benzocaine in n-butanol to give intermediate ethyl 4-((8-hydroxy-2-methylquinolin-4-yl)amino)benzoate (5). Next, the key intermediate 5 was treated with hydrazine hydrate to obtain 4-((8-hydroxy-2-methylquinolin-4-yl)amino)benzohydrazide (6). Finally, intermediate 6 was condensed with a diverse set of aldehydes to afford the final products N1-N15 and 7A-7V.
Scheme 1. The synthesis of compound N1-N15 and 7A-7V. Reagents and conditions: (a) Polyphosphoric acid, ethyl acetoacetate, 120 °C; (b) POCl3, 130 °C; (c) BBr3, room temperature, 6 h. (d) Benzocaine, n-Butanol, concentrated hydrochloric acid, reflux; (e) Hydrazine hydrate, ethanol, reflux; (f) Ethanol, RCHO, trifluoroacetic acid, reflux.
Hit identification in vitro and in silico
Cell viability assay
Initially, we assessed the in vitro anti-proliferation activity of all synthesised compounds at 20 μM against three types of hepatocellular carcinoma cell lines (HepG2, HuH7, and SMMC-7721). The results indicated that 15 compounds (N1-N15) at 20 μM exhibited low anti-HCC activities with growth inhibition rates (GIR) of less than 50% against all three tested cell lines (Table S1). In contrast, the remaining 22 compounds (7A-7V) at 20 μM had moderate antiproliferative activity against at least one HCC cell line (GIR ≥ 50%). Subsequently, we determined the IC50 values (concentration required to inhibit 50% of cell growth) of compounds 7A-7V in three HCC lines (HepG2, HuH7, and SMMC-7721) and one human normal hepatocyte (LO2) (). Among these compounds, TMHA37 (7D) was identified as the most potent anti-HCC derivative in vitro with an IC50 of 2.33 ∼ 7.68 μM.
Table 1. In vitro antiproliferative activities of compounds 7A–7V against four liver cell lines. 
We then performed structure-activity relationships (SARs) analysis for compounds 7A-7V based on their IC50 values in HCC cells. Compound 7A (R = thiophene-3-yl) exhibited weak anti-HCC activity (IC50 = 30.84 ∼ 52.77 μM), while compounds 7B (R = 3-bromo-thiophene-2-yl) and 7C (R = 4-Br-thiophene-2-yl) displayed moderate anti-HCC activities with values of less than 30 μM against HCC cells. It indicated that the introduction of an electron-withdrawing group (EWG) -Br on the thiophene group was beneficial to improve the anti-HCC effect. Notably, the replacement of 3-bromo-thiophene-2-yl (7B) with 4-methylthiazole-5-yl (TMHA37) resulted in significantly enhanced anti-HCC activities. TMHA37 showed excellent cytotoxicity against HCC cells with IC50 values ranging from 2.33 μM to 7.68 μM and had lower cytotoxicity against the normal cell line LO2 (IC50 = 21.25 μM). Among compounds with R of a mono-substituted phenyl group (7E-7I), compound 7G (R = 3-(trifluoromethyl)phenyl) showed the most potent inhibitory effect on HuH7 cell growth with an IC50 of 6.88 μM. Compound 7G exhibited better antiproliferative activities against all tested cell lines than 7H (R = 4-(trifluoromethyl)phenyl), indicating that the EWG substituent at the C3 position of the phenyl ring was more favourable for the antiproliferative potency. Additionally, compounds 7J-7Q, where R is a di-substituted phenyl group, also displayed moderate anti-HCC activities with IC50 values ranging from 7.78 μM to 37.22 μM. Among them, 7P (R = 2-F-5-CF3-phenyl) had the most potent inhibition effect on HCC cells (IC50 = 7.78 ∼ 19.26 μM), but it also showed similar cytotoxicity against normal liver LO2 cells (IC50 = 18.00 μM). 7M (R = 3-F-4-Br-phenyl) and 7N (R = 3-Br-4-F-phenyl) had a selective antiproliferative effect on HCC cells (IC50 = 15.84 ∼ 27.59 μM) and did not cause to the death of normal liver LO2 cells at similar concentrations (IC50 > 90 μM). However, compound 7R, where R is a substituted pyridyl, displayed decreased anti-proliferative activity against HCC cells (IC50 = 29.98 ∼ 45.81 μM). Intriguingly, compounds 7S (R = naphthalen-2-yl) and 7T (R = 4-methoxynaphthalen-1-yl) retained good antiproliferative activities against all tested HCC cell lines (IC50 = 14.95 ∼ 23.87 μM) and they showed low cytotoxicity to normal liver LO2 cells (IC50 >60 μM). However, the replacement of the naphthalene ring with the quinoline or benzothiophene moiety increased the toxicity to normal liver LO2 cells. For example, the antiproliferative activity of 7U against HCC cells was not greatly improved, but its cytotoxicity against normal liver LO2 cells was significantly enhanced (IC50: 66.28 μM → 18.03 μM) compared to 7S. Similarly, the cytotoxicity of 7V to normal liver LO2 cells was enhanced considerably (IC50: 66.28 μM → 3.06 μM).
Molecular docking study and binding pose metadynamics simulation
The Induced Fit docking method was used to perform a molecular docking study and evaluate the binding affinity of the synthesised compounds to the Site C of Nur77. The average docking score and IFDscore of the top five docking conformations of each compound were presented in Supplementary Figure S2. Compounds N2, N3, N4, N9, N12, 7A, 7B, TMHA37, 7P, and 7T, had docking scores less than −9.5, while compounds N4, N7, N9, N12, TMHA37, 7E, 7P, and 7Q had IFDscores less than −488.50. The intersection of these results, shown in , revealed the most promising Nur77 binders to be N4, N9, N12, 7P, and TMHA37. The ligand binding site volumes of the top five conformations of the selected compounds were calculated using the SiteMap tool. SiteMap recommends a volume of >225 Å3 for ligand-receptor binding. As shown in , only 7P and TMHA37 had average binding volumes greater than 225 Å3, indicating that they could be the most probable binding agents for Nur77. Notably, the Top3 docking conformations for N9, Top1 for N12, Top1 and Top4 for 7P, and Top3 and Top5 for TMHA37 had binding volumes greater than 300 Å3 ().
Figure 2. Induced fit docking study of target compounds with Nur77 at Site C. (a) Venn diagram analysis of the top five docked conformations of each complex with both docking scores <−9.5 and IFDscore <−488.50. (b) Average binding volumes of the top-five docking poses of Nur77 in complex with N4, N9, N12, 7P, and TMHA37, respectively. (c) Binding volumes of the top-five docking poses of N4, N9, N12, 7P, and TMHA37 with Nur77, respectively. (d) Binding pose metadynamics of the top-ranked docking poses.
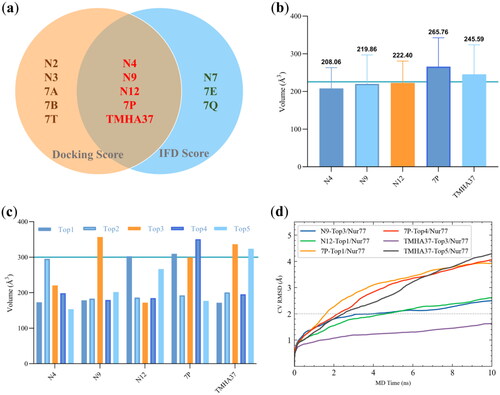
To confirm the reliability and stability of the ligand-receptor binding in obtained conformations with a volume greater than 300 Å3, we used Binding Pose Metadynamics (BPMD) simulation to eliminate potential false positive results. BPMD is a good technique that accurately assesses whether a small molecule ligand is stably bound to a protein in an aqueous environmentCitation22,Citation23. A Posescore of less than 2 indicates that the binding mode of the ligand-receptor is stable and dependable, while a Perscore of greater than 0.6 indicates that hydrogen bonds are stably formed between the ligand and the protein. and Table S2 illustrated the BPMD simulation results for N9-Top3/Nur77, N12-Top1/Nur77, 7 P-Top1/Nur77, 7 P-Top4/Nur77, TMHA37-Top3/Nur77, and TMHA37-Top5/Nur77 complexes. Out of the six complexes simulated, only the TMHA37-Top3/Nur77 system had a CV RMSD of the was less than 2 Å and remained stable at approximately 1.6 Å during the 10 × 10 ns enhanced sampling simulation (). TMHA37-Top3/Nur77 had a PersScore of 0.315 and a PoseScore of 1.544, indicating that TMHA37 stably binds to Site C in an aqueous environment and can form hydrogen bonds with residues. However, due to the hydrophobic nature of Site C, the PersScore was less than 0.6 for the persistent formation of hydrogen bonds. These results imply that TMHA37 is the most promising Nur77 binder and is consistent with the cell viability assay results. TMHA37 may exhibit anti-HCC activity by targeting Nur77, so it was chosen for subsequent in silico studies to explore its potential binding mechanism with Nur77.
Molecular modelling study of the hit compound, TMHA37, as a potential Nur77 ligand
Molecular dynamics simulation of TMHA37 bound to Nur77 at Site A, Site B, and Site C
To assess the validity and precision of the Nur77-based small molecule design for Site C, we investigated the binding stability of the hit TMHA37 at Site A (TMY/Nur77-SiteA), Site B (TMY/Nur77-SiteB), and Site C (3NB/Nur77-SiteC), respectively. depict the native ligands TMY and 3NB bound to Nur77 at Site A, Site B, and Site C, respectively. Meanwhile, we utilised the above-mentioned docking method to obtain the best complex conformations of TMHA37 bound at Site A () and Site B () of Nur77. Subsequently, we conducted BPMD studies on these five systems and the TMHA37/Nur77-SiteC complex (i.e. TMHA37-Top3/Nur77, ) to evaluate the binding stability of the ligand in Nur77. Based on the results of CV RMSD over time, PoseScore, and PersScore, it was observed that native ligands TMY and TMHA37 exhibited instability and were unable to establish stable hydrogen bond interactions (Table S3) at both Site A () and Site B (). Conversely, the CV RMSD of the native 3NB/Nur77-SiteC and TMHA37/Nur77-SiteC systems () were stable at approximately 4.5 Å and 1.6 Å at 9 ns, respectively. However, the PoseScore and PersScore indicators for the 3NB/Nur77-SiteC system were inferior to those of the TMHA37/Nur77-SiteC system. These findings suggest that TMHA37 binding at Site C was stable and superior to the positive control 3NB. Thus, it can be inferred that TMHA37 exhibits greater stability in Site C than in Sites A or B under aqueous conditions.
Figure 3. MD simulation of TMHA37/Nur77 system at Site A-C. (a) Binding patterns of native ligand TMY with Nur77 at Site A (PDB No: 3V3Q). Nur77 was represented as silver bands, TMY was shown as red spheres, and the binding pocket was shown as a yellow surface. (b) Binding patterns of native ligand TMY with Nur77 at Site B (PDB No: 3V3Q). Nur77 was represented as silver bands, TMY was shown as sky blue spheres, and the binding pocket was shown as a magenta surface. (c) Binding patterns of native ligand 3NB with Nur77 at Site C (PDB No: 4WHG). Nur77 was represented as silver bands, 3NB was shown as green spheres, and the binding pocket was shown as a green surface. (d–f) Docking poses of TMHA37 with Nur77 at Site A (d), Site B (e), and Site C (f), respectively. (g–i) Binding pose metadynamics simulations of native Nur77 system versus TMHA37/Nur77 system at Site A (g), Site B (h), and Site C (i), respectively. (j-l) RMSD profiling of TMHA37/Nur77 system at Site A (j), Site B (k), and Site C (l), respectively. The green lines indicated protein backbone RMSD, firebrick lines indicated the RMSD of ligand fit on protein, and violet lines indicated the RMSD of ligand fit on ligand. (m–o) Timeline representations of the contacts and interactions between TMHA37 and Nur77 at Site A (m), Site B (n), and Site C (o), respectively. The top panel showed the total number of specific contacts the protein made with the ligand over the course of the trajectory. The bottom panel showed which residues interact with the ligand in each trajectory frame.
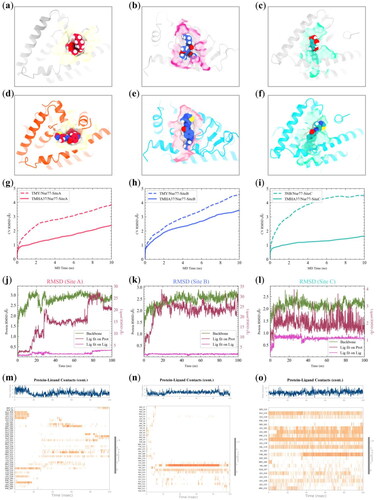
To further confirm the stability of TMHA37 binding at Site C compared to Sites A and B, we also performed 100 ns MD simulations for the TMHA37/Nur77-SiteA, TMHA37/Nur77-SiteB, and TMHA37/Nur77-SiteC complexes. The RMSD profiles of these systems during the simulations are depicted in . In the TMHA37/Nur77-SiteA system, the protein backbone RMSD reached a steady fluctuation of around 3.0 Å after 30 ns, while the ligand-fitted on protein RMSD exhibited significant fluctuations up to 28 Å, and the ligand-fitted on ligand RMSD fluctuated smoothly around 3 Å after 80 ns (). These results suggested that TMHA37 binding at Site A was unstable, with the ligand moving away from the initial binding site as the simulation progressed (Supplementary Figure S4(a) and Video S1). Similarly, the RMSD values for the protein and ligand-fitted on protein in the TMHA37/Nur77-SiteB system fluctuated around 2.6 Å and 25 Å, respectively (), indicating unstable binding of TMHA37 at Site B (Supplementary Figure S4(b) and Video S2). In contrast, the fluctuations of both protein backbone and ligand heavy atoms in TMHA37/Nur77-SiteC system were smaller compared to Sites A and B, indicating a more stable binding of TMHA37 at Site C (Figure S4c and Video S3). Protein-ligand contacts analysis in supported this observation, showing that TMHA37 formed more contacts with residues at Site C throughout the whole simulation than at Sites A or B, with around 8 residues in contact at Site C compared to 3 at Sites A and Site B.
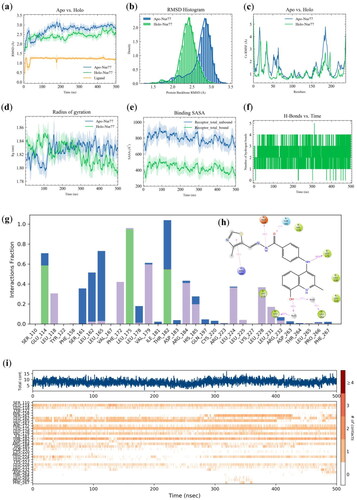
Figure 4. 500 ns MD simulation of TMHA37/Nur77-SiteC complex. (a) RMSD analysis of Apo-Nur77 (blue line) and Holo-Nur77 system (green line). The heavy atom RMSD of TMHA37 was shown as orange line. (b) The histogram of protein backbone RMSD distribution of Apo-Nur77 (blue) and Holo-Nur77 system (green). (c) Protein Ca RMSF plot of the simulated systems. (d) Time evolution of radius of gyration (Rg). (e) Ligand binding solvent accessible surface area (SASA). (f) Hydrogen bonds analysis of Holo-Nur77 system during MD simulation. (g) Protein-ligand contacts analysis of TMHA37/Nur77-SiteC. The green bars denoted hydrogen bonds, light violet bars denoted hydrophobic contacts, and blue bar denoted water bridges. (h) Ligand-protein contacts plot of TMHA37/Nur77-SiteC system. Whereas violet and red colored arrows denoted the hydrogen bonds and pi-cation interactions, respectively. (i) Timeline plots of the contacts and interactions between TMHA37 and Nur77.
Long time scale molecular dynamics simulation of TMHA37/Nur77-SiteC complex
To further investigate the interaction between TMHA37 and Nur77 at Site C, a 500 ns MD simulation was conducted (). Protein backbone RMSD analysis was performed to compare the conformational changes of Nur77 in the absence (Apo-Nur77) and presence (Holo-Nur77) of TMHA37 over the simulation time. The RMSD values of the protein backbone atoms were larger in the Apo-Nur77 system than that in the Holo-Nur77 system (), confirming reduced conformational flexibility upon TMHA37 binding. Similarly, the RMSD of TMHA37 remained stable at approximately 1.2 Å, indicating no significant conformational change in the ligand upon binding (). Furthermore, the RMSF analysis of protein Cα atoms revealed that the Apo-Nur77 system exhibited higher fluctuation compared to the Holo-Nur77 system (), demonstrating enhanced protein stability due to TMHA37 binding. The compactness of the protein system was assessed using the radius of gyration (Rg), which showed that Rg fluctuations decreased and reached a stable state in the Holo-Nur77 system (), suggesting a more compact protein structure upon TMHA37 binding. The ligand-binding solvent-accessible surface area (SASA) analysis indicated a tighter binding of TMHA37 to Nur77, as the ligand-binding SASA value of the TMHA37/Nur77-SiteC complex was lower than that of the receptor total unbound (). Hydrogen bonds formation between TMHA37 and Nur77 was examined, revealing the formation of at least three stable hydrogen bonds throughout the simulation (). The non-covalent bond interactions of TMHA37 with Nur77 were mainly composed of hydrogen bonds, water bridges, and hydrophobic interactions (). Notably, the residues GLU114, LEU175, and THR182 played a significant role in forming hydrogen bonds with TMHA37. The contacts analysis demonstrated consistent interactions between TMHA37 and Nur77, including a hydrogen bond with LEU175 backbone, a hydrogen bond with the GLU114 side chain, and a hydrogen bond with the carbonyl oxygen atom of the THR182 side chain (). The tail group thiazole of TMHA37 engaged in Pi-cation interactions with ARG184 at 41% of the simulation time. Furthermore, the quinoline head part of TMHA37 formed hydrophobic interactions with LEU118, LEU162, LEU175, LEU165, LEU224, and LEU228 (). The hydrophobic pocket of Nur77 securely accommodated the stable binding of the quinoline fragment of TMHA37, with the 8-OH in the quinoline forming water bridge interactions with LEU165 and LEU162. The analysis of amino acids in contact with TMHA37 during the simulation revealed that approximately 10 residues consistently interacted with the ligand, including GLU114, LEU165, LEU175, THR182, and others (). Collectively, these findings confirm the strong and stable binding of TMHA37 to Site C of Nur77 throughout the 500 ns MD simulation, mediated by hydrogen bonds, Pi-cation interactions, hydrophobic interactions, and water bridges.
Next, the Gibbs free energy landscape (FEL) was plotted based on Rg and protein backbone RMSD to gain deeper insight into the free energy states of TMHA37/Nur77-SiteC conformations in the MD simulation. The FEL depicted several metastable states and a single large stable global free energy minimum conformation, with the energy basin located at the RMSD value of ∼0.23 nm and Rg value of ∼1.81 nm (). The conformation with the lowest Gibbs free energy (frame 4179) was extracted for further analysis of the hydrophilic-hydrophobic surface (). The quinoline moiety of TMHA37 interacted with the hydrophobic pocket of Site C, while the thiazole group was bound in the hydrophilic part (solvent-exposed region), with the semi-flexible hinge of TMHA37 served as a linker. These results confirm the rationality of our design strategy. We also analysed the difference between the TMHA37’s initial conformation before MD simulation ( and Figure S5(a)) and its most stable conformation after MD simulation ( and Supplementary Figure S5(b)). We found that the two conformations had very similar binding-pose structures with RMSD value of 1.85 Å, suggesting a firm interaction of TMHA37 with the binding site and no significant displacement. Furthermore, the ligand heavy atom RMSD value between the initial and final frames was merely 1.59 Å (Figure S4d), indicating that TMHA37 exhibited stable binding at Site C. However, the thiazole moiety after MD simulation was flipped, which could be attributed to steric hindrance. Furthermore, the distances of hydrogen bond formed by TMHA37 with GLU114 and the Pi-cation interaction created by TMHA37 with ARG184 increased. Meanwhile, the hydrogen bond distance between TMHA37 and the LEU175 backbone and the hydrogen bond distance between the carbonyl oxygen of TMHA37 and THR182 decreased. These data support the robust binding of TMHA37 to Site C of Nur77, aligning with the binding pose hypothesised in our drug design.
Figure 5. Conformational analysis of TMHA37/Nur77-SiteC complex. (a) The FEL plot obtained during 500 ns MD simulation for TMHA37/Nur77-SiteC system. The dark brown area denotes the energy minima, and the white and light-yellow regions describe metastable conformational states. (b) Binding pose of the free energy minimum conformation colored by hydrophobicity. Nur77 was displayed as a cyan (hydrophilic) and yellow (hydrophobic) surface and TMHA37 was rendered in a yellow ball and stick. (c) and (d) represented 3D interactions between TMHA37 and Nur77 before (pre-MD) and after (post-MD) MD simulation, respectively. Site C of Nur77 was displayed as translucent stripes, TMHA37 was shown as ball and stick, and the key residues interacted with ligand were shown as colorful sticks. These sky-blue dashed lines indicated hydrogen bonds and brown-red dashed line indicated pi-cation interaction. (e) Time evolution of binding free energy (ΔG), lipophilic energy (Lipo), and Van der Waals energy (Vdw). (f) Total binding free energy and energy terms analysis for TMHA37/Nur77-SiteC system.
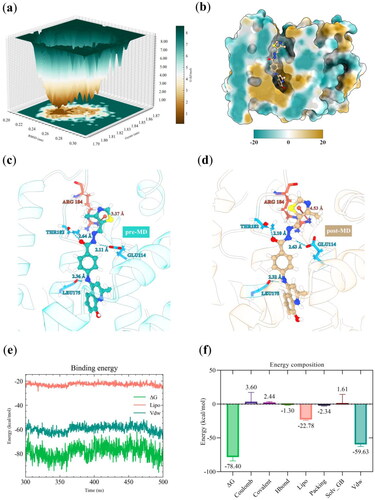
Then, the binding free energy calculation was performed using the MMGB-SA method to evaluate the binding affinity between TMHA37 and Nur77. We focussed on the last 200 ns of the trajectory when the simulated system had reached equilibrium. The results showed that the binding free energy (ΔG) of each frame fluctuated smoothly around −80 kcal/mol throughout the simulation (). The mean ΔG of TMHA37 with Nur77 was −78.40 ± 5.58 kcal/mol. presents the decomposition of binding energy terms for the TMHA37/Nur77-SiteC complex, highlighting the significant contributions of Van der Waals and lipophilic interaction energies to the total binding free energy. This suggests that TMHA37 predominantly engages in hydrophobic interactions with Nur77, owing to the protein’s pronounced hydrophobicity. However, the contribution of hydrogen bonds to the binding free energy was minimal, amounting to only −1.30 kcal/mol. It might be because that TMHA37 only formed a sustained hydrogen bond with LEU175 backbone. Furthermore, the values of Coulomb (coulomb interaction energy), Covalent (covalent binding energy), and Solv_GB (Generalized Born electrostatic solvation energy) were positive, indicating that these energy terms dit not conducive to the binding of TMHA37 to Nur77.
Biological evaluation of compound TMHA37
TMHA37 binds to Nur77-LBD and stimulates transcriptional activity of Nur77
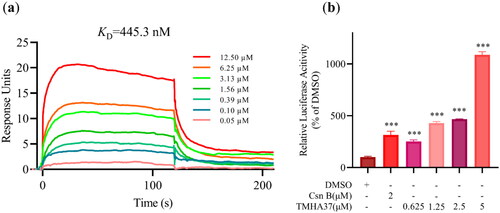
To verify the physical binding affinity of TMHA37 with Nur77 at the protein level, we conducted the SPR technology-based experiment. The SPR response of Nur77-LBD was enhanced by TMHA37 in a dose-dependent manner, as illustrated in , which confirms the direct binding of TMHA37 to Nur77. The equilibrium dissociation constant (KD) value of TMHA37 with Nur77 was calculated to be 445.3 nM, indicating an excellent extracellular binding affinity. As Nur77 could act as a transcription factor and regulate the expression of target genes by targeting their response elementsCitation24, we performed a luciferase reporter assay in Hela cells which was transfected with pG5-Luc reporter plasmid and pBind-Nur77-LBD to validate whether TMHA37 could regulate the transcriptional activity of Nur77 by binding to the receptor. In line with the SPR results, TMHA37 significantly increased the reporter fluorescence intensity in a dose-dependent manner (), indicating that TMHA37 binding could enhance the transcriptional activity of Nur77 in vitro. Therefore, based on the results of molecular modelling study and the in vitro experimental assays, we can conclude that TMHA37 directly targets Nur77.
Figure 6. Binding assay of TMHA37 to Nur77-LBD. (a) The interaction between TMHA37 and Nur77-LBD was performed using SPR assay. (b) Hela cells were transfected with pG5-Luc reporter plasmid and pBind-Nur77-LBD and treated with the indicated concentration of TMHA37 or Cytosporone B (Csn B) for 24 hours. Reporter activities were measured. ***p < 0.001 (Student t test).
TMHA37 regulates Nur77 expression and mitochondrial targeting
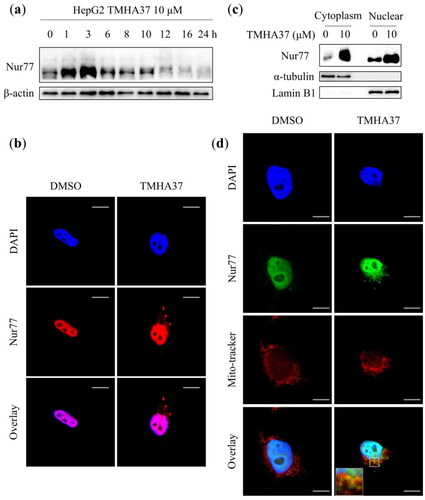
Small molecules have been shown to induce Nur77 translocation from the nucleus to the mitochondria, leading to cell apoptosis or mitophagy by interacting with Bcl-2 or TRAF2Citation25,Citation26. Notably, the tumour-suppressive effect of Nur77 was mainly related to extranuclear non-genotypic functionsCitation27. Therefore, we first examined whether TMHA37 regulates Nur77 protein expression and its mitochondrial targeting. In HepG2 cells, the highest expression of Nur77 was reached after treating with TMHA37 for 3 h; subsequently, Nur77 protein was gradually degraded (). The regulated process of TMHA37 on Nur77 expression is similar to that of the lead compound 10gCitation18. The final gradual decline of Nur77 level in TMHA37-treated HepG2 cells might be related to its short half-lifeCitation28. At the same time, the western blotting assay showed that the treatment of 10 μM TMHA37 for 3 h increased the protein expression levels of Nur77 in both cytoplasm and nuclear (). Moreover, the immunofluorescence assay exhibited that TMHA37 treatment led to Nur77 translocation from the nucleus to the cytoplasm in HepG2 cells (). Finally, the confocal microscopy analysis indicated that TMHA37 facilitated mitochondrial translocation of endogenous Nur77 (). Overall, these results suggested that TMHA37 could induce both high expression and mitochondrial targeting of Nur77.
Figure 7. TMHA37 regulated the expression and mitochondrial targeting of Nur77. (a) Western blotting assays analyzed the expression of Nur77 in HepG2 cells after treating with 10 μM TMHA37 for the indicated time, β-actin was used for internal control. (b) 10 μM TMHA37 stimulated HepG2 cells for 3 h. Western blotting detected the distribution of Nur77 in the cytoplasm and nuclear. Lamin B1 and α-tubulin were used for the internal control of the nucleus and cytoplasm, respectively. (c) Confocal microscope observed the nuclear export of Nur77 in HepG2 cells treating with 10 μM TMHA37 for 6 h. DAPI was used as nuclei stanning dye. Scale bar, 20 μm. (d) HepG2 cells were exposed to 10 μM TMHA37 for 6 h and then probed with the Nur77 antibody and Mito-tracker. Scale bar, 20 μm.
The Nur77-dependent antitumor mechanism of TMHA37 in HCC cells
The antiproliferative roles of TMHA37 on HCC cells
TMHA37 inhibited the colony formation of HCC cells. TMHA37 could significantly inhibit the growth of the HepG2, HuH7, and SMMC-7721 HCC cell lines with IC50 values of 2.33 ± 0.14 μM, 4.09 ± 0.89 μM, and 7.68 ± 1.30 μM, respectively (). In contrast, TMHA37 demonstrated lower cytotoxicity towards normal liver LO2 cells (IC50 = 21.25 ± 1.79 μM), suggesting its tumour-selective potential. Colony formation assays, which are widely employed to assess cancer cell survival and proliferation, were conducted to evaluate TMHA37’s anti-HCC effect. As shown in , TMHA37 significantly and dose-dependently inhibited the colony formation of two HCC cell lines (HepG2 and HuH7), consistent with the corresponding proliferation results against these two HCC cell lines in a dose-dependent manner. Taken together, TMHA37 had a strong anti-survival effect on liver cancer cells.
Figure 8. TMHA37 inhibited colony formation and induced cell cycle arrest at G2/M phase in HCC cells. (a) Effect of TMHA37 on the colony formation of Huh7 and HepG2 cells and Statistical analyses of the calculated colony number. HepG2 and Huh7 cells were treated with DMSO or TMHA37 for one week. Ns, not significant; ***p < 0.001; **0.001 < p < 0.01 (Student t test). (b) Effect of TMHA37 on cell cycle in Huh7 and HepG2 cells. Cells treated with TMHA37 at the indicated concentration for 10 h were analyzed by flow cytometry.
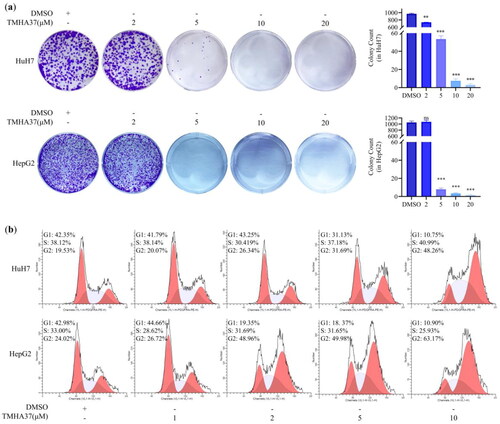
TMHA37 arrested HCC cells in G2/M phases. Cancer is characterised by uncontrolled cell division. Therefore, the effect of TMHA37 on the cell cycle progression of HepG2 and HuH7 cells was investigated using flow cytometry analysis. The calculated percentage of cell cycle distribution after TMHA37 treatment showed a decrease in G0/G1 phase cells and an accumulation of G2/M phase cells (). In HuH7 cells, treatment with TMHA37 increased the percentage of cells at the G2/M phase of the cell cycle from 20.07% at 1 μM to 48.26% at 10 μM, compared to the control (19.53%). Similarly, in HepG2 cells, TMHA37 resulted in a significant increase in the accumulation of cells at the G2/M phase from 26.72% at 1 μM to 63.17% at 10 μM, compared to the control (24.02%). These results demonstrate that TMHA37 can dose-dependently arrest HCC cells at the G2/M phase, which partly accounts for its potent antitumor activity.
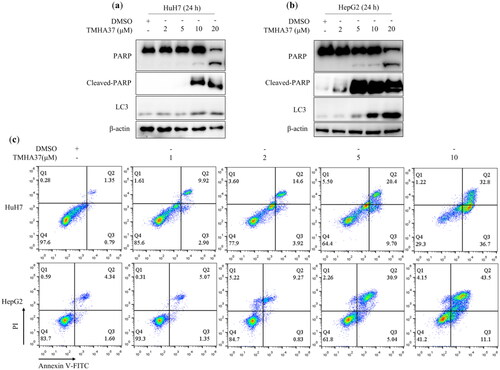
TMHA37 induces cell apoptosis and autophagy. To elucidate the antiproliferative mechanism of TMHA37, we examed its potential to induce apoptosis in HCC cells. In both HuH7 and HepG2 cells, TMHA37 treatment led to a dose-dependent upregulation of cleaved-PARP, an established marker of apoptosis (). Furthermore, utilising the Annexin V-FITC/PI apoptosis detection assay, we observed a dose-dependent increase in the proportion of apoptotic cells following TMHA37 treatment in HuH7 and HepG2 cells (). Specifically, TMHA37 induced apoptosis in HuH7 cells by 12.82% and 69.50% at concentrations of 1.0 and 10.0 μM, respectively, in contrast to the 2.14% apoptotic cells in the control group. Similarly, TMHA37 exhibited a clear dose-dependent apoptotic effect in HepG2 cells, with the percentage of apoptotic cells rising from 6.42% at 1.0 μM to 73.1% at 10.0 μM. These results collectively demonstrate the significant apoptotic induction capacity of TMHA37 in HCC cells. Notably, Nur77 translocation from the nucleus has been implicated in the initiation of cell apoptosis or autophagyCitation27. Intriguingly, our findings revealed that TMHA37 induced such translocation of Nur77. Consistently, we observed that TMHA37 induced autophagy in HuH7 and HepG2 cells concomitantly with apoptosis. TMHA37 treatment dose-dependently increased the level of LC3-II, a well-established marker of autophagosomes ().
Figure 9. TMHA37 induces liver cancer cell apoptosis and autophagy. Western blot analysis of cleaved PARP and LC3-II after treatment with TMHA37 at the indicated concentration for 24 h in Huh7 (a) and HepG2 (b)cells. β-actin was used as an internal control. (c) Flow cytometry analysis of TMHA37, Q1: necrotic cells, Q2: viable apoptotic cells, Q3: nonviable apoptotic cells, Q4: normal cells; Huh7 and HepG2 cells treated with TMHA37 for 24 h were stained by FITC Annexin V and Propidium Iodide Staining Solution, and then analyzed by flow cytometry.
Nur77 mediates TMHA37-induced mitotic arrest and cell apoptosis
Nur77 plays a crucial role in cell proliferationCitation29, differentiationCitation30, and apoptosisCitation31. TMHA37 is a potent Nur77 binder that has been shown to inhibit the growth of HCC cells by inducing cell cycle arrest at the G2/M phase and apoptosis. Therefore, we investigated whether TMHA37 caused the cell cycle arrest and apoptosis were Nur77-dependent. As shown in , the TMHA37-caused G2/M arrest was significantly decreased in Nur77-knockdown A549 cells (Nur77–/–) compared to control cells. Moreover, the TMHA37-induced cleaved PARP reduced obviously in Nur77-knockdown A549 cells (). These findings suggest that Nur77 mediates TMHA37-induced cell cycle arrest and apoptosis.
Figure 10. The effect of TMHA37 on inducing mitotic arrest and cell apoptosis in cancer cells was Nur77 dependent. (a) RT-QPCR analyzed the relative mRNA expression level in A549-WT or A549-Nur77-/- cells. (b) A549-WT or A549-Nur77-/- cells were treated with the indicated concentration of TMHA37 for 10 h were stained with DAPI for flow cytometry analysis. (c) Statistical analysis relative cell number in G2/M phase in A549-WT or A549-Nur77-/- cells. (d) Cleaved-PARP and Nur77 were detected by Western blotting after the treatment with TMHA37 for 24 h. (e) Cell viability of HepG2 cells with or without CDIM8. HepG2 cells were treated with 5 μM TMHA37 with or without CDIM8. After 48 h, the cell viability was determined by MTT assay.
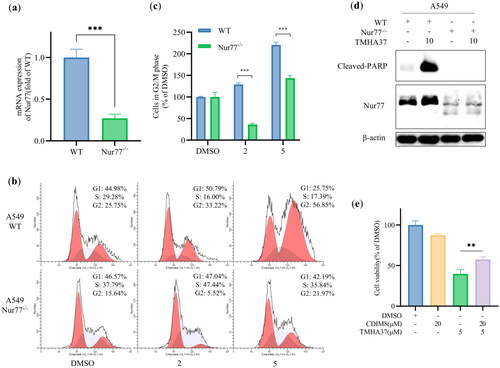
To verify whether cell growth inhibition of TMHA37 was associated with the extra-nuclear/non-genomic action of Nur77, HepG2 cells were first treated with or without 20 μM CDIM8 (a Nur77 antagonist trapping Nur77 in the nucleus)Citation32 and then exposed to TMHA37 for 48 h. The resulting cell viability was evaluated using an MTT assay. As shown in , CDIM8 significantly reversed the inhibitory effect of TMHA37 on HepG2 cell proliferation, indicating that TMHA37’s ability to inhibit cell proliferation is dependent on Nur77 translocation.
Pharmacokinetic profile of TMHA37 in vivo
Reasonable Pharmacokinetic (PK) properties are crucial for the in vivo efficacy of antitumor agents. Therefore, we conducted an evaluation of the PK parameters of TMHA37 in Sprague-Dawley (SD) rats. The intravenous (i.v.) administration of TMHA37 at a dose of 2 mg/kg resulted in the following plasma exposure values (): an area under the concentration-time curve from 0 to infinity (AUC0-∞) of 246.79 ± 72.61 h*μg/L, a maximum plasma concentration (Cmax) of 292.64 ± 45.45 μg/L, a half-life (T1/2) of 1.54 ± 0.35 h, and a clearance rate (CL) of 8.60 ± 2.59 L/h/kg. After oral administration of TMHA37, the AUC0-∞, Cmax, and T1/2 were 170.43 ± 25.45 h*μg/L, 19.57 ± 0.97 μg/L, and 1.13 ± 0.09 h, respectively. As a result, the oral bioavailability (F) of TMHA37 was approximately 6.91%. This low oral bioavailability may be attributed to its inadequate membrane permeability despite exhibiting a high binding affinity to Nur77 in vitro. Consequently, our future research will focus on the structure optimisation of TMHA37 to develop novel Nur77-targeting antitumor agents with enhanced oral bioavailability.
Table 2. PK profiles of compound TMHA37.
Conclusions
In this study, we employed rational drug design approaches to develop a series of benzoylhydrazone derivatives with favourable Nur77-binding affinities. Among these derivatives, TMHA37 demonstrated notable antiproliferative properties against all tested HCC cell lines, as demonstrated by the MTT test with IC50 values in the low micromolar range. Through an induced fit docking study, TMHA37 was identified as a promising binder of Nur77 at binding Site C. This finding was further supported by subsequent BPMD and 500 ns all-atom molecular dynamics simulations. Moreover, the SPR assay provided evidence of TMHA37’s excellent binding affinity towards Nur77, with a KD value of 445.3 nM. Furthermore, the dual-luciferase reporter assay confirmed that TMHA37 effectively activated the transcriptional activity of Nur77 in vitro. Additional, biological assays, including confocal microscopy analysis, flow cytometry assay, and western blot analysis, further substantiated the antitumor effects of TMHA37. Specifically, TMHA37 exhibited a Nur77-dependent mechanism of action by blocking cell cycle at the G2/M phase and promoting cell apoptosis and autophagy. The preliminary pharmacokinetic study implied that TMHA37 possessed poor oral bioavailability. Collectively, our present work has developed a highly potent Nur77 modulator, TMHA37, with excellent anti-HCC effects, which could be further optimised to develop lead compounds for the chemotherapy of liver cancer.
Experimental section
Chemistry
Unless explicitly stated, commercially available solvents and reagents were used without purification. Standard procedures were applied to remove solvents and dry products. Instrumentation employed in compound synthesis and structural characterisation, such as Nuclear Magnetic Resonance Spectroscopy, Mass Spectrograph, High Performance Liquid Chromatography, and microscope melting point apparatus, was in accordance with our prior publicationsCitation18,Citation33.
4-chloro-2-methylquinolin-8-ol (4)
The preparation of intermediates 2 and 3 followed the method outlined in our previous publicationCitation18. Intermediate 3 (5 g, 24 mmol) was added to a dry 100 ml round bottom flask along with anhydrous dichloromethane (40 ml) and BBr3 (7 ml). The resulting mixture was stirred at room temperature for 6 h. After the reaction was completed, the solvent was removed under reduced pressure and the solute was transferred to a beaker with ample water. The pH of the solution was then adjusted to 8 with NaOH solution. The mixture was subsequently filtered, and the filter cake was washed with water and dried to obtain compound 4 (3.95 g). Brown solid, yield 85%. ESI-MS (-): m/z 192.2 [M-H]–.
Ethyl 4-((8-hydroxy-2-methylquinolin-4-yl)amino)benzoate (5)
A mixture of 4 (1.0 g, 5.2 mmol) and benzocaine (1.1 eq) in a 50 ml round bottom flask underwent reflux in n-butanol (20 ml) for 7 h. The reaction was concentrated under a vacuum to remove solvent to give the crude product, which was further purified by silica gel column chromatography (DCM: MeOH = 50:1, v/v) to get 5 (1.3 g). White solid, yield: 78%; ESI-MS (+): m/z 323.2 [M + H]+, ESI-MS (–): m/z 321.2 [M-H]–.
4-((8-hydroxy-2-methylquinolin-4-yl)amino)benzohydrazide (6)
In a 50 ml round bottom flask, 5 (1.6 g, 5 mmol), hydrazine hydrate (10 ml), and ethanol (10 ml) underwent reflux for 8 h. The reaction mixture was cooled to room temperature and filtered. The filter cake was washed with 20 ml of water and dried to afford 6 (1.3 g). White solid, yield 84%; ESI-MS (+): m/z 309.1 [M + H]+.
General procedures for the synthesis of target compounds N1-N15 and 7A-7V
Intermediate 6 (77 mg, 0.25 mmol) was subjected to reflux with various aldehydes (0.25 mmol) in 5 ml of absolute ethanol, supplemented with a catalytic amount of trifluoroacetic acid for 8 h. Afterward, the solvent was evaporated under reduced pressure to give the crude product, which was purified by column chromatography to yield the target 4-((8-hydroxy-2-methylquinolin-4-yl)amino)benzoylhydrazone derivatives.
(E)-N'-(cyclohexylmethylene)-4-((8-hydroxy-2-methylquinolin-4-yl)amino)benzohydrazide (N1)
Yellow solid; 97 mg, yield 96%; mp: 261–263 °C. HPLC purity: 98.1%. 1H NMR (600 MHz, DMSO-d6) δ = 11.46 (br s, 1H), 9.86 (br s, 1H), 7.97 (br d, J = 8.3 Hz, 2H), 7.90 (br d, J = 7.9 Hz, 1H), 7.69 (br d, J = 5.3 Hz, 1H), 7.52 (br d, J = 8.1 Hz, 2H), 7.45 (br t, J = 8.0 Hz, 1H), 7.23 (br d, J = 7.0 Hz, 1H), 6.98 (s, 1H), 2.60 (s, 3H), 2.31 − 2.22 (m, J = 4.6 Hz, 1H), 1.82 − 1.70 (m, 4H), 1.33 − 1.18 (m, 6H); 13C NMR (151 MHz, DMSO-d6) δ 162.6, 158.5, 158.3, 156.1, 150.5, 142.9, 129.5 (2 C), 126.4, 122.7, 120.7, 119.0, 118.7, 116.7, 112.7 (2 C), 103.1, 31.8, 30.2 (2 C), 26.0, 25.5 (2 C), 22.6. HRMS-ESI (+) m/z calcd for C24H27N4O2 [M + H]+ 403.2129, found: 403.2124.
(E)-N'-((1H-pyrrol-2-yl)methylene)-4-((8-hydroxy-2-methylquinolin-4-yl)amino)benzohydrazide (N2)
Yellow solid; 72 mg, yield 75%; mp: 234–236 °C. HPLC purity: 99.0%. 1H NMR (600 MHz, DMSO-d6) δ = 11.66 (s, 1H), 11.56 (br s, 1H), 10.14 (br s, 1H), 8.35 (s, 1H), 8.05 (br d, J = 8.3 Hz, 2H), 7.98 (br d, J = 8.1 Hz, 1H), 7.57 (br d, J = 8.4 Hz, 2H), 7.50 (br t, J = 8.0 Hz, 1H), 7.30 (br d, J = 7.3 Hz, 1H), 6.96 (s, 1H), 6.94 − 6.91 (m, 1H), 6.55 − 6.46 (m, 1H), 6.19 − 6.12 (m, 1H), 2.62 (s, 3H); 13C NMR (151 MHz, DMSO-d6) δ 162.3, 158.5, 158.3, 155.8, 141.3, 130.9, 129.6 (2 C), 127.6, 126.8, 123.6, 123.5, 123.0, 118.7, 116.7, 113.7, 112.9 (2 C), 109.7 (2 C), 102.6, 22.2. HRMS-ESI (+) m/z calcd for C22H20N5O2 [M + H]+ 386.1612, found: 386.1606.
(E)-4-((8-hydroxy-2-methylquinolin-4-yl)amino)-N'-(thiophen-2-ylmethylene)benzohydrazide (N3)
Yellow solid; 100 mg, yield 99%; mp: 216–218 °C. HPLC purity: 99.0%. 1H NMR (600 MHz, DMSO-d6) δ = 11.94 (br s, 1H), 9.96 (br s, 1H), 8.73 (s, 1H), 8.03 (br d, J = 8.1 Hz, 2H), 7.93 (br d, J = 8.1 Hz, 1H), 7.69 (br d, J = 4.8 Hz, 1H), 7.56 (br d, J = 8.3 Hz, 2H), 7.50 − 7.44 (m, 2H), 7.25 (br d, J = 7.3 Hz, 1H), 7.16 (t, J = 1.0 Hz, 1H), 7.01 (s, 1H), 2.61 (s, 3H); 13C NMR (151 MHz, DMSO-d6) δ 162.7, 158.5, 158.3, 156.1, 143.2, 143.0, 139.7, 131.3, 129.7 (2 C), 129.4, 128.4 (2 C), 126.5, 122.8, 119.0, 118.7, 116.8, 112.8 (2 C), 103.1, 22.7. HRMS-ESI (+) m/z calcd for C22H19N4O2S [M + H]+ 403.1223, found: 403.1218.
(E)-4-((8-hydroxy-2-methylquinolin-4-yl)amino)-N'-((5-methylthiophen-2-yl)methylene)benzohydrazide (N4)
Yellow solid; 101 mg, yield 97%; mp: 225–227 °C. HPLC purity: 99.9%. 1H NMR (600 MHz, DMSO-d6) δ = 11.82 (br s, 1H), 9.96 (br s, 1H), 8.61 (s, 1H), 8.02 (br d, J = 7.9 Hz, 2H), 7.92 (br d, J = 7.9 Hz, 1H), 7.56 (br d, J = 8.3 Hz, 2H), 7.48 (br t, J = 7.9 Hz, 1H), 7.27 (br d, J = 2.9 Hz, 1H), 7.25 (br d, J = 7.3 Hz, 1H), 7.00 (s, 1H), 6.85 (br s, 1H), 2.62 (s, 3H), 2.49 (s, 3H); 13C NMR (151 MHz, DMSO-d6) δ 162.6, 158.5, 158.3, 156.1, 143.5 (2 C), 143.4, 137.4, 131.8, 129.6 (2 C), 126.8, 126.6 (2 C), 123.0, 118.9, 118.7, 116.7, 112.8 (2 C), 103.0, 15.8 (2 C). HRMS-ESI (+) m/z calcd for C23H21N4O2S [M + H]+ 417.1380, found: 417.1375.
(E)-N'-benzylidene-4-((8-hydroxy-2-methylquinolin-4-yl)amino)benzohydrazide (N5)
Yellow solid; 96 mg, yield 97%; mp: 235–237 °C. HPLC purity: 99.8%. 1H NMR (600 MHz, DMSO-d6) δ = 12.03 (s, 1H), 10.52 (br s, 1H), 8.52 (s, 1H), 8.11 (br d, J = 8.3 Hz, 2H), 8.05 (br d, J = 8.4 Hz, 1H), 7.75 (br d, J = 7.0 Hz, 2H), 7.63 (br d, J = 8.3 Hz, 2H), 7.57 (br t, J = 8.2 Hz, 1H), 7.52 − 7.42 (m, 3H), 7.39 (br d, J = 7.7 Hz, 1H), 6.94 (s, 1H), 2.66 (s, 3H); 13C NMR (151 MHz, DMSO-d6) δ 162.8, 158.5, 158.3, 155.3, 148.4, 141.5, 134.8, 130.6, 129.8 (2 C), 129.3 (3 C), 127.6 (2 C), 127.5, 124.6, 118.7, 118.4, 116.7, 112.9 (2 C), 102.0, 20.9. HRMS-ESI (+) m/z calcd for C24H21N4O2 [M + H]+ 397.1659, found: 397.1654.
(E)-4-((8-hydroxy-2-methylquinolin-4-yl)amino)-N'-(4-methylbenzylidene)benzohydrazide (N6)
Pale yellow solid; 98 mg, yield 96%; mp: 241–243 °C. HPLC purity: 99.9%. 1H NMR (600 MHz, DMSO-d6) δ = 11.90 (br s, 1H), 10.16 (br s, 1H), 8.47 (s, 1H), 8.07 (br d, J = 8.1 Hz, 2H), 7.96 (br d, J = 8.1 Hz, 1H), 7.64 (br d, J = 7.5 Hz, 2H), 7.59 (br d, J = 8.3 Hz, 2H), 7.51 (br t, J = 8.1 Hz, 1H), 7.34 − 7.24 (m, 3H), 6.98 (s, 1H), 2.64 (s, 3H), 2.35 (s, 3H); 13C NMR (151 MHz, DMSO-d6) δ 162.8, 158.6, 158.4, 155.8, 148.2, 142.3, 140.4, 132.1, 129.9 (3), 129.7 (2 C), 127.5 (2 C), 126.9, 123.6, 118.7, 116.7, 114.8, 112.8 (2 C), 102.6, 21.5 (2 C). HRMS-ESI (+) m/z calcd for C25H23N4O2 [M + H]+ 411.1816, found: 411.1811.
(E)-N'-(4-(dimethylamino)benzylidene)-4-((8-hydroxy-2-methylquinolin-4-yl)amino)benzohydrazide (N7)
Yellow solid; 65 mg, yield 59%; mp: 239–241 °C. HPLC purity: 98.6%. 1H NMR (600 MHz, DMSO-d6) δ = 11.63 (s, 1H), 9.92 (br s, 1H), 8.35 (s, 1H), 8.03 (br d, J = 8.3 Hz, 2H), 7.92 (br d, J = 8.1 Hz, 1H), 7.55 (br d, J = 8.4 Hz, 4H), 7.47 (br t, J = 7.9 Hz, 1H), 7.24 (br d, J = 7.0 Hz, 1H), 7.00 (s, 1H), 6.77 (br d, J = 8.6 Hz, 2H), 2.98 (s, 6H), 2.61 (s, 3H); 13C NMR (151 MHz, DMSO-d6) δ 162.4, 158.7, 158.5, 158.3, 156.1, 152.0, 149.0, 129.6 (2 C), 128.9 (2 C), 126.5, 123.0, 122.9, 122.1, 118.9, 118.7, 116.7, 112.7 (2 C), 112.3 (2 C), 102.9, 49.1 (2 C), 22.7. HRMS-ESI (+) m/z calcd for C26H26N5O2 [M + H]+ 440.2081, found: 440.2076.
(E)-4-((2–(4-((8-hydroxy-2-methylquinolin-4-yl)amino)benzoyl)hydrazineylidene)methyl)phenyl acetate (N8)
Yellow solid; 109 mg, yield 96%; mp: 241–243 °C. HPLC purity: 95.0%. 1H NMR (600 MHz, DMSO-d6) δ = 11.94 (br s, 1H), 9.74 (br s, 1H), 8.51 (br s, 1H), 8.04 (br d, J = 7.9 Hz, 2H), 7.88 (br d, J = 7.2 Hz, 1H), 7.79 (br d, J = 7.9 Hz, 2H), 7.55 (br d, J = 8.1 Hz, 2H), 7.44 (br t, J = 7.9 Hz, 1H), 7.25 (br d, J = 8.1 Hz, 2H), 7.20 (br d, J = 6.8 Hz, 1H), 7.05 (s, 1H), 2.60 (s, 3H), 2.51 (br s, 3H); 13C NMR (151 MHz, DMSO-d6) δ 169.6, 162.9, 158.5, 158.3, 156.4, 152.2, 150.9, 147.1, 132.5, 129.7 (2 C), 129.3, 128.7 (2 C), 126.2, 122.9 (2 C), 122.2, 118.7, 116.7, 116.2, 112.7 (2 C), 103.5, 21.4. HRMS-ESI (+) m/z calcd for C26H23N4O4 [M + H]+ 455.1714, found: 455.1709.
(E)-4-((8-hydroxy-2-methylquinolin-4-yl)amino)-N'-(3-phenoxybenzylidene)benzohydrazide (N9)
Yellow solid; 114 mg, yield 93%; mp: 214–216 °C. HPLC purity: 98.7%. 1H NMR (600 MHz, DMSO-d6) δ = 11.93 (br s, 1H), 9.67 (br s, 1H), 8.48 (br s, 1H), 8.00 (br d, J = 7.9 Hz, 2H), 7.86 (br d, J = 7.5 Hz, 1H), 7.53 (br d, J = 7.7 Hz, 2H), 7.50 − 7.47 (m, 2H), 7.46 − 7.43 (m, 2H), 7.43 − 7.41 (m, 1H), 7.37 (br s, 1H), 7.22 − 7.16 (m, 2H), 7.13 − 7.10 (m, 1H), 7.10 − 7.07 (m, 2H), 7.05 (s, 1H), 2.59 (s, 3H); 13C NMR (151 MHz, DMSO-d6) δ 162.9, 158.5, 158.2, 157.8, 156.7, 156.5, 147.2, 143.4, 136.9, 131.1, 130.7 (3 C), 129.7 (2 C), 126.2, 124.3 (2 C), 123.3, 121.9, 120.7, 119.5 (2 C), 118.7, 116.7, 116.0, 112.6 (2 C), 103.7, 23.6. HRMS-ESI (+) m/z calcd for C30H25N4O3 [M + H]+ 489.1921, found: 489.1916.
(E)-4-((8-hydroxy-2-methylquinolin-4-yl)amino)-N'-(3-hydroxy-4-methoxybenzylidene)benzohydrazide (N10)
Yellow solid; 96 mg, yield 87%; mp: 207–209 °C. HPLC purity: 99.9%. 1H NMR (600 MHz, DMSO-d6) δ = 11.73 (br s, 1H), 9.68 (br s, 1H), 9.35 (br s, 1H), 8.34 (s, 1H), 8.01 (br d, J = 8.3 Hz, 2H), 7.86 (br d, J = 7.9 Hz, 1H), 7.53 (br d, J = 8.4 Hz, 2H), 7.43 (br t, J = 7.9 Hz, 1H), 7.29 (s, 1H), 7.19 (br d, J = 7.2 Hz, 1H), 7.07 (br d, J = 8.1 Hz, 1H), 7.04 (s, 1H), 6.99 (br d, J = 8.3 Hz, 1H), 3.82 (s, 3H), 2.60 (s, 3H); 13C NMR (151 MHz, DMSO-d6) δ 162.7, 158.5, 158.3, 156.4, 150.2, 148.2, 147.4, 147.4, 129.6 (3 C), 127.7, 126.2, 122.2, 120.7, 119.2, 118.7, 116.7, 112.8, 112.6 (2 C), 112.3, 103.5, 56.0, 23.4. HRMS-ESI (+) m/z calcd for C25H23N4O4 [M + H]+ 443.1714, found: 443.1708.
(E)-4-((8-hydroxy-2-methylquinolin-4-yl)amino)-N'-(pyridin-4-ylmethylene)benzohydrazide (N11)
Yellow solid; 94 mg, yield 95%; mp: 225–227 °C. HPLC purity: 98.0%. 1H NMR (600 MHz, DMSO-d6) δ = 12.17 (br s, 1H), 9.54 (br s, 1H), 8.67 (br s, 2H), 8.48 (s, 1H), 8.09 − 7.98 (m, 2H), 7.86 − 7.79 (m, 1H), 7.69 (br s, 2H), 7.54 (br d, J = 8.1 Hz, 2H), 7.41 (br t, J = 7.4 Hz, 1H), 7.15 (br d, J = 6.6 Hz, 1H), 7.10 (br s, 1H), 2.59 (s, 3H); 13C NMR (151 MHz, DMSO-d6) δ 163.2, 158.4, 158.2, 156.7, 150.8 (2 C), 145.4, 144.0, 142.1, 130.0, 129.8 (2 C), 126.0, 125.9, 121.4 (2 C), 119.5, 118.8, 116.8, 112.6 (2 C), 104.1, 24.1. HRMS-ESI (+) m/z calcd for C23H20N5O2 [M + H]+ 398.1612, found: 398.1605.
(E)-4-((8-hydroxy-2-methylquinolin-4-yl)amino)-N’-((6-methylpyridin-2-yl)methylene)benzohydrazide (N12)
Yellow solid; 75 mg, yield 73%; mp: 215–217 °C. HPLC purity: 99.2%. 1H NMR (600 MHz, DMSO-d6) δ = 15.78 (br s, 1H), 9.99 (br s, 1H), 8.05 (br d, J = 8.1 Hz, 2H), 8.02 (t, J = 7.8 Hz, 1H), 7.92 (br d, J = 8.1 Hz, 1H), 7.69 (br s, 1H), 7.65 (br s, 1H), 7.64 (br s, 2H), 7.51 − 7.48 (m, 1H), 7.47 (s, 1H), 7.25 (br d, J = 7.2 Hz, 1H), 7.08 (s, 1H), 2.68 (s, 3H), 2.63 (s, 3H); 13C NMR (151 MHz, DMSO-d6) δ 162.9, 158.5, 158.2, 158.0, 157.4, 156.1, 152.0, 139.5, 139.4, 129.3 (2 C), 126.7, 124.9, 124.4, 123.2, 120.7, 119.0, 118.7, 116.7, 112.7 (2 C), 103.4, 24.4 (2 C). HRMS-ESI (+) m/z calcd for C24H22N5O2 [M + H]+ 412.1768, found: 412.1760.
(E)-N'-((2-chloropyridin-4-yl)methylene)-4-((8-hydroxy-2-methylquinolin-4-yl)amino)benzohydrazide (N13)
Pale yellow solid; 103 mg, yield 95%; mp: 243–245 °C. HPLC purity: 98.7%. 1H NMR (600 MHz, DMSO-d6) δ = 12.31 (br s, 1H), 9.52 (br s, 1H), 8.49 (s, 1H), 8.49 − 8.44 (m, 1H), 8.02 (br d, J = 7.2 Hz, 2H), 7.82 (br d, J = 7.7 Hz, 1H), 7.78 (br s, 1H), 7.74 − 7.69 (m, 1H), 7.53 (br d, J = 8.4 Hz, 2H), 7.40 (br t, J = 7.9 Hz, 1H), 7.14 (br d, J = 7.2 Hz, 1H), 7.10 (s, 1H), 2.59 (s, 3H); 13C NMR (151 MHz, DMSO-d6) δ 163.3, 158.5, 158.3, 156.8, 151.5, 151.0, 146.1, 145.9, 143.7, 129.9 (2 C), 125.9, 121.9, 121.4, 120.5 (2 C), 119.5, 118.8, 116.8, 112.6 (2 C), 104.3, 23.7. HRMS-ESI (+) m/z calcd for C23H19ClN5O2 [M + H]+ 432.1222, found: 432.1220.
(E)-N’-((1H-indol-2-yl)methylene)-4-((8-hydroxy-2-methylquinolin-4-yl)amino)benzohydrazide (N14)
Yellow solid; 45 mg, yield 41%; mp: 235–237 °C. HPLC purity: 99.9%. 1H NMR (600 MHz, DMSO-d6) δ = 11.94 (br s, 1H), 11.61 (br s, 1H), 9.96 (br s, 1H), 8.54 (s, 1H), 8.08 (br d, J = 8.3 Hz, 2H), 7.93 (br d, J = 7.5 Hz, 1H), 7.58 (br s, 1H), 7.57 (t, J = 8.1 Hz, 2H), 7.53 − 7.47 (m, 1H), 7.46 (br t, J = 7.9 Hz, 1H), 7.25 (br d, J = 6.8 Hz, 1H), 7.17 (t, J = 7.5 Hz, 1H), 7.02 (br t, J = 7.4 Hz, 2H), 6.86 (s, 1H), 2.62 (s, 3H); 13C NMR (151 MHz, DMSO-d6) δ 162.7, 158.5, 158.3, 156.1, 150.8, 140.9, 138.4, 133.7, 129.7 (2 C), 128.1, 126.6, 123.8, 123.1, 123.0, 121.2, 120.0, 119.0, 118.7, 116.7, 112.8 (2 C), 112.5, 107.2, 103.1, 22.7. HRMS-ESI (+) m/z calcd for C26H22N5O2 [M + H]+ 436.1768, found: 436.1761.
(E)-N'-((1H-benzo[d]imidazol-2-yl)methylene)-4-((8-hydroxy-2-methylquinolin-4-yl)amino)benzohydrazide (N15)
Yellow solid; 99 mg, yield 91%; mp: 323–325 °C. HPLC purity: 99.9%. 1H NMR (600 MHz, DMSO-d6) δ = 13.02 (br s, 1H), 12.23 (br s, 1H), 9.59 (br s, 1H), 8.55 (br s, 1H), 8.06 (br d, J = 8.4 Hz, 2H), 7.84 (br d, J = 6.8 Hz, 1H), 7.67 (br d, J = 7.3 Hz, 1H), 7.56 (br d, J = 8.4 Hz, 2H), 7.52 (br d, J = 7.3 Hz, 1H), 7.42 (br t, J = 7.5 Hz, 1H), 7.32 − 7.24 (m, 1H), 7.22 (br d, J = 7.3 Hz, 1H), 7.18 − 7.13 (m, 1H), 7.10 (br s, 1H), 2.60 (s, 3H); 13C NMR (151 MHz, DMSO-d6) δ 163.1, 158.4, 158.2, 156.7, 148.5, 144.3, 144.1, 139.4, 139.4, 135.2, 129.9 (2 C), 126.1, 124.3, 122.4 (2 C), 119.8, 118.7, 116.7, 112.6 (2 C), 112.5 (2 C), 102.3, 29.5. HRMS-ESI (+) m/z calcd for C25H21N6O2 [M + H]+ 437.1721, found: 437.1714.
(E)-4-((8-hydroxy-2-methylquinolin-4-yl)amino)-N'-(thiophen-3-ylmethylene)benzohydrazide (7A)
Yellow solid; 95 mg, yield 94%; mp: 257–259 °C. HPLC purity: 99.6%. 1H NMR (600 MHz, DMSO-d6) δ = 11.82 (br s, 1H), 9.91 (br s, 1H), 8.53 (s, 1H), 8.03 (br d, J = 8.1 Hz, 2H), 7.95 (br s, 1H), 7.91 (br d, J = 8.1 Hz, 1H), 7.68 − 7.63 (m, 1H), 7.56 (br d, J = 8.3 Hz, 2H), 7.51 (br d, J = 4.6 Hz, 1H), 7.47 (br t, J = 8.0 Hz, 1H), 7.24 (br d, J = 7.0 Hz, 1H), 7.01 (s, 1H), 2.61 (s, 3H); 13C NMR (151 MHz, DMSO-d6) δ 162.8, 158.5, 158.3, 156.2, 150.5, 143.8, 138.1, 129.7 (2 C), 128.7, 128.2 (2 C), 126.5, 125.1, 122.8, 119.0, 118.7, 116.7, 112.7 (2 C), 103.1, 22.8. HRMS-ESI (+) m/z calcd for C22H19N4O2S [M + H]+ 403.1223, found: 403.1220.
(E)-N'-((3-bromothiophen-2-yl)methylene)-4-((8-hydroxy-2-methylquinolin-4-yl)amino)benzohydrazide (7B)
Pale yellow solid; 118 mg, yield 98%; mp: 219–221 °C. HPLC purity: 99.8%. 1H NMR (600 MHz, DMSO-d6) δ = 12.06 (br s, 1H), 9.79 (br s, 1H), 8.76 (s, 1H), 8.03 (br d, J = 7.9 Hz, 2H), 7.89 (br d, J = 7.9 Hz, 1H), 7.81 (br d, J = 5.1 Hz, 1H), 7.56 (br d, J = 8.1 Hz, 2H), 7.45 (br t, J = 8.0 Hz, 1H), 7.23 (d, J = 5.1 Hz, 1H), 7.21 (br d, J = 7.5 Hz, 1H), 7.05 (s, 1H), 2.61 (s, 3H); 13C NMR (151 MHz, DMSO-d6) δ 162.7, 158.5, 158.3, 156.4, 150.9, 141.4, 134.3, 131.2 (2 C), 130.3, 129.7 (2 C), 126.3, 122.3, 119.2, 118.7, 116.7, 113.8, 112.7 (2 C), 103.5, 23.2. HRMS-ESI (+) m/z calcd for C22H18BrN4O2S [M + H]+ 481.0328, found: 481.0327, 483.0303.
(E)-N'-((4-bromothiophen-2-yl)methylene)-4-((8-hydroxy-2-methylquinolin-4-yl)amino)benzohydrazide (7C)
Yellow solid; 118 mg, yield 98%; mp: 241–243 °C. HPLC purity: 99.6%. 1H NMR (600 MHz, DMSO-d6) δ = 12.05 (br s, 1H), 10.14 (br s, 1H), 8.67 (s, 1H), 8.04 (br d, J = 7.9 Hz, 2H), 7.96 (br d, J = 8.1 Hz, 1H), 7.79 (s, 1H), 7.59 (br d, J = 8.1 Hz, 2H), 7.56 (s, 1H), 7.51 (br t, J = 8.0 Hz, 1H), 7.29 (br d, J = 7.3 Hz, 1H), 6.99 (s, 1H), 2.63 (s, 3H); 13C NMR (151 MHz, DMSO-d6) δ 162.8, 158.5, 158.3, 155.8, 149.8, 141.8, 141.1, 132.8, 129.8 (2 C), 126.9, 126.6, 123.8, 123.5, 118.8, 118.7, 116.7, 112.8 (2 C), 109.7, 102.7, 22.1. HRMS-ESI (+) m/z calcd for C22H18BrN4O2S [M + H]+ 481.0328, found: 481.0324, 483.0301.
(E)-4-((8-hydroxy-2-methylquinolin-4-yl)amino)-N'-((4-methylthiazol-5-yl)methylene)benzohydrazide (TMHA37(7D))
Yellow solid; 97 mg, yield 93%; mp: 255–257 °C. HPLC purity: 99.9%. 1H NMR (600 MHz, DMSO-d6) δ = 12.08 (s, 1H), 10.61 (br s, 1H), 9.09 (s, 1H), 8.82 (s, 1H), 8.10 (br d, J = 8.4 Hz, 2H), 8.06 (d, J = 8.4 Hz, 1H), 7.65 (br d, J = 8.3 Hz, 2H), 7.59 (t, J = 8.2 Hz, 1H), 7.41 (d, J = 7.9 Hz, 1H), 6.93 (s, 1H), 2.67 (s, 3H), 2.52 (s, 3H); 13C NMR (151 MHz, DMSO-d6) δ 162.5, 158.7, 158.5, 155.5, 155.2, 154.7, 148.3, 141.4, 131.5, 129.7 (2 C), 128.1, 127.7, 125.0, 118.7, 118.3, 116.4, 112.9 (2 C), 101.8, 20.5, 15.8. HRMS-ESI (+) m/z calcd for C22H20N5O2S [M + H]+ 418.1332, found: 418.1326.
(E)-4-((8-hydroxy-2-methylquinolin-4-yl)amino)-N'-(4-(methylthio)benzylidene)benzohydrazide (7E)
Yellow solid; 93 mg, yield 84%; mp: 245–247 °C. HPLC purity: 99.9%. 1H NMR (600 MHz, DMSO-d6) δ = 11.90 (br s, 1H), 10.03 (br s, 1H), 8.45 (s, 1H), 8.05 (br d, J = 7.9 Hz, 2H), 7.94 (br d, J = 8.1 Hz, 1H), 7.68 (br d, J = 8.1 Hz, 2H), 7.58 (br d, J = 8.3 Hz, 2H), 7.49 (br t, J = 8.0 Hz, 1H), 7.34 (br d, J = 8.1 Hz, 2H), 7.27 (br d, J = 7.3 Hz, 1H), 7.00 (s, 1H), 2.63 (s, 3H), 2.53 (s, 3H); 13C NMR (151 MHz, DMSO-d6) δ 162.8, 158.5, 158.3, 156.0, 147.7, 141.4, 131.2, 129.7 (2 C), 128.0 (2 C), 126.7, 126.1 (3 C), 123.1, 123.1, 118.9, 118.7, 116.7, 112.8 (2 C), 102.9, 22.5, 14.7. HRMS-ESI (+) m/z calcd for C25H23N4O2S [M + H]+ 443.1536, found: 443.1530.
(E)-N'-(2-chlorobenzylidene)-4-((8-hydroxy-2-methylquinolin-4-yl)amino)benzohydrazide (7F)
Yellow solid; 100 mg, yield 93%; mp: 222–224 °C. HPLC purity: 99.8%. 1H NMR (600 MHz, DMSO-d6) δ = 12.13 (br s, 1H), 9.58 (br s, 1H), 8.91 (br s, 1H), 8.13 − 7.97 (m, 3H), 7.84 (br d, J = 8.1 Hz, 1H), 7.57 − 7.50 (m, 3H), 7.49 − 7.43 (m, 2H), 7.41 (br t, J = 8.0 Hz, 1H), 7.16 (br d, J = 7.2 Hz, 1H), 7.09 (s, 1H), 2.59 (s, 3H); 13C NMR (151 MHz, DMSO-d6) δ 163.0, 158.4, 158.2, 156.7, 144.1, 143.8, 133.6, 132.1, 131.9, 130.4 (2 C), 129.7 (2 C), 128.1, 127.3, 126.0, 121.6 (2 C), 119.4, 118.7, 116.7, 112.6, 104.0, 23.9. HRMS-ESI (+) m/z calcd for C24H20ClN4O2 [M + H]+ 431.1269, found: 431.1266.
(E)-4-((8-hydroxy-2-methylquinolin-4-yl)amino)-N'-(3-(trifluoromethyl)benzylidene)benzohydrazide (7G)
Pale yellow solid; 102 mg, yield 88%; mp: 252–254 °C. HPLC purity: 99.9%. 1H NMR (600 MHz, DMSO-d6) δ = 12.22 (s, 1H), 10.61 (br s, 1H), 8.59 (s, 1H), 8.13 (br d, J = 8.3 Hz, 2H), 8.10 (br s, 1H), 8.08 − 8.04 (m, 2H), 7.82 (br d, J = 7.5 Hz, 1H), 7.73 (br t, J = 7.6 Hz, 1H), 7.66 (br d, J = 8.3 Hz, 2H), 7.60 (t, J = 8.1 Hz, 1H), 7.41 (d, J = 7.9 Hz, 1H), 6.94 (s, 1H), 2.68 (s, 3H); 13C NMR (151 MHz, DMSO-d6) δ 163.0, 158.6, 158.4, 155.2, 148.3, 146.6, 141.3, 136.0, 131.6, 130.6, 130.1, 129.9 (2 C), 127.7, 126.8, 125.0, 123.6, 123.4, 118.7, 118.3, 116.4, 113.0 (2 C), 101.8, 20.5. HRMS-ESI (+) m/z calcd for C25H20F3N4O2 [M + H]+ 465.1533, found: 465.1526.
(E)-4-((8-hydroxy-2-methylquinolin-4-yl)amino)-N'-(4-(trifluoromethyl)benzylidene)benzohydrazide (7H)
Yellow solid; 105 mg, yield 90%; mp: 239–241 °C. HPLC purity: 99.8%. 1H NMR (600 MHz, DMSO-d6) δ = 12.15 (br s, 1H), 10.06 (br s, 1H), 8.58 (br s, 1H), 8.08 (br d, J = 7.5 Hz, 2H), 8.02 − 7.91 (m, 3H), 7.84 (br d, J = 7.5 Hz, 2H), 7.59 (br d, J = 8.1 Hz, 2H), 7.50 (br t, J = 7.9 Hz, 1H), 7.27 (br d, J = 7.2 Hz, 1H), 7.02 (s, 1H), 2.63 (s, 3H); 13C NMR (151 MHz, DMSO-d6) δ 163.0, 158.5, 158.3, 156.0, 146.3, 142.9, 138.8, 129.8 (2 C), 128.1 (2 C), 126.8, 126.2 (2 C), 126.2, 125.5, 123.7, 123.1, 118.9, 118.7, 116.8, 112.8 (2 C), 103.0, 22.6. HRMS-ESI (+) m/z calcd for C25H20F3N4O2 [M + H]+ 465.1533, found: 465.1529.
(E)-N'-(4-ethynylbenzylidene)-4-((8-hydroxy-2-methylquinolin-4-yl)amino)benzohydrazide (7I)
Yellow solid; 64 mg, yield 61%; mp: 220–222 °C. HPLC purity: 99.9%. 1H NMR (600 MHz, DMSO-d6) δ = 12.00 (br s, 1H), 9.66 (br s, 1H), 8.50 (br s, 1H), 8.03 (br d, J = 7.7 Hz, 2H), 7.85 (br d, J = 8.1 Hz, 1H), 7.76 (br d, J = 7.5 Hz, 2H), 7.57 (br d, J = 7.7 Hz, 2H), 7.54 (br d, J = 8.4 Hz, 2H), 7.43 (br t, J = 7.9 Hz, 1H), 7.18 (br d, J = 7.3 Hz, 1H), 7.07 (s, 1H), 4.36 (s, 1H), 2.60 (s, 3H); 13C NMR (151 MHz, DMSO-d6) δ 163.0, 158.5, 158.3, 156.5, 146.9, 146.9, 135.3, 132.6 (3 C), 129.7 (2 C), 127.6 (2 C), 126.1, 123.4, 121.9, 119.3, 118.7, 116.7, 112.6 (2 C), 103.7, 83.7, 83.0, 23.8. HRMS-ESI (+) m/z calcd for C26H21N4O2 [M + H]+ 421.1659, found: 421.1652.
(E)-N’-(3,5-dimethoxybenzylidene)-4-((8-hydroxy-2-methylquinolin-4-yl)amino)benzohydrazide (7J)
Yellow solid; 100 mg, yield 88%; mp: 229–231 °C. HPLC purity: 99.9%. 1H NMR (600 MHz, DMSO-d6) δ = 11.95 (br s, 1H), 9.93 (br s, 1H), 8.42 (br s, 1H), 8.04 (br d, J = 7.9 Hz, 2H), 7.91 (br d, J = 7.5 Hz, 1H), 7.57 (br d, J = 8.3 Hz, 2H), 7.47 (br t, J = 8.0 Hz, 1H), 7.24 (br d, J = 7.0 Hz, 1H), 7.02 (s, 1H), 6.89 (br s, 2H), 6.59 (br s, 1H), 3.81 (s, 6H), 2.62 (s, 3H); 13C NMR (151 MHz, DMSO-d6) δ 162.9, 161.2 (2 C), 158.5, 158.3, 156.2, 148.0, 143.1, 136.9, 129.8, 129.7 (2 C), 126.6, 122.8, 119.0, 118.7, 116.7, 112.7 (2 C), 105.3 (3 C), 102.7, 55.8 (2 C), 19.0. HRMS-ESI (+) m/z calcd for C26H25N4O4 [M + H]+ 457.1870, found: 457.1865.
(E)-N'-(2-fluoro-5-methoxybenzylidene)-4-((8-hydroxy-2-methylquinolin-4-yl)amino)benzohydrazide (7K)
Yellow solid; 74 mg, yield 67%; mp: 223–225 °C. HPLC purity: 98.6%. 1H NMR (600 MHz, DMSO-d6) δ = 12.04 (br s, 1H), 9.60 (br s, 1H), 8.71 (br s, 1H), 8.02 (br d, J = 8.1 Hz, 2H), 7.84 (br d, J = 8.1 Hz, 1H), 7.54 (br d, J = 8.3 Hz, 2H), 7.45 − 7.35 (m, 2H), 7.25 (br t, J = 9.4 Hz, 1H), 7.16 (br d, J = 7.2 Hz, 1H), 7.08 (s, 1H), 7.07 − 7.00 (m, 1H), 3.81 (s, 3H), 2.59 (s, 3H); 13C NMR (151 MHz, DMSO-d6) δ 162.9, 158.5, 158.3, 156.7, 156.6, 156.1, 155.1, 151.4, 140.5, 129.7 (2 C), 126.0, 122.8, 122.8, 121.7, 119.4, 118.7, 118.6, 118.6, 117.5, 117.4, 116.7, 112.6 (2 C), 109.3, 103.8, 56.1, 23.8. HRMS-ESI (+) m/z calcd for C25H22FN4O3 [M + H]+ 445.1670, found: 445.1665.
(E)-N'-(2,3-difluorobenzylidene)-4-((8-hydroxy-2-methylquinolin-4-yl)amino)benzohydrazide (7L)
Yellow solid; 102 mg, yield 94%; mp: 221–223 °C. HPLC purity: 95.3%. 1H NMR (600 MHz, DMSO-d6) δ = 12.15 (br s, 1H), 9.77 (br s, 1H), 8.74 (br s, 1H), 8.05 (br d, J = 7.3 Hz, 2H), 7.88 (br d, J = 7.7 Hz, 1H), 7.80 − 7.71 (m, 1H), 7.56 (br d, J = 8.1 Hz, 2H), 7.53 − 7.48 (m, 1H), 7.45 (br t, J = 8.0 Hz, 1H), 7.35 − 7.27 (m, 1H), 7.21 (br d, J = 7.0 Hz, 1H), 7.06 (s, 1H), 2.61 (s, 3H); 13C NMR (151 MHz, DMSO-d6) δ 162.9, 158.5, 158.3, 156.4, 151.2, 149.7, 149.6, 139.6, 129.8 (2 C), 126.3, 125.7, 125.7, 124.8, 124.8, 122.0, 119.2, 119.0, 118.7, 116.7, 112.7 (2 C), 103.6, 23.3. HRMS-ESI (+) m/z calcd for C24H19F2N4O2 [M + H]+ 433.1471, found: 433.1466.
(E)-N'-(4-bromo-3-fluorobenzylidene)-4-((8-hydroxy-2-methylquinolin-4-yl)amino)benzohydrazide (7M)
Yellow solid; 121 mg, yield 98%; mp: 249–251 °C. HPLC purity: 99.9%. 1H NMR (600 MHz, DMSO-d6) δ = 12.11 (br s, 1H), 9.90 (br s, 1H), 8.47 (br s, 1H), 8.05 (br d, J = 7.3 Hz, 2H), 7.90 (br d, J = 7.7 Hz, 1H), 7.81 (br t, J = 7.5 Hz, 1H), 7.70 (br d, J = 9.2 Hz, 1H), 7.58 (br s, 1H), 7.56 (d, J = 8.1 Hz, 2H), 7.47 (br t, J = 7.9 Hz, 1H), 7.23 (br d, J = 7.0 Hz, 1H), 7.03 (s, 1H), 2.62 (s, 3H); 13C NMR (151 MHz, DMSO-d6) δ 163.0, 159.8, 158.5, 158.2, 156.2, 150.6, 145.7, 137.0, 136.9, 134.5, 129.8 (2 C), 126.5, 125.0, 122.6, 119.0, 118.7, 116.7, 114.9, 112.7 (2 C), 110.0, 103.2, 22.6. HRMS-ESI (+) m/z calcd for C24H19BrFN4O2 [M + H]+ 493.0670, found: 493.0669, 495.0647.
(E)-N'-(3-bromo-4-fluorobenzylidene)-4-((8-hydroxy-2-methylquinolin-4-yl)amino)benzohydrazide (7N)
Pale yellow solid; 113 mg, yield 92%; mp: 245–247 °C. HPLC purity: 98.7%. 1H NMR (600 MHz, DMSO-d6) δ = 12.06 (br s, 1H), 9.70 (br s, 1H), 8.46 (br s, 1H), 8.08 (br d, J = 5.5 Hz, 1H), 8.03 (br d, J = 7.9 Hz, 2H), 7.86 (br d, J = 7.7 Hz, 1H), 7.81 (br s, 1H), 7.54 (br d, J = 8.4 Hz, 2H), 7.49 (br t, J = 8.5 Hz, 1H), 7.43 (br t, J = 8.0 Hz, 1H), 7.19 (br d, J = 7.0 Hz, 1H), 7.06 (s, 1H), 2.60 (s, 3H); 13C NMR (151 MHz, DMSO-d6) δ 163.0, 160.3, 158.5, 158.3, 156.5, 145.2, 143.8, 133.3, 132.0 (2 C), 129.7 (2 C), 128.9, 126.2, 122.0, 118.8, 117.9, 117.7, 116.8, 112.7 (2 C), 109.2, 103.7, 23.6. HRMS-ESI (+) m/z calcd for C24H19BrFN4O2 [M + H]+ 493.0670, found: 493.0665, 495.0643.
(E)-N'-(2-bromo-4-fluorobenzylidene)-4-((8-hydroxy-2-methylquinolin-4-yl)amino)benzohydrazide (7O)
Yellow solid; 121 mg, yield 98%; mp: 231–233 °C. HPLC purity: 99.9%. 1H NMR (600 MHz, DMSO-d6) δ = 12.19 (br s, 1H), 9.92 (br s, 1H), 8.82 (br s, 1H), 8.06 (br d, J = 7.7 Hz, 3H), 7.91 (br d, J = 7.9 Hz, 1H), 7.70 (dd, J = 2.3, 8.5 Hz, 1H), 7.58 (br d, J = 8.3 Hz, 2H), 7.47 (br t, J = 8.0 Hz, 1H), 7.39 (br t, J = 7.5 Hz, 1H), 7.24 (br d, J = 7.3 Hz, 1H), 7.04 (s, 1H), 2.62 (s, 3H); 13C NMR (151 MHz, DMSO-d6) δ 163.8, 162.9, 158.5, 158.3, 156.2, 145.3, 143.2, 130.4, 129.8 (2 C), 129.3, 129.2, 126.5, 124.3, 122.7, 120.6, 118.9, 116.7, 116.3, 116.2, 112.7 (2 C), 103.3, 22.8. HRMS-ESI (+) m/z calcd for C24H19BrFN4O2 [M + H]+ 493.0670, found: 493.0666, 495.0644.
(E)-N'-(2-fluoro-5-(trifluoromethyl)benzylidene)-4-((8-hydroxy-2-methylquinolin-4-yl)amino)benzohydrazide (7P)
Yellow solid; 115 mg, yield 95%; mp: 216–218 °C. HPLC purity: 99.9%. 1H NMR (600 MHz, DMSO-d6) δ = 12.24 (br s, 1H), 9.73 (br s, 1H), 8.75 (br s, 1H), 8.23 (br s, 1H), 8.05 (br d, J = 7.7 Hz, 2H), 7.94 − 7.83 (m, 2H), 7.63 − 7.58 (m, 1H), 7.56 (br d, J = 8.3 Hz, 2H), 7.44 (br t, J = 8.0 Hz, 1H), 7.19 (br d, J = 7.3 Hz, 1H), 7.08 (s, 1H), 2.61 (s, 3H); 13C NMR (151 MHz, DMSO-d6) δ 163.7, 162.5, 158.5, 158.3, 156.5, 151.1, 144.0, 138.9, 129.8 (2 C), 129.2, 128.5, 126.2, 123.7, 123.6, 122.0, 119.3, 118.7, 118.3, 118.1, 116.7, 112.7 (2 C), 103.8, 23.6. HRMS-ESI (+) m/z calcd for C25H19F4N4O2 [M + H]+ 483.1439, found: 483.1432.
(E)-N'-(4-fluoro-3-(trifluoromethyl)benzylidene)-4-((8-hydroxy-2-methylquinolin-4-yl)amino)benzohydrazide (7Q)
Yellow solid; 108 mg, yield 90%; mp: 212–214 °C. HPLC purity: 99.9%. 1H NMR (600 MHz, DMSO-d6) δ = 12.15 (br s, 1H), 9.84 (br s, 1H), 8.56 (br s, 1H), 8.16 − 8.09 (m, 2H), 8.05 (br d, J = 7.5 Hz, 2H), 7.89 (br d, J = 7.7 Hz, 1H), 7.64 (br t, J = 9.4 Hz, 1H), 7.57 (br d, J = 8.1 Hz, 2H), 7.46 (br t, J = 7.9 Hz, 1H), 7.22 (br d, J = 7.0 Hz, 1H), 7.05 (s, 1H), 2.61 (s, 3H); 13C NMR (151 MHz, DMSO-d6) δ 163.1, 160.8, 158.5, 158.3, 156.3, 145.2, 134.1, 132.2, 129.8 (2 C), 126.4, 125.7, 125.7, 123.8, 122.4, 122.0, 119.1, 118.7, 118.5, 118.4, 116.7, 112.7 (2 C), 103.4, 23.1. HRMS-ESI (+) m/z calcd for C25H19F4N4O2 [M + H]+ 483.1439, found: 483.1433.
(E)-N'-((6-bromopyridin-2-yl)methylene)-4-((8-hydroxy-2-methylquinolin-4-yl)amino)benzohydrazide (7R)
Yellow solid; 113 mg, yield 95%; mp: 224–226 °C. HPLC purity: 99.9%. 1H NMR (600 MHz, DMSO-d6) δ = 12.23 (br s, 1H), 9.89 (s, 1H), 8.42 (br s, 1H), 8.13 − 8.02 (m, 2H), 8.01 − 7.96 (m, 1H), 7.91 (br d, J = 7.7 Hz, 1H), 7.86 (br t, J = 7.2 Hz, 1H), 7.69 (br d, J = 7.7 Hz, 1H), 7.58 (br d, J = 8.3 Hz, 2H), 7.47 (br t, J = 7.9 Hz, 1H), 7.24 (br d, J = 7.0 Hz, 1H), 7.04 (s, 1H), 2.62 (s, 3H); 13C NMR (151 MHz, DMSO-d6) δ 163.2, 158.5, 158.3, 156.2, 155.0, 146.2, 141.5, 140.6, 133.3, 129.9 (2 C), 128.9, 126.6, 122.6, 122.0, 119.9, 119.1, 118.7, 116.7, 112.7 (2 C), 103.3, 19.0. HRMS-ESI (+) m/z calcd for C23H19BrN5O2 [M + H]+ 476.0717, found: 476.0714, 478.0691.
(E)-4-((8-hydroxy-2-methylquinolin-4-yl)amino)-N'-(naphthalen-2-ylmethylene)benzohydrazide (7S)
Yellow solid; 107 mg, yield 96%; mp: 231–233 °C. HPLC purity: 99.9%. 1H NMR (600 MHz, DMSO-d6) δ = 12.04 (br s, 1H), 9.92 (br s, 1H), 8.66 (br s, 1H), 8.17 (br s, 1H), 8.08 (br d, J = 8.1 Hz, 2H), 8.02 (br d, J = 2.9 Hz, 1H), 8.02 − 7.98 (m, 2H), 7.96 (br dd, J = 3.1, 5.3 Hz, 1H), 7.92 (br d, J = 7.7 Hz, 1H), 7.59 (br d, J = 8.1 Hz, 2H), 7.58 − 7.55 (m, 2H), 7.48 (br t, J = 7.9 Hz, 1H), 7.24 (br d, J = 7.2 Hz, 1H), 7.04 (s, 1H), 2.62 (s, 3H); 13C NMR (151 MHz, DMSO-d6) δ 162.9, 158.5, 158.3, 156.2, 150.5, 148.0, 134.2, 133.4, 132.6, 129.8 (2 C), 129.2, 129.0, 128.8, 128.3, 127.6, 127.2 (2 C), 126.5, 123.2, 122.8, 119.0, 118.7, 116.8, 112.7 (2 C), 103.2, 22.6. HRMS-ESI (+) m/z calcd for C28H23N4O2 [M + H]+ 447.1816, found: 447.1810.
(E)-4-((8-hydroxy-2-methylquinolin-4-yl)amino)-N'-((4-methoxynaphthalen-1-yl)methylene)benzohydrazide (7T)
Yellow solid; 116 mg, yield 97%; mp: 214–216 °C. HPLC purity: 99.9%. 1H NMR (600 MHz, DMSO-d6) δ = 11.87 (br s, 1H), 9.92 (br s, 1H), 9.03 (br s, 1H), 9.02 (s, 1H), 8.27 (br d, J = 8.4 Hz, 1H), 8.09 (br d, J = 8.1 Hz, 2H), 7.92 (br d, J = 7.9 Hz, 1H), 7.87 (br d, J = 8.1 Hz, 1H), 7.71 (br t, J = 7.5 Hz, 1H), 7.67 − 7.60 (m, 2H), 7.59 (br d, J = 8.3 Hz, 2H), 7.48 (br t, J = 7.9 Hz, 1H), 7.24 (br d, J = 7.2 Hz, 1H), 7.12 (br d, J = 8.1 Hz, 1H), 7.03 (s, 1H), 4.05 (s, 3H), 2.62 (s, 3H); 13C NMR (151 MHz, DMSO-d6) δ 162.6, 158.5, 158.3, 157.1, 156.2, 148.7, 142.9, 131.6, 130.3, 129.6 (2 C), 128.3, 126.6, 126.5, 126.3, 125.5, 125.1, 122.9, 122.6, 122.5, 119.0, 118.8, 116.8, 112.7 (2 C), 104.9, 103.1, 56.4, 14.6. HRMS-ESI (+) m/z calcd for C29H25N4O3 [M + H]+ 477.1921, found: 477.1916.
(E)-N'-((2-chloroquinolin-3-yl)methylene)-4-((8-hydroxy-2-methylquinolin-4-yl)amino)benzohydrazide (7U)
Yellow solid; 104 mg, yield 86%; mp: 313–315 °C. HPLC purity: 98.9%. 1H NMR (600 MHz, DMSO-d6) δ = 12.37 (br s, 1H), 9.98 (br s, 1H), 8.99 (br s, 2H), 8.25 (br d, J = 7.5 Hz, 1H), 8.11 (br d, J = 8.1 Hz, 2H), 7.99 (d, J = 8.4 Hz, 1H), 7.93 (br d, J = 7.3 Hz, 1H), 7.88 (br t, J = 7.6 Hz, 1H), 7.71 (br t, J = 7.4 Hz, 1H), 7.60 (br d, J = 8.3 Hz, 2H), 7.48 (br t, J = 7.9 Hz, 1H), 7.26 (br d, J = 6.8 Hz, 1H), 7.05 (s, 1H), 2.63 (s, 3H); 13C NMR (151 MHz, DMSO-d6) δ 163.0, 158.5, 158.3, 156.1, 149.0, 147.6, 143.2, 143.1, 136.1, 132.3, 129.9 (2 C), 129.5, 128.4 (2 C), 128.1 (2 C), 127.4, 126.7, 122.9, 119.0, 118.7, 116.7, 112.8 (2 C), 103.3, 22.7. HRMS-ESI (+) m/z calcd for C27H21ClN5O2 [M + H]+ 482.1378, found: 482.1374.
(E)-N'-(benzo[b]thiophen-3-ylmethylene)-4-((8-hydroxy-2-methylquinolin-4-yl)amino)benzohydrazide (7V)
Yellow solid; 103 mg, yield 91%; mp: 209–211 °C. HPLC purity: 99.9%. 1H NMR (600 MHz, DMSO-d6) δ = 11.90 (br s, 1H), 9.59 (br s, 1H), 8.92 (br d, J = 7.9 Hz, 1H), 8.76 (s, 1H), 8.26 (s, 1H), 8.11 − 8.06 (m, 1H), 8.06 (br d, J = 8.6 Hz, 2H), 7.85 (br d, J = 8.1 Hz, 1H), 7.56 (br d, J = 8.4 Hz, 2H), 7.55 − 7.51 (m, 1H), 7.49 (br t, J = 7.3 Hz, 1H), 7.43 (br t, J = 7.9 Hz, 1H), 7.17 (d, J = 7.0 Hz, 1H), 7.08 (s, 1H), 2.60 (s, 3H); 13C NMR (151 MHz, DMSO-d6) δ 162.9, 158.4, 158.2, 156.6, 144.1, 143.8, 140.6, 136.1, 133.3 (2 C), 131.6, 129.7 (2 C), 126.0, 125.9, 125.8, 125.6, 123.4, 121.8, 119.3, 118.8, 116.8, 112.6 (2 C), 103.8, 23.9. HRMS-ESI (+) m/z calcd for C26H21N4O2S [M + H]+ 453.1379, found: 453.1375.
In silico study
Induced fit docking and binding pose metadynamics simulation
The cocrystal structures of Nur77’s ligand-binding sites were retrieved from the Protein Data Bank (https://www.rcsb.org/) under the following PDB codes: Site A & Site B (3V3Q)Citation34, Site C (4WHG)Citation35, and Site D (6KZ5)Citation9. Due to the obtained crystal complexes containing crystalline solvent and water molecules, missing hydrogen atoms, and residues or loops, the structures required preparation prior to analysis. Protein preparation tasks were carried out automatically using the Protein Preparation WizardCitation36 of Schrödinger (Release 2021–2) with default settings. This process involved bond order assignment, the addition of hydrogen atoms, the removal of water and solute molecules, the use of PrimeCitation37,Citation38 for filling in missing side chains and loops, generation of heat states using Epik at pH 7.0 ± 2.0, optimisation of hydrogen bonds, and minimisation of the protein structure using the OPLS4 force fieldCitation39. The small molecules for molecular docking were prepared in 3D using the default parameters of the LigPrep module (LigPrep, Schrödinger, LLC, New York, NY, 2021). This ligand preparation process included the addition of hydrogen atoms, neutralisation of charged groups, generation of ionisation and tautomeric states with Epik, and optimisation of the geometries. To accurately predict the binding modes of the synthesised compounds with Nur77, the induced fit docking method was employed. Schrödinger’s Induced Fit Docking tool (Induced Fit Docking, Schrödinger, LLC, New York, NY, 2021) was used to dock the thirty-seven acylhydrazone derivatives to the active sites of Nur77 using the standard protocol. The docking box was centre on the position of Nur77’s native ligands, and other parameters were set to default values. The plausibility of the docking results was assessed by calculating the cavity volume of each compound after binding to Nur77 using the python script trajectory_binding_site_volumes.py provided by Schrödinger. BPMDCitation22,Citation23, an enhanced sampling MD simulation method, was used to evaluate the stability of ligands bound to proteins in aqueous solution. Schrödinger’s Binding Pose Metadynamics module was used for the BPMD simulations. The receptor-ligand complexes obtained from the docking study served as the input structures for the simulations, with each pose subjected to 10 trials. Maestro (Maestro, Schrödinger, LLC, New York, NY, USA 2021) was utilised for ligand and protein preparation, molecular docking, binding site calculation and visualisation, as well as MD simulations and profiling. The binding patterns between the ligands and proteins were analysed and visualised using UCSF ChimeraXCitation40.
Molecular dynamics simulation
The MD simulations of Nur77/ligand complexes were performed using the Desmond application (Desmond, Schrödinger, LLC, New York, NY, 2021)Citation41,Citation42 with periodic boundary conditions. The simulated systems were built using the System builder tool Desmond and were solvated in a cubic simulation box with a predefined TIP3P water model at a distance of 10 Å from the Nur77/ligand complexes. Counterions and 0.15 M KCl were added to neutralise the system. The energy minimisation was performed for 100 ps using the Minimisation panel of Desmond, and the minimised systems were equilibrated using a standard protocol consisting of a series of MD simulations before the final production. The MD production of the equilibrated systems was performed using NPT ensemble (constant number of atoms, constant temperature, constant pressure) at a temperature of 310 K and a pressure of 1.01325 bar. The OPLS4 force field was used in all simulations with a time step of 2.0 fs. Nose-Hoover chain thermostat and Martyna-Tobias-Klein barostate were used to maintain the temperature and pressure, respectively. The cut-off radius for Coulomb interactions was set to 9 Å, and the solute was not constrained. The MD simulation trajectories were recorded at every 100 ps intervals, resulting in a total of 1000 or 5000 frames for post-MD analysis. All simulated systems underwent three independent runs with different random seeds ().
Post-MD analysis
The Simulation Interactions Diagram of Desmond was employed for trajectory analysis, including protein-ligand root mean square deviation (RMSD), protein room mean square fluctuation (RMSF), ligand-protein contacts, and protein-ligand contacts profiling. Schrödinger’s binding_sasa.py script was used to calculate the ligand-binding SASA from the MD trajectories to evaluate ligand binding to the protein. The number of hydrogen bonds in each frame of the trajectory was recorded using the trajectory_analyse_hbonds.py script. The output trajectories from the Desmond simulations were converted to .pdb (top file) and .xtc (trajectory file) formats and used to calculate the free energy landscape using VMDCitation43. The “gmx gyrate” and “gmx rms” modules in GROMACSCitation44,Citation45 (v. 2022.1) were used to calculate the radius of gyration and the RMSD of the protein backbone atoms, and the FEL was produced using the “gmx sham” module based on the probability distribution of Rg and RMSD. The result of FEL was visualised using DuIvyToolsCitation46. Finally, the Schrödinger’s thermal_mmgbsa.py script was used to calculate the binding free energy of TMHA37 with Nur77.
Biological evaluation
Cell culture
The human hepatocellular carcinoma cell lines HepG2, SMMC-7721, and HuH7, along with the human non-small cell lung cancer cell lines A549 (WT) and A549 (Nur77–/–), were maintained in Dulbecco’s Modified Eagle Medium (DMEM) containing 10% foetal bovine serum (FBS). The human normal liver cell line LO2 was cultured in RPMI-1640 medium supplemented with 10% FBS. The HepG2, SMMC-7721, and HuH7 cell lines were obtained from the ATCC, while the LO2 cell line was obtained from the Chinese Academy of Science Shanghai Cell Bank. All cell lines were cultured at 37 °C in a humidified 5% CO2 atmosphere.
Plasmid and transfection
The CRISPR/Cas9 system was employed for knocking down Nur77, with plasmids constructed as previously describedCitation25. Cells were transfected with the plasmids using lipofectamine 8000 (Beyotime, China), following the manufacturer’s instructions.
Antibodies
The antibodies used in this study were anti-β-actin (#66009–1-Ig, Proteintech), anti-LC3 (#14600–1-AP, Proteintech), anti-Cleaved PARP (#A19612, Abclonal), anti-α-tubulin (#2125, Cell Signalling Technology), anti-Lamin B1 (#A11495, Abclonal), anti-Nur77 (#3960, Cell Signalling Technology), and anti-PARP (#SC-8007, Santa Cruz Biotechnology).
MTT assay
The MTT assay was employed to assess the cytotoxicity of all compounds. Cells were seeded in 96-well plates at a density of 3000–5000 cells per well and treated with various concentrations of the compound for 48 h. Subsequently, the cells were incubated with 0.5 mg/mL MTT (3–(4,5-dimethylthiazol-2-yl)-2,5-diphenyltetrazolium bromide) for 3–4 h. The supernatant was then removed, and 100 μL of dimethyl sulfoxide (DMSO) was added to each well to dissolve formazan in the cells. The absorbance was detected at 492 nm, and the inhibition rate of cell proliferation induced by the compound was calculated:
IC50 was calculated for each compound using GraphPad Prism 8.0 software.
Colony formation assay
The cells were seeded in 6-well plates at a density of 1000–2000 cells per well and cultured at 37 °C for 48 h. Later, the supernatant solution was replaced with a medium containing TMHA37, and the cells were continuously cultured for 7 days. Subsequently, the colonies were fixed with methanol for 30 min at room temperature, stained with a 0.1% crystal violet solution for 15 min, and washed with ddH2O. Finally, the colonies were photographed.
Western blotting
A RIPA buffer that included both protease and phosphatase inhibitors was used to prepare the cell lysate. The cells were then lysed for 30 min on ice, followed by centrifugation (12,000 g, 4 °C, 15 min) to collect the supernatant. The protein samples were quantified using the BCA method (#20201ES86, Yeasen, China), and then the cell lysates were boiled in SDS sample loading buffer for 10 min. The lysates were electrophoresed by SDS-PAGE gel and transferred onto a polyvinylidene difluoride (PVDF) membrane. Next, the PVDF membranes were blocked with 5% skimmed milk in TBST (10 mM Tris-HCl [pH 8.0], 150 mM NaCl, 0.1% Tween 20) for 1 h at room temperature. Subsequently, the membranes were incubated with primary antibodies (1:1000 dilution) in 3% BSA in TBST overnight at 4 °C, followed by washing with TBST three times. Then, the membranes were probed with the corresponding secondary antibody (1: 5000 dilution, Abclonal, China) for 1 h at room temperature and washed three times again. Finally, the ECL system (Abclonal, China) and Chemiluminescence imaging system (Bio-Rad, USA) were used to detect all the membranes.
Real-time polymerase chain reaction
Total RNA was extracted and purified from cultured cells using Trizol (Magen, China) following the manufacturer’s instructions. Subsequently, cDNA was generated through reverse transcription of 500 ng of total RNA using the Hifair® II 1st Strand cDNA Synthesis SuperMix (#11123ES10, Yeasen, China). Real-time polymerase chain reaction (PCR) analysis was performed using the Hieff® qPCR SYBR Green Master Mix (#11202ES08, Yeasen, China). Each sample was run in triplicate, and the relative RNA amounts were calculated using the DDCt method with the ABI Stepone PCR instrument, and normalised to the internal control, β-actin. The primers used were as follows: β-actin forward: TGGCACCACACCTTCTACAA, reverse: CCAGAGGCGTACAGGGATAG; NR4A1 forward: TTTCCTTCAGTCCTCCCACC, reverse: TTGAGGTCACGGGTGTATCC.
Dual-luciferase reporter assay
After co-transfecting cells with pBind-Nur77-LBD and pG5-Luc reporter plasmid for 24 h, the cells were treated with TMHA37 for another 24 h. Next, the cells were lysed and luciferase relative activity was measured using the Dual-Luciferase Reporter Assay System (Promega, USA) in accordance with the manufacturer’s instructions. Transfection efficiency was normalised to Renilla luciferase activity.
Nuclear and cytoplasmic protein extraction
After a 3-h treatment with TMHA37, the cells were harvested and lysed in buffer A (10 mM HEPES, 1.5 mM MgCl2, 10 mM KCl, 0.2 mM EDTA, 0.1 mM EGTA) for 30 min on ice. NP-40 solution was then added to the lysate to achieve a final concentration of 1%, followed by vortexing for 10 s. The lysate was subsequently centrifuged (12,000 g, 4 °C, 30 s), and the resulting supernatant was collected as cytoplasmic protein. The precipitate was washed twice with PBS and then treated with RIPA buffer while being placed on ice for 30 min. After centrifugation (12,000 g, 4 °C, 15 min), the supernatant was obtained, containing the nuclear protein. The BCA kit was used to quantify the protein concentration.
Cell cycle analysis by flow cytometry
Cells were exposed to TMHA37 for 10 h, and then harvested and washed with PBS and fixed with ice-precooled 70% ethanol at 4 °C overnight. The fixed cells were washed again with PBS, stained with a cell cycle analysis kit (#40301ES60, Yeasen, China) or 1 μg/mL DAPI in PBS for 30 min, and finally detected by an Attune NxT flow cytometer (ThermoFisher, USA).
Annexin V-FITC/PI apoptosis detection assay
The cells were seeded onto a 6-well plate and cultured overnight. After this, the cells were treated with varying concentrations of TMHA37 for 24 h. The cells were collected and stained with Annexin V-FITC staining solution and PI staining solution (#40302ES60, Yeasen, China) at room temperature in the dark for 15 min, then analysed by flow cytometry system (Attune NxT, Thermo, USA).
Immunofluorescent staining and confocal microscopy
Cells were plated in a 12-well plate with sterile glass slides. After treating with TMHA37 for 6 h and staining with or without Mito-tracker (Beyotime, China), 4% paraformaldehyde was added to fix the cells at room temperature for 20 min. Then, 0.1% triton X-100 and 0.1 M Glycine in PBS were used to permeabilize the cells for 8 min on ice. After washing with PBS, the cells were blocked with 5% BSA at room temperature for 1 h, followed by three washes with PBS. The cells were then incubated with Nur77 antibody (1:100 dilution) overnight at 4 °C. Finally, the cells were probed by corresponding fluorescent secondary antibody (1:100) for 2 h, and then stained with 5 mg/ml DAPI (1: 10000) to stain nuclei. The images were captured and analysed by a Zeiss LSM5 confocal laser scanning microscope system (Zeiss, Germany).
Spr
The BIAcore T200 instrument (GE Healthcare) was used to determine the binding kinetics between TMHA37 and Nur77-LBD at 25 °C. The experimental protocol was approved by Analysis and Measurement Centre, School of Pharmaceutical Sciences, Xiamen University. Nur77-LBD were diluted to 5 mg/mL in 10 mM NaOAc (pH 5.0) and immobilised on a CM5 sensor chip (GE Healthcare) via amine coupling at densities of approximately 7000 RU. Gradient concentrations of TMHA37 were injected into the flow cells at a flow rate of 30 ml/min for 150 s of association phase followed by a 420 s dissociation phase and a 30 s regeneration phase (10 mM Glycin-HCl, pH 2.5) in running buffer (PBS, 0.5% DMSO). The data were analysed using BIAcore T200 Evaluation Software 2.0 and referenced for blank injections and reference surface. The KD was fitted to the standard 1:1 interaction model and calculated using global fitting of the kinetic data from gradient concentrations.
In vivo PK study
The pharmacokinetic study protocol was approved by the Animal Care and Use Committee of Xiamen University. The study was conducted using SD rats aged between 10–14 weeks (200–220 g) to analyse the PK properties of TMHA37. The compound was formulated in 10% DMSO, 2% T-80, and 88% H2O and was administered i.v. at 2 mg/kg or p.o. at 20 mg/kg. For the study, the rats were randomly assigned into three females per group, and blood samples were collected by tubes containing Na heparin (10 mg/mL, 30 μL) at 0.083, 0.25, 0.5, 1, 2, 4, 8, and 24 h after intravenous administration, and at 0.5 h, 1 h, 1.5 h, 2 h, 4 h, 8 h, 10 h, 12 h, and 24 h after oral administration. The bloods were centrifuged at 4000 r/min for 10 min at 4 °C to separate the plasma (100 μL). Plasma samples were assayed for their levels of TMHA37 by LC/MS/MS using an ABI 3200 QTRAP Triple Quad system operating in a positive electrospray mode. Bioavailability was determined by comparing the plasma exposure levels (AUC0-∞) of TMHA37 when given orally with plasma exposure levels obtained via the i.v. route. Mathematically, this is expressed as F (%) = 100% × [(AUC0–∞, po × Div)/(AUC0–∞, iv × Dpo)], where F represents the bioavailability, AUC0–∞, po is the area under the curve following TMHA37 oral administration in h*μg/L, AUC0–∞, iv is the area under the curve following TMHA37 i.v. administration in h*μg/L, Div is the dose given i.v. in mg/kg and Dpo is the dose given orally in mg/kg.
Supplemental Material
Download Zip (6.7 MB)Disclosure statement
No potential conflict of interest was reported by the author(s).
Additional information
Funding
References
- Sung H, Ferlay J, Siegel RL, Laversanne M, Soerjomataram I, Jemal A, Bray F. Global Cancer Statistics 2020: GLOBOCAN estimates of incidence and mortality worldwide for 36 Cancers in 185 Countries. CA Cancer J Clin. 2021;71(3):209–249. doi:10.3322/caac.21660
- Llovet JM, Kelley RK, Villanueva A, Singal AG, Pikarsky E, Roayaie S, Lencioni R, Koike K, Zucman-Rossi J, Finn RS, et al. Hepatocellular carcinoma. Nat Rev Dis Primers. 2021;7(1):6. doi:10.1038/s41572-020-00240-3
- Villanueva A. Hepatocellular Carcinoma. N Engl J Med. 2019;380(15):1450–1462. doi:10.1056/NEJMra1713263
- Wang W-J, Wang Y, Chen H-Z, Xing Y-Z, Li F-W, Zhang Q, Zhou B, Zhang H-K, Zhang J, Bian X-L, et al. Orphan nuclear receptor TR3 acts in autophagic cell death via mitochondrial signaling pathway. Nat Chem Biol. 2014;10(2):133–140. doi:10.1038/nchembio.1406
- Li X-X, Wang Z-J, Zheng Y, Guan Y-F, Yang P-B, Chen X, Peng C, He J-P, Ai Y-L, Wu S-F, et al. Nuclear receptor Nur77 facilitates melanoma cell survival under metabolic stress by protecting fatty acid oxidation. Mol Cell. 2018;69(3):480–492.e487. doi:10.1016/j.molcel.2018.01.001
- Chen H-Z, Li L, Wang W-J, Du X-D, Wen Q, He J-P, Zhao B-X, Li G-D, Zhou W, Xia Y, et al. Prolyl isomerase Pin1 stabilizes and activates orphan nuclear receptor TR3 to promote mitogenesis. Oncogene. 2012;31(23):2876–2887. doi:10.1038/onc.2011.463
- Lin H, Lin Q, Liu M, Lin Y, Wang X, Chen H, Xia Z, Lu B, Ding F, Wu Q, et al. PKA/Smurf1 signaling-mediated stabilization of Nur77 is required for anticancer drug cisplatin-induced apoptosis. Oncogene. 2014;33(13):1629–1639. doi:10.1038/onc.2013.116
- Dodat F, Mader S, Lévesque D. Minireview: what is known about SUMOylation among NR4A Family Members? J Mol Biol. 2021;433(21):167212. doi:10.1016/j.jmb.2021.167212
- Yang P-B, Hou P-P, Liu F-Y, Hong W-B, Chen H-Z, Sun X-Y, Li P, Zhang Y, Ju C-Y, Luo L-J, et al. Blocking PPARγ interaction facilitates Nur77 interdiction of fatty acid uptake and suppresses breast cancer progression. Proc Natl Acad Sci USA. 2020;117(44):27412–27422. doi:10.1073/pnas.2002997117
- Chen H-Z, Liu Q-F, Li L, Wang W-J, Yao L-M, Yang M, Liu B, Chen W, Zhan Y-Y, Zhang M-Q, et al. The orphan receptor TR3 suppresses intestinal tumorigenesis in mice by downregulating Wnt signalling. Gut. 2012;61(5):714–724. doi:10.1136/gutjnl-2011-300783
- Bian X-L, Chen H-Z, Yang P-B, Li Y-P, Zhang F-N, Zhang J-Y, Wang W-J, Zhao W-X, Zhang S, Chen Q-T, et al. Nur77 suppresses hepatocellular carcinoma via switching glucose metabolism toward gluconeogenesis through attenuating phosphoenolpyruvate carboxykinase sumoylation. Nat Commun. 2017;8:14420. doi:10.1038/ncomms14420
- Niu B, Liu J, Lv B, Lin J, Li X, Wu C, Jiang X, Zeng Z, Zhang X-K, Zhou H, et al. Interplay between transforming growth factor-β and Nur77 in dual regulations of inhibitor of differentiation 1 for colonic tumorigenesis. Nat Commun. 2021;12(1):2809. doi:10.1038/s41467-021-23048-5
- Karki K, Mohankumar K, Schoeller A, Martin G, Shrestha R, Safe S. NR4A1 ligands as potent inhibitors of breast cancer cell and tumor growth. Cancers . 2021;13(11):2682. doi:10.3390/cancers13112682
- Shrestha R, Mohankumar K, Martin G, Hailemariam A, Lee S-O, Jin U-H, Burghardt R, Safe S. Flavonoids kaempferol and quercetin are nuclear receptor 4A1 (NR4A1, Nur77) ligands and inhibit rhabdomyosarcoma cell and tumor growth. J Exp Clin Cancer Res. 2021;40(1):392. doi:10.1186/s13046-021-02199-9
- Zhang W, Wu Z, Qi H, Chen L, Wang T, Mao X, Shi H, Chen H, Zhong M, Shi X, et al. Celastrol upregulated ATG7 triggers autophagy via targeting Nur77 in colorectal cancer. Phytomedicine. 2022;104:154280. doi:10.1016/j.phymed.2022.154280
- Yang H, Nie Y, Li Y, Wan YJ. ERK1/2 deactivation enhances cytoplasmic Nur77 expression level and improves the apoptotic effect of fenretinide in human liver cancer cells. Biochem Pharmacol. 2011;81(7):910–916. doi:10.1016/j.bcp.2011.01.005
- Chen Q-T, Zhang Z-Y, Huang Q-L, Chen H-Z, Hong W-B, Lin T, Zhao W-X, Wang X-M, Ju C-Y, Wu L-Z, et al. HK1 from hepatic stellate cell-derived extracellular vesicles promotes progression of hepatocellular carcinoma. Nat Metab. 2022;4(10):1306–1321. doi:10.1038/s42255-022-00642-5
- Li B, Yao J, Guo K, He F, Chen K, Lin Z, Liu S, Huang J, Wu Q, Fang M, et al. Design, synthesis, and biological evaluation of 5-((8-methoxy-2-methylquinolin-4-yl)amino)-1H-indole-2-carbohydrazide derivatives as novel Nur77 modulators. Eur J Med Chem. 2020;204:112608. doi:10.1016/j.ejmech.2020.112608
- Li B, Huang J, Liu J, He F, Wen F, Yang C, Wang W, Wu T, Zhao T, Yao J, et al. Discovery of a Nur77-mediated cytoplasmic vacuolation and paraptosis inducer (4-PQBH) for the treatment of hepatocellular carcinoma. Bioorg Chem. 2022;121:105651. doi:10.1016/j.bioorg.2022.105651
- Halgren T. New method for fast and accurate binding-site identification and analysis. Chem Biol Drug Des. 2007;69(2):146–148. doi:10.1111/j.1747-0285.2007.00483.x
- Halgren TA. Identifying and characterizing binding sites and assessing druggability. J Chem Inf Model. 2009;49(2):377–389. doi:10.1021/ci800324m
- Fusani L, Palmer DS, Somers DO, Wall ID. Exploring ligand stability in protein crystal structures using binding pose metadynamics. J Chem Inf Model. 2020;60(3):1528–1539. doi:10.1021/acs.jcim.9b00843
- Clark AJ, Tiwary P, Borrelli K, Feng S, Miller EB, Abel R, Friesner RA, Berne BJ. Prediction of protein-ligand binding poses via a combination of induced fit docking and metadynamics simulations. J Chem Theory Comput. 2016;12(6):2990–2998. doi:10.1021/acs.jctc.6b00201
- Auerbach SD, Johnson KA. Alternating site ATPase pathway of rat conventional kinesin. J Biol Chem. 2005;280(44):37048–37060. doi:10.1074/jbc.M502984200
- Chen X, Cao X, Tu X, Alitongbieke G, Xia Z, Li X, Chen Z, Yin M, Xu D, Guo S, et al. BI1071, a Novel Nur77 modulator, induces apoptosis of cancer cells by activating the Nur77-Bcl-2 apoptotic pathway. Mol Cancer Ther. 2019;18(5):886–899. doi:10.1158/1535-7163.MCT-18-0918
- Hu M, Luo Q, Alitongbieke G, Chong S, Xu C, Xie L, Chen X, Zhang D, Zhou Y, Wang Z, et al. Celastrol-induced Nur77 interaction with TRAF2 alleviates inflammation by promoting mitochondrial ubiquitination and autophagy. Mol Cell. 2017;66(1):141–153 e146. doi:10.1016/j.molcel.2017.03.008
- Pawlak A, Strzadala L, Kalas W. Non-genomic effects of the NR4A1/Nur77/TR3/NGFIB orphan nuclear receptor. Steroids. 2015;95:1–6. doi:10.1016/j.steroids.2014.12.020
- Hazel TG, Misra R, Davis IJ, Greenberg ME, Lau LF. Nur77 is differentially modified in Pc12 cells upon membrane depolarization and growth-factor treatment. Mol Cell Biol . 1991;11(6):3239–3246.
- Kolluri SK, Bruey-Sedano N, Cao X, Lin B, Lin F, Han Y-H, Dawson MI, Zhang X-k. Mitogenic effect of orphan receptor TR3 and its regulation by MEKK1 in lung cancer cells. Mol Cell Biol. 2003;23(23):8651–8667. doi:10.1128/MCB.23.23.8651-8667.2003
- Hanna RN, Carlin LM, Hubbeling HG, Nackiewicz D, Green AM, Punt JA, Geissmann F, Hedrick CC. The transcription factor NR4A1 (Nur77) controls bone marrow differentiation and the survival of Ly6C-monocytes. Nat Immunol. 2011;12(8):778–785. doi:10.1038/ni.2063
- Lin B, Kolluri SK, Lin F, Liu W, Han Y-H, Cao X, Dawson MI, Reed JC, Zhang X-k. Conversion of Bcl-2 from protector to killer by interaction with nuclear orphan receptor Nur77/TR3. Cell. 2004;116(4):527–540. doi:10.1016/s0092-8674(04)00162-x
- Hedrick E, Mohankumar K, Safe S. TGFbeta-induced lung cancer cell migration is NR4A1-dependent. Mol Cancer Res. 2018;16(12):1991–2002. doi:10.1158/1541-7786.MCR-18-0366
- Li B, Zhu F, He F, Huang Q, Liu X, Wu T, Zhao T, Qiu Y, Wu Z, Xue Y, et al. Synthesis and biological evaluations of N′-substituted methylene-4-(quinoline-4-amino) benzoylhydrazides as potential anti-hepatoma agents. Bioorg Chem. 2020;96:103592. doi:10.1016/j.bioorg.2020.103592
- Zhan Y-y, Chen Y, Zhang Q, Zhuang J-j, Tian M, Chen H-z, Zhang L-r, Zhang H-k, He J-p, Wang W-j, et al. The orphan nuclear receptor Nur77 regulates LKB1 localization and activates AMPK. Nat Chem Biol. 2012;8(11):897–904. doi:10.1038/nchembio.1069
- Wang W-j, Wang Y, Hou P-p, Li F-w, Zhou B, Chen H-z, Bian X-l, Cai Q-x, Xing Y-z, He J-p, et al. Induction of autophagic death in cancer cells by agonizing TR3 and attenuating Akt2 activity. Chem Biol. 2015;22(8):1040–1051. doi:10.1016/j.chembiol.2015.06.023
- Sastry GM, Adzhigirey M, Day T, Annabhimoju R, Sherman W. Protein and ligand preparation: parameters, protocols, and influence on virtual screening enrichments. J Comput Aided Mol Des. 2013;27(3):221–234. doi:10.1007/s10822-013-9644-8
- Jacobson MP, Friesner RA, Xiang Z, Honig B. On the role of the crystal environment in determining protein side-chain conformations. J Mol Biol. 2002;320(3):597–608. doi:10.1016/s0022-2836(02)00470-9
- Jacobson MP, Pincus DL, Rapp CS, Day TJF, Honig B, Shaw DE, Friesner RA. A hierarchical approach to all-atom protein loop prediction. Proteins. 2004;55(2):351–367. doi:10.1002/prot.10613
- Lu C, Wu C, Ghoreishi D, Chen W, Wang L, Damm W, Ross GA, Dahlgren MK, Russell E, Von Bargen CD, et al. OPLS4: improving force field accuracy on challenging regimes of chemical space. J Chem Theory Comput. 2021;17(7):4291–4300. doi:10.1021/acs.jctc.1c00302
- Pettersen EF, Goddard TD, Huang CC, Meng EC, Couch GS, Croll TI, Morris JH, Ferrin TE. UCSF ChimeraX: structure visualization for researchers, educators, and developers. Protein Sci. 2021;30(1):70–82. doi:10.1002/pro.3943
- Desmond. Desmond Molecular Dynamics System, D. E. Shaw Research, New York, NY, 2021. New York, NY: Maestro-Desmond Interoperability Tools, Schrödinger; 2021.
- Bowers KJ, Chow DE, Xu H, Dror RO, Eastwood MP, Gregersen BA, et al. Scalable algorithms for molecular dynamics simulations on commodity clusters. SC '06: Proceedings of the 2006 ACM/IEEE Conference on Supercomputing; 2006, p. 43–43.
- Humphrey W, Dalke A, Schulten K. VMD: Visual molecular dynamics. J Mol Graph. 1996;14(1):33–38. doi:10.1016/0263-7855(96)00018-5
- Abraham MJ, Murtola T, Schulz R, Páll S, Smith JC, Hess B, Lindahl E. GROMACS: high performance molecular simulations through multi-level parallelism from laptops to supercomputers. SoftwareX. 2015;1-2:19–25. doi:10.1016/j.softx.2015.06.001
- Van Der Spoel D, Lindahl E, Hess B, Groenhof G, Mark AE, Berendsen HJC. GROMACS: fast, flexible, and free. J Comput Chem. 2005;26(16):1701–1718. doi:10.1002/jcc.20291
- DuIvyTools: a tool to process the result files of GMX MD. [accessed 2022 July 17]. https://github.com/CharlesHahn/DuIvyTools.