
Abstract
Carbonic anhydrase 12 is considered an oncogenic and acidic microenvironmental factor in cancer cells. To verify the role of histamine signalling as an anti-cancer signal, we determined the roles of CA12 and its associated bicarbonate transporters. In this study, histamine stimulation mediated mislocalization of CA12 in lung cancer cells. Histamine receptor activation-mediated CA12 endocytosis and pH were restored by CaMKII inhibition. CA12-associated AE2 expression was enhanced, whereas NBCn1 expression and its activity were reduced by histamine stimulation. Histamine receptor activation-mediated acidification was induced by internalised CA12 and NBCn1 and, at the same time by increased bicarbonate efflux through enhanced AE2 expression. Inhibition of protein trafficking by bafilomycin restored CA12 and AE2 localisation and diminished cellular acidosis. Thus, we verified that histamine stimulation induced an acidic scenario, which revealed trafficking of CA12 and its associated bicarbonate transporters in lung cancer cells and its dysregulated pH modulation may be involved in the histamine signalling-mediated anti-cancer process.
Introduction
Histamine and its mediated signalling is involved in various cancerous processes such as proliferation and differentiation of malignant cancer cellsCitation1,Citation2, and its biphasic role in lung cancer progression remains an issue of debateCitation3. It has been reported that histamine signalling is involved in the lung cancer development, whereas reduced serum histamine levels have been observed in patients with lung cancerCitation4. In addition, a lung carcinoma model has revealed an anti-cancer effect of histamine signalling in vivoCitation3. Activation of histamine receptor type 4 has been reported to induce anti-cancer effects in T-cell lymphomaCitation5. More recently, our research demonstrated that global histamine stimulation possesses inhibitory effect on lung cancer cell migrationCitation6.
Carbonic anhydrases (CAs) are pH-associated metalloenzymes that catalyse the reversible reaction between carbon dioxide (+ H2O) and bicarbonate (+ H+), and 15 types of CA have been discovered in humans to dateCitation7. Among them, CA12 is considered to be a tumor-associated enzyme, and its expression is linked with malignant featuresCitation7–10. CA12 promotes invasion and migration of breast cancer cells through the p38 MAPK signalling pathwayCitation8. In addition, inhibition of CA12 reduces breast cancer cell migration through the hedgehog pathwayCitation11. The putative anti-cancer drug Disulphiram inhibits lung and breast cancer cell migration through reduced expression of CA12 and anion exchanger 2 (AE2)Citation12.
In addition, CA12, which is involved in pH regulation and modulation of bicarbonate balance, is closely associated with bicarbonate transporters, such as the sodium-bicarbonate cotransporter and AE2, which are solute carrier 4 family membersCitation12–14. CAs generate bicarbonate and proton through the catalytic conversion of carbon dioxide and water. CA12, which is localised to the plasma membrane, binds to membrane-associated bicarbonate transporters and is involved in the regulation of their activities for supplying the ultimate bicarbonate sourceCitation14. The various bicarbonate transporters are also involved in cell migration or progression of pancreatic, lung, breast, and colon cancersCitation15–19. Thus, CA12 and its associated bicarbonate transporters in the plasma membrane have crucial roles in cancer cells.
Thus, we speculated that activation of histamine signalling as anti-cancer effect may be involved in modulation of oncogenic factor CA12 and its associated bicarbonate transporters in lung cancer cells. In this study, we addressed that histamine receptor stimulation attenuates membrane expression of CA12 and cellular acidification is mediated by CA12 trafficking. Understanding of histamine receptor activation-mediated CA12 trafficking and the associated bicarbonate transporters will provide information about cellular pH regulation in cancer cells.
Materials and methods
Cell culture
The normal human bronchial epithelial cell line Beas-2B, the lung adenocarcinoma cell line A549, H1299, and the human embryonic kidney (HEK) 293 T cell line were obtained from the American Type Culture Collection (Rockville, MD, USA). The Beas-2B, A549, H1299, and HEK293T cells were cultured in Dulbecco’s modified Eagle’s medium (#11995–065, DMEM, Invitrogen, Waltham, MA, USA) containing 10% foetal bovine serum (#16000–044, FBS; Invitrogen), and 100 U/mL penicillin–streptomycin (#15140–122, Invitrogen). All cells were incubated at 37 °C in 5% CO2 and 95% air. To conduct other experiments, the cells were washed with Dulbecco’s phosphate-buffered saline (#LB001-02, DPBS, Welgene, South Korea) and treated with trypsin/ethylenediaminetetraacetic acid (#25200–720, Trypsin-EDTA, Invitrogen) for transfer to new culture dishes.
Measurement of Na+- HCO3- cotransporter (NBC) activity
To measure the intracellular pH (pHi) measurement-based Na+- HCO3- cotransporter (NBC) activity, 20 µM 2′-7′-bis-(carboxyethyl)-5-(and-6)-carboxyfluorescein (#B1170, BCECF-AM; Invitrogen, Waltham, MA, USA) at dual excitation wavelengths of 440 and 495 nm and a single emission wavelength of 530 nm was used. After treatment of 100 μM histamine for 24 h in Beas-2B and A549, and cultured cells were loaded into the chamber with 20 µM BCECF-AM in the presence of 0.1% Pluronic F-127 (#P3000MP, Invitrogen) for 15 min at room temperature in the dark. The dye-loaded cells were perfused with a physiological salt solution (the composition was previously described inCitation20, which we called regular solution) for at least 4 min to stabilise the fluorescence before measuring the pHi at 37 °C. To measure pHi-based NBC activity, cells were perfused with a regular solution, HCO3- solution, and Na+-free HCO3− solution with 10 µM 5-(N-Ethyl-N-isopropyl) amiloride (EIPA) (#A3085, Sigma, Saint-Louis, MO, USA) for inhibition of the Na+- H+ exchanger (NHE) in cells. The cells were incubated with CO2-saturated HCO3- solution for acidification of the cytosol and then perfused with Na+-free HCO3− solution. All incubated solutions were maintained at 37 °C. NBC activity was calculated from the slope of the increase in pHi during the first 30–45 s in Na+-free HCO3− solution and expressed as the percentage fold-change relative to the NBC activity of the control. Fluorescence images were obtained with a RetigaTM 6000 CCD camera (Teledyne Q-Imaging, Surrey, BC, Canada) recruited to an inverted microscope (Olympus, Tokyo, Japan) and analysed with a Meta Fluor system (Molecular Devices, San Jose, CA, USA). All fluorescence images were obtained at 1-s intervals, and background fluorescence was subtracted from raw background signals at each wavelength.
Measurement of intracellular pH through pHRodoTM
Beas-2B, A549, and HEK293T cells were cultured on cover glasses and treated with 100 μM histamine (#H7125, Sigma), 10 μM KN62 (#13318, Cayman, Ann Arbour, MI, USA), and 2 μM bafilomycin (#11038, Cayman) for 24 h. The incubated media were removed and the cells washed with heated a regular solution at 37 °C. pHRodoTM Green-AM as an intracellular pH indicator (#p35373, Invitrogen) was treated to the cells and incubated at 37 °C for 30 min. After removal of the supernatants, fixation was performed with 4% paraformaldehyde at room temperature for 10 min in the dark. The cells were washed with DPBS and the cover glasses were carefully attached and mounted on slide glass with Fluoromount-GTM (Electron Microscopy Sciences) containing 4′,6-diamidino-2-phenylindole (DAPI). To acquire fluorescence images, Zeiss LSM700 confocal microscope (Fluoview, Carl Zeiss, Germany) was used and analysed with ZEN software.
Protein biotinylation and Western blot
Cells were cultured in 6-well dish. The 100 μM histamine treatment for 24 and 48 h and 10 μM KN62, and 2 μM bafilomycin treatment for 24 h were performed in Beas-2B and A549. To detect the expression of membrane-associated proteins, cells were treated with 1 mg/mL EZ-LINK sulfo-NHS-LC biotin (#21335, Thermo Fisher, Waltham, MA, USA) for 30 min on ice, followed by treatment with 100 mM glycine solution for 10 min on ice. The cells were washed with DPBS for three times and lysis buffer (containing 20 mM Tris, 150 mM NaCl, 2 mM EDTA, 1% Triton X-100, and protease inhibitor mixture, Cell signalling, Danvers, MA, USA) was treated to cells and the cell membranes were broken by sonication. The cell extracts were centrifuged at 11,000 × g for 15 min at 4 °C, and the cell debris was discarded. The protein samples were incubated overnight with high-capacity neutravidin agarose resin (#29204, Thermo Fisher) at 4 °C. The protein samples with agarose resin were centrifuged at 11,000 × g for 2 min at 4 °C and washed with the lysis buffer for 10 min at 4 °C for three times. The protein samples with and without agarose resin were incubated with protein sample buffer at 37 °C for 15 min to recover the proteins. For western blotting, the cells were centrifuged at 11,000 × g for 15 min at 4 °C. To quantified protein sample concentration, Bradford assay (#5000001, Bio-Rad, Hercules, CA, USA) was conducted. The protein samples were loaded onto an SDS-PAGE gel and then transferred onto polyvinylidene difluoride (#1620177, PVDF, BioRad) membranes that had been soaked in methanol to activation. The membranes were incubated with 5% non-fat milk solution to block non-specific binding in TBS-T (Tris-buffered saline [TBS] and 0.5% Tween-20) for 1 h and then treated with CA12 (#15180–1-AP, Proteintech, Rosemont, IL, USA), AE2 (#ab42687, Abcam, Cambridge, UK), and β-actin (#A5441, Sigma) antibodies for overnight at 4 °C and washed three times with TBS-T. To detect the primary antibodies, the PVDF membranes were treated with horseradish peroxidase-conjugated anti-rabbit secondary antibodies for 1 h at 4 °C and the protein bands were visualised using enhanced chemiluminescent solution (ECL, BioRad) and developed on X-ray film (Kodak, Tokyo, Japan).
Immunofluorescence and confocal imaging
Treatment of 100 μM histamine, 2 μM bafilomycin, 10 μM clemastine (#SML0445, Sigma), and 2 μM JNJ7777120 (#J3770, Sigma) for 24 h was performed in seeded cells onto cover glasses. To fix all cells, chilled methanol (-20 °C) was treated for 10 min. The fixed cells were added to 100 mM glycine solution for 10 min at 4 °C and were washed three times with cold DPBS. The cells were blocked with 0.5% bovine serum albumin (BSA) in DPBS supplemented with 10% goat serum for 1 h at room temperature in the dark. CA12 (#sc-374314, Santa Cruz Biotechnology, Dallas, TX, USA), NBCn1 (#ab82335, Abcam), AE2, and NBCe1 (#ab56215, Abcam) antibodies (1:100 dilution in 0.5% BSA in DPBS supplemented with 10% goat serum) were treated at 4 °C for overnight and cells were washed thrice with 0.5% BSA in DPBS. To detect the primary antibodies, cells were treated with secondary antibody with Rhodamine or FITC-tagged goat anti-mouse or rabbit IgG for 1 h at room temperature. The cells were then washed thrice with DPBS, and the cover glasses were carefully attached and mounted on glass slide Fluoromount-GTM containing DAPI. To acquire fluorescence images, Zeiss LSM700 confocal microscope (Fluoview, Carl Zeiss, Germany) was used and analysed with ZEN software.
Measurement of Na+- H+ exchanger (NHE) activity
To measure the intracellular pH (pHi) measurement-based Na+- H+ exchanger (NHE) activity, 20 µM BCECF-AM at dual excitation wavelengths of 440 and 495 nm and a single emission wavelength of 530 nm was used. After treatment of 100 μM histamine for 24 h in Beas-2B and A549, and cultured cells were loaded into the assay chamber with 20 µM BCECF-AM in the presence of 0.1% Pluronic F-127 for 15 min at room temperature in the dark. The dye-loaded cells were perfused with regular solution for at least 4 min to stabilise the fluorescence before measuring the pHi at 37 °C. After the decrease of the pHi level by perfusing 20 mM NH4Cl solution, a Na+-free solution was perfused. Then, the pHi was recovered by Na+-containing regular solution, and the recovery rate was defined as the NHE activity by measuring from the derivatives of the slopes of the first 35–55 s of the pHi recovery trace. The emitted BCECF-AM fluorescence signal was recorded with a Retiga 6000 CCD camera attached to an inverted microscope and analysed using a MetaFluor system. All fluorescence images were obtained at 1-s intervals, and background fluorescence was subtracted from raw background signals at each wavelength.
Measurement of Cl-- HCO3- exchanger (CBE) activity
To measure the intracellular pH (pHi) measurement-based Cl--HCO3- exchanger (CBE) activity, Beas-2B and A549 cells were incubated with 20 µM BCECF-AM at dual excitation wavelengths of 440 and 495 nm and an emission wavelength of 530 nm. After treatment of 100 μM histamine, 10 μM 1,2-Bis (2-aminophenoxy) ethane-N,N,N′,N′-tetraacetic acid tetrakis-acetoxymethyl ester (#A7076, BAPTA-AM, Sigma), and 10 μM KN62, and 2 μM bafilomycin for 24 h in Beas-2B and A549 cells, and cultured cells onto cover glasses were loaded into the assay chamber with 20 µM BCECF-AM in the presence of 0.1% Pluronic F-127 for 15 min at room temperature in the dark. The dye-loaded cells were perfused with regular solution for at least 4 min to stabilise the fluorescence before measuring the pHi at 37 °C. To measure pHi-based CBE activity for chelation free calcium in extracellular media, cells treated with 10 µM 1,2-Bis (2-aminophenoxy) ethane-N,N,N′,N′-tetraacetic acid (#4926, BAPTA, Sigma) were perfused with a regular solution, HCO3- solution, and Cl--free HCO3- solution. The cells were incubated with CO2-saturated HCO3- solution for the acidification of the cytosol, and then, perfused with Cl- free HCO3- solution. All incubated solutions were maintained at 37 °C. CBE activity was calculated from the slope of the increase in pHi during the first 30–45 s in Cl--free HCO3- solution and expressed as the percentage fold change relative to the CBE activity of the control. Fluorescence images were obtained with a Retiga 6000 CCD camera recruited to an inverted microscope and analysed using a Meta Fluor system. All fluorescence images were obtained at 1-s intervals and background fluorescence was subtracted from raw background signals at each wavelength.
DNA transfection
Plasmid DNA transfection was performed by Lipofectamine® 2000 manufacturer’s protocol. CA12 DNA (0.5 μg) or AE2 DNA (1 μg) was diluted in 200 μL of OPTi-MEM buffer (#31985–070, Invitrogen) and 4 μL of Lipofectamine reagent (#11668–019, Invitrogen) and was incubated for 10 min at RT in the darkness. Add transfection mix to the cells in serum containing medium and was incubated at 37 °C in a humidified incubator with 5% CO2 and 95% air. After further 6 h incubation, the medium was replaced with fresh DMEM containing FBS. The cells were cultured and used for experiment after 24 h of transfection.
Statistical analysis
The results are expressed as means ± the standard error of the mean (SEM). Statistical differences between the mean values from the two sample groups were analysed using Student’s t-test. Statistical significance was determined by the analysis of variance in each experiment (*P or #P < 0.05, ** P or ##P < 0.01, ***P or ###P < 0.001).
Results
Membrane expression of CA12 was reduced by histamine treatment in lung cancer cells
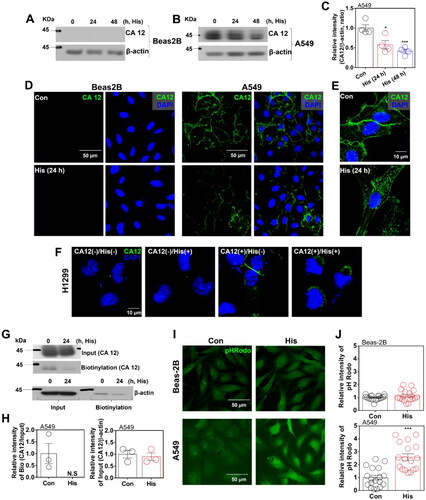
We previously reported that histamine receptor activation through histamine treatment inhibited cellular migrationCitation6. As an oncogenic component CA12 and cellular pH regulation, cancer cell specific enzyme CA12 was illuminated in this study. We examined the expression of CA12 in normal Beas-2B and lung cancer A549 cells. The expression of CA12 was only observed in A549 cells but not in Beas-2B cells (). Western blotting revealed that histamine treatment reduced CA12 expression in A549 cells (). Immunostaining of CA12 revealed that histamine treatment reduced the membrane expression of CA12 in A549 cells, whereas no expression of CA12 was observed in Beas-2B cells regardless of histamine treatment (). The high-magnification image of CA12 expression also revealed cytosolic puncta formation and reduced membrane expression (). Histamine treatment did not affect cell viability (Supplementary Figure 1). To verify the changed localisation of CA12 by histamine treatment, another type of lung adenocarcinoma cell line H1299 cells were used. Expression of CA12 in H1299 cells was extremely low. Thus, CA12 was overexpressed in H1299 cells to verify the role of histamine treatment on CA12 in another cancer cell line. Histamine treatment also reduced membrane expression of CA12 in H1299 cells (). Histamine receptors expression of Beas-2B, A549, and H1299 cells were verified with mRNA expressionCitation6, (Supplementary Figure 2(A,B)). Additionally, to verify the protein expression of CA12, we performed a surface biotinylation assay. Histamine treatment reduced the surface expression of CA12 () and its altered localisation induces acidic environmentCitation14. Thus, we measured the histamine receptor activation-mediated effect on intracellular pH with pHRodo technique. Histamine treatment induced an acidic intracellular pH in A549 cells compared to that of Beas-2B cells (). We previously addressed histamine stimulation enhanced histamine receptor 1 and 4 (H1R and H4R) in A549 cellsCitation6. To verify the dominant histamine receptor, A549 cells were treated with H1R antagonist clemastineCitation21 and H4R antagonist JNJ7777120 [Citation21] in presence of histamine stimulation. CA12 expression was restored in presence of clemastine compared to that of JNJ7777120 in A549 cells (Supplementary Figure 3(A,B)). These results address that membrane expression of CA12 was reduced by histamine treatment in A549 lung cancer cells and that the pH of the cancer cells maintained more acidic than that of normal lung cell by the histamine treatment.
Figure 1. Membrane expression of CA12 was reduced by histamine treatment in lung cancer cells. Protein expression levels of CA12 after histamine (His) treatment (100 μM, 24 h and 48 h) in both (A) Beas-2B (left panels) and (B) A549 (right panels) cells. β-actin was used as a loading control. (C) The graph indicates relative intensity of CA12, normalised by β-actin. The bars represent means ± SEM (n = 4, *p < 0.05, ***p < 0.001). β-actin was used as a loading control. (D) Immunofluorescence staining of CA12 (green) and DAPI (blue) after His treatment (100 μM, 24 h) in Beas-2B and A549 cells. The scale bar represents 50 μm. (E) High magnification of immunofluorescence staining of CA12 (green) and DAPI (blue) after His treatment (100 μM, 24 h) in A549 cells. The scale bar represents 10 μm. (F) Immunofluorescence staining of CA12 (green) and DAPI (blue) after His treatment (100 μM, 24 h) in CA12-overexpressed H1299 cells. The scale bar represents 10 μm. (G) Surface expression of CA12 after His (100 μM, 24 h) treatment in A549. (H) The graph indicates relative intensity of CA12, normalised by input CA12 and β-actin. The bars represent means ± SEM (n = 3). β-actin was used as a loading control. (I) pHRodo staining (green) after His treatment (100 μM, 24 h) in Beas-2B and A549 cells. The scale bar represents 50 μm. (J) The graph indicates the relative intensity of pHRodo. The bars present means ± SEM (n = 18, ***p < 0.001).
Histamine treatment reduced NBC activity in A549 cells
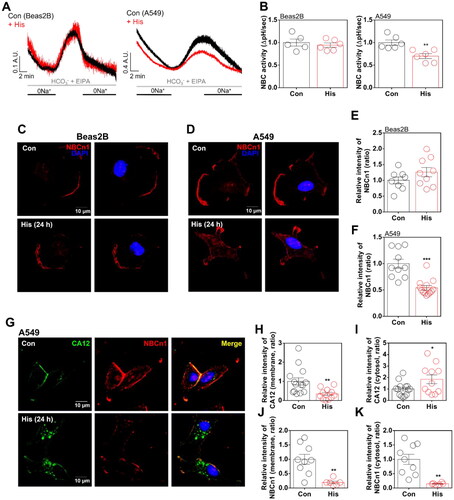
The bicarbonate gradient is mediated by CAs and its associated bicarbonate transportersCitation22. Thus, we measured bicarbonate transporter NBC activity in normal Beas-2B and lung cancer A549 cells. Histamine treatment attenuated NBC activity in A549 cells but not in Beas-2B cells (). NBC activity is mediated by NBCn1 or NBCe1, which are associated with cellular migratory moduleCitation23. The cellular localisation of NBCn1 was revealed in the plasma membrane in both cell lines, whereas histamine treatment attenuated the membrane expression of NBCn1 in A549 cells but not in Beas-2B cells (). Moreover, the localisation of NBCe1, another type of NBC, was also changed into cytosolic area in A549 cells but not in Beas-2B cells (Supplementary Figure 4(A,B)). Our previous study examined the protein interaction between CA12 and NBCn1Citation14,Citation24. We confirmed that histamine stimulation induced internal co-localisation of both CA12 and NBCn1 (). Reduced NBC activity by histamine was mediated by the reduced membrane expression of NBCs (). Additionally, NHE activity, as major pH-regulating transporterCitation25, was not affected by the histamine stimulation in both cell lines (Supplementary Figure 5(A,B)). These results address that histamine stimulation reduced NBC activity through the internalised CA12 with reduced NBCn1.
Figure 2. Histamine treatment reduced NBC activity in A549 cells. (A) NBC activity in response to histamine (His) treatment (100 μM) for 24 h in Beas-2B (left panel) and A549 (right panel) cells. (B) The graphs indicate NBC activities of Beas-2B (left panel) and A549(right panel) cells in response to His treatment (100 μM). The bars represent means ± SEM (n = 5 ∼ 6, **p < 0.01). (C, D) Immunofluorescence staining of NBCn1 (red) and DAPI (blue) after His treatment (100 μM, 24 h) in Beas-2B (C) and A549 (D) cells. The scale bar represents 10 μm. (E) The graph indicates the relative intensity of NBCn1 after His treatment (100 μM, 24 h) in Beas-2B cells. The bars represent means ± SEM (n = 8 ∼ 9). (F) The graph indicates relative intensity of NBCn1 after His treatment (100 μM, 24 h) in A549 cells. The bars represent means ± SEM (n = 10 ∼ 13, ***p < 0.001). (G) Immunofluorescence staining of CA12 (green) and NBCn1 (red) after His treatment (100 μM, 24 h) in A549 cells. DAPI (nucleus, blue). (H ∼ K) The graph indicates relative intensity of CA12-membrane fraction (H), CA12-cytosolic fraction (I), NBCn1-membrane fraction (J), and NBCn1-cytosolic fraction (K) after His treatment (100 μM, 24 h) in A549 cells. The bars represent means ± SEM (n = 6 ∼ 14, *p < 0.05, **p < 0.01).
Histamine treatment enhanced CBE activity with the involvement of intracellular calcium increase
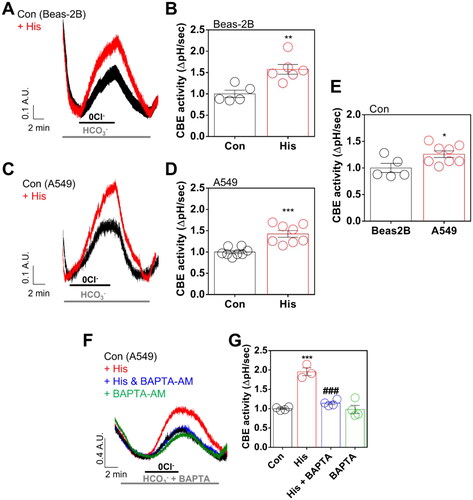
CBE activity is also modulated by the involvement of CA12 through protein interaction and supply of bicarbonate sourceCitation14,Citation26. Thus, we verified whether histamine-modulated CA12 attenuated CBE activity. Histamine receptor activation enhanced CBE activity in both normal and cancer cell lines (). The histamine receptor activation-mediated enhanced CBE activities were not mediated by CA12 localisation in both cells. We found that the basal CBE activity of A549 cells was higher than that of Beas-2B cells (). It has been known that CBE activity is dependent on an increase in the intracellular calcium concentrationCitation27. Thus, A549 cells were treated with BAPTA-AM and BAPTA to chelate free calcium in both the cytosolic and extracellular media. Treatment of BAPTAs reduced histamine receptor activation-mediated CBE activity in A549 cells (). These results address that histamine treatment enhanced CBE activity with involvement of an increase in intracellular calcium concentration.
Figure 3. Histamine treatment enhanced CBE activity with the involvement of intracellular calcium increase. (A) CBE activity in response to histamine (His) treatment (100 μM) for 24 h in Beas-2B cells. (B) The graph indicates CBE activity in response to His treatment (100 μM). The bars represent means ± SEM (n = 5 ∼ 6, **p < 0.01). (C) CBE activity in response to His treatment (100 μM) for 24 h in A549 cells. (D) The graph indicates CBE activity in response to His treatment (100 μM). The bars represent means ± SEM (n = 8, ***p < 0.001). (E) The graphs indicate the CBE activities of Beas-2B and A549 cells in control. The bars represent means ± SEM (n = 5 ∼ 8, *p < 0.05). (F) CBE activity in response to His treatment (100 μM) with and without BAPTA-AM (BAPTA; 10 μM) for 24 h in A549 cells. (G) The graph indicates CBE activity in response to His treatment (100 μM) with and without BAPTA-AM (10 μM) for 24 h in A549 cells. The bars represent means ± SEM (n = 3 ∼ 4, ***p < 0.001 vs Control and ###p < 0.001 vs His-treated group).
Histamine mediated CA12 and AE2 trafficking through the involvement of calcium-dependent calmodulin kinase II
Calcium-dependent CBE activity was mediated by the anion exchanger AE2, which is a ubiquitously expressed member of the chloride/bicarbonate exchanger familyCitation27. We determined the localisation of CA12 and AE2. Membrane expression of CA12 and AE2 was internalised by histamine treatment (). Especially, cytosol and membrane expressions of AE2 were increased by histamine treatment (). Histamine receptor activation-mediated intracellular signalling is associated with type II calcium-dependent calmodulin kinase (CaMKII) Citation6. To verify the CaMKII–dependent histamine signalling on AE2 activity, CaMKII inhibitor KN62Citation28 was administrated. Treatment of KN62 reduced histamine receptor activation-associated CBE activity (). Total and surface expression of AE2 was enhanced by histamine treatment, whereas AE2 surface expression was reduced in the presence of KN62 (). However, treatment of KN62 mildly restored surface expression of CA12 ().
Figure 4. Histamine mediated CA12 and AE2 trafficking through the involvement of calcium-dependent calmodulin kinase II. (A) Immunofluorescence staining of CA12 (green) and AE2 (red) after histamine (His) treatment (100 μM, 24 h) in A549 cells. DAPI (nucleus, blue). (B) CBE activity in response to His treatment (100 μM) with and without KN62 (10 μM) for 24 h in A549 cells. (C) The graph indicates CBE activity in response to His treatment (100 μM) with and without KN62 (10 μM) for 24 h in A549 cells. The bars represent means ± SEM (n = 4 ∼ 5, *p < 0.05 vs Control and #p < 0.05 vs His-treated group). (D) Surface expression of AE2 and CA12 after His (100 μM) with and without KN62 (10 μM) for 24 h in A549 cells. (E) The graph indicates the relative intensity of AE2 normalised by input AE2 and β-actin. The bars represent means ± SEM (n = 5, *p < 0.05 vs Control and #p < 0.05 vs His-treated group). β-actin was used as a loading control. (F) The graph indicates the relative intensity of CA12 normalised by input CA12 and β-actin. The bars represent means ± SEM (n = 6, *p < 0.05 vs Control). β-actin was used as a loading control. (G) pHRodo staining (green) after His treatment (100 μM) with and without KN62 (10 μM) for 24 h in A549 cells. The scale bar represents 50 μm. (H) The graph indicates the relative intensity of pHRodo. The bars present means ± SEM (n = 4 ∼ 6, ***p < 0.001 vs Control and #p < 0.05 vs His-treated group).
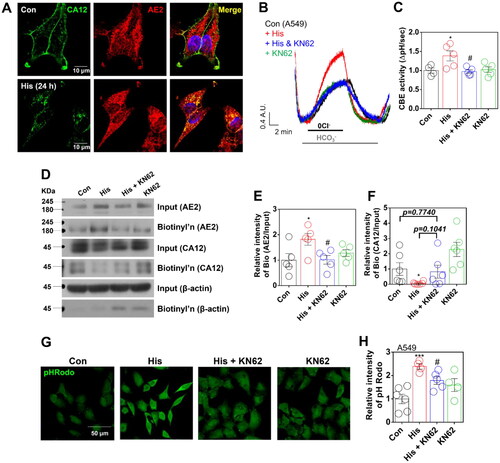
To examine the restored surface expression of CA12, we measured the cytosolic pH using pHRodo. The histamine receptor activation-mediated acidic pH was reduced by the treatment of KN62 (). We confirmed whether enhanced AE2 induces acidic pH. AE2-overexpressed HEK293T cells enhanced pHRodo intensity in presence of histamine treatment, suggesting that histamine receptor activation mediated cellular acidosis (Supplementary Figure 6(A,B)). These results address that histamine treatment induced increased membranous AE2 and endocytic CA12 trafficking, and these effects were restored by CaMKII inhibition.
Cellular pH was modulated by CA12 and AE2 trafficking
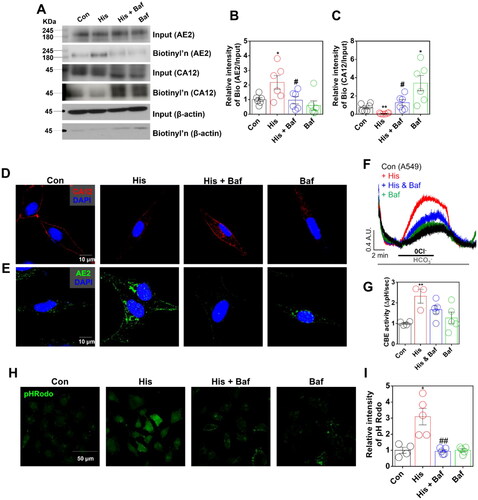
Protein trafficking is mediated by involvement of endocytic processCitation29. To confirm histamine receptor activation-mediated CA12 and AE2 trafficking and modulation of cellular pH, cells were treated bafilomycin A1 (Baf), which is an inhibitor of protein trafficking from early endosome and V-ATPase inhibitorCitation30. To evaluate the trafficking of AE2 by histamine treatment, AE2 expression was determined with and without Baf. The histamine receptor activation-mediated enhanced membranous AE2 was reduced by Baf treatment (). In addition, treatment of Baf enhanced the surface expression of CA12 and restored the reduced CA12, which is attenuated by histamine (). Immunostaining image of CA12 revealed the restored surface expression of CA12 in presence of Baf (). Histamine treatment induced membranous expression of AE2 and the trafficking of AE2 towards membrane was inhibited by Baf (). Trafficking of AE2 was verified by the measurement of CBE activity. Histamine receptor activation-mediated CBE activity was attenuated by treatment of Baf (). The histamine receptor activation-mediated acidic cellular pH was also attenuated by Baf treatment (). NBC expression and activity were reduced by histamine receptor activation and Baf treatment did not restore the NBC expression (Supplementary Figure 7(A–C)). These results address that histamine receptor activation induced internalised CA12 and membranous AE2. Additionally, trafficking of CA12 and AE2 is involved in modulation of cellular pH.
Figure 5. Cellular pH was modulated by CA12 and AE2 trafficking. (A) Surface expression of CA12 and AE2 after histamine (His) (100 μM) with and without bafilomycin (Baf; 2 μM) for 24 h in A549 cells. (B) The graph indicates the relative intensity of AE2 normalised by input AE2 and β-actin. The bars represent means ± SEM (n = 6, *p < 0.05 vs Control and #p < 0.05 vs His-treated group. (C) The graph indicates the relative intensity of CA12 normalised by input CA12 and β-actin. The bars represent means ± SEM (n = 6, *p < 0.05 or **p < 0.01 vs Control and #p < 0.05 vs His-treated group). β-actin was used as a loading control. (D) Immunofluorescence staining of CA12 (red) and DAPI (blue) after His treatment (100 μM) with and without Baf (2 μM) for 24 h in A549 cells. (E) Immunofluorescence staining of AE2 (green) and DAPI (blue) after His treatment (100 μM) with and without Baf (2 μM) for 24 h in A549 cells. (F) CBE activity in response to His treatment (100 μM) with or without Baf (2 μM) for 24 h in A549 cells. (G) The graph indicates CBE activity in response to His treatment (100 μM) with and without Baf (2 μM) for 24 h in A549 cells. The bars represent the mean ± SEM (n = 3 ∼ 5, **p < 0.01). (H) pHRodo staining (green) after His treatment (100 μM) with and without Baf (2 μM) for 24 h in A549 cells. The scale bar represents 50 μm. (I) The graph indicates the relative intensity of pHRodo. The bars present means ± SEM (n = 4 ∼ 5, *p < 0.05 vs Control and ##p < 0.01 vs His-treated group).
Discussion
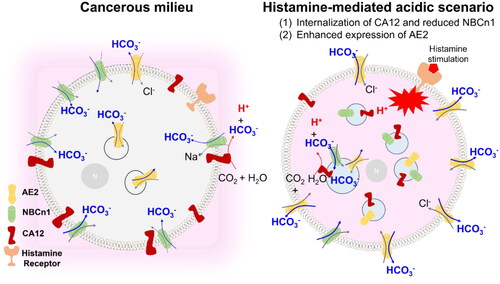
In this study, we addressed that histamine receptor activation-mediated signalling attenuated the membrane expression of CA12 and that histamine-mediated cellular acidification is mediated by intracellular localisation of CA12 in lung cancer cells. In addition, histamine-mediated CA12 endocytosis and cellular pH were restored by CaMKII inhibition. CA12-associated AE2 expression was enhanced, whereas NBCn1 expression and its activity were reduced by histamine stimulation. Activation of histamine signalling revealed cellular acidosis, and its histamine-mediated cellular acidification was induced by involvement of internalised CA12. Its acidification was also performed by internalised and reduced NBCn1 and enhanced membrane expression of AE2, which cause reduced bicarbonate absorption and enhanced bicarbonate efflux, respectively. In addition to regulatory role of bicarbonate transporters on intracellular pH, NBCn1 as an invasive module has been addressedCitation23. It also has been addressed that AE2 participates in various cancer progressionCitation12,Citation31,Citation32. In this study, convergent modulation by internalised CA12 and reduced NBCn1 and enhanced membrane expression of AE2 occurred in lung cancer cells. Internalised CA12 and reduced NBCn1 may be involved in exhaustion of cytosolic bicarbonate and, at the same time, AE2 may involve in the bicarbonate extrusion. Accordingly, histamine treatment decreased the cellular pH, and these cellular state, as we termed the acidic scenario, would be occurred through the coordinated trafficking of bicarbonate-associated components such as CA12, NBCn1, and AE2 ().
Figure 6. Schematic illustration of cellular pH regulation through the histamine-mediated acidic scenario. NBCn1 and its associated CA12 co-localize at the plasma membrane. Histamine stimulation induces convergent trafficking of pH-associated proteins such as internalised CA12 and reduced NBCn1 and enhanced expression of AE2 in lung cancer cells. Internalised CA12 and reduced NBCn1 exhausted cytosolic bicarbonate and the enhanced AE2 exacerbates bicarbonate efflux. This histamine receptor activation-induced phenomenon mediated acidic cytosol as termed acidic scenario.
Acidic environment is favourable feature in cancer migration and metastasisCitation33,Citation34. CA12, in addition to membrane-associated CA form CA9, possess a high impact on cancer metastasis through interaction with other invasive machinery proteinsCitation10. For example, the bicarbonate transporters NBCe1 or NBCn1 in lung, colon, and breast cancerCitation16,Citation24,Citation35 provide a local bicarbonate source to CA for efficient regulation of cellular pHCitation36. In addition to pH regulation, cellular migration is modulated by the involvement of bicarbonate transporters as migratory moduleCitation37,Citation38. Corrected cell volume is accompanied by electrolyte and water transport through various ion channels and transporters and rearranged actin cytoskeletal proteinsCitation37.
The microenvironment of cancer with regard to pH fluctuation is dynamically changed. Activation of histamine receptors is involved in the prevention of the epithelial-to-mesenchymal transition process in lung cancer and is considered a therapeutic strategy against lung cancerCitation39,Citation40. In addition, recently developed histamine ligands and histamine itself are known modulators of CAs enzymatic activityCitation41,Citation42. Modulated CA activity by histamine derivatives can affect cellular pH and would be new strategy in the field of cancer therapy. Moreover, information on acidic scenario-associated ion transporters or enzymes may provide potential approach strategy against cancer cell adaptation. Thus, in this study, we verified that histamine stimulation induced an acidic scenario in lung cancer cells and its dysregulated pH modulation may be involved in the histamine signalling-mediated anti-cancer process. Moreover, modulation of the acidic scenario, by involvement of internalised CA12 and reduced NBCn1 and the enhanced bicarbonate extruder AE2, would be conceptual therapeutic strategy against cancer development.
Author contribution
HJK and JHH conceptualised and designed the study and acquired, analysed, and interpreted data; HJK and JHH drafted the manuscript and acquired data. JHH revised the manuscript critically for important intellectual content; JHH contributed to the funding acquisition and final approval of the published version and are responsible for all aspects of the work as regards the accuracy and integrity of the study.
Supplemental Material
Download PDF (1 MB)Acknowledgement
All figures were developed by the authors. All of the image data acquisition was performed at the Cell to In Vivo Imaging Core Facility Research Center (CII, Lee Gil Ya Cancer and Diabetes Institute, Gachon University, Incheon, South Korea).
Disclosure statement
The authors have no conflicts of interest to declare.
Additional information
Funding
References
- Massari NA, Nicoud MB, Medina VA. Histamine receptors and cancer pharmacology: an update. Br J Pharmacol. 2020;177(3):516–538.
- Sarasola M. d l P, Táquez Delgado MA, Nicoud MB, Medina VA. Histamine in cancer immunology and immunotherapy. Current status and new perspectives. Pharmacol Res Perspect. 2021;9(5):e00778.
- Stoyanov E, Uddin M, Mankuta D, Dubinett SM, Levi-Schaffer F. Mast cells and histamine enhance the proliferation of non-small cell lung cancer cells. Lung Cancer. 2012;75(1):38–44.
- Della Rovere F, Granata A, Familiari D, Zirilli A, Cimino F, Tomaino A. Histamine and selenium in lung cancer. Anticancer Res. 2006;26(4B):2937–2942.
- Clauzure M, Taquez Delgado MA, Phillip JM, et al. Histamine H4 receptor agonism induces antitumor effects in human T-cell lymphoma. Int J Mol Sci. 2022;23(3):1378.
- Kim HJ, Lee PCW, Hong JH. Lamin-A/C is modulated by the involvement of histamine-mediated calcium/calmodulin-dependent kinase II in lung cancer cells. Int J Mol Sci. 2022;23(16):9075.
- Singh S, Lomelino CL, Mboge MY, et al. Cancer drug development of carbonic anhydrase inhibitors beyond the active site. Molecules. 2018;23(5):1045.
- Hsieh M-J, Chen K-S, Chiou H-L, Hsieh Y-S. Carbonic anhydrase XII promotes invasion and migration ability of MDA-MB-231 breast cancer cells through the p38 MAPK signaling pathway. Eur J Cell Biol. 2010;89(8):598–606.
- Williams KJ, Gieling RG. Preclinical evaluation of ureidosulfamate carbonic anhydrase IX/XII inhibitors in the treatment of cancers. Int J Mol Sci. 2019;20(23):6080.
- Daunys S, Petrikaitė V. The roles of carbonic anhydrases IX and XII in cancer cell adhesion, migration, invasion and metastasis. Biol Cell. 2020;112(12):383–397.
- Guerrini G, Criscuoli M, Filippi I, Naldini A, Carraro F. Inhibition of smoothened in breast cancer cells reduces CAXII expression and cell migration. J Cell Physiol. 2018;233(12):9799–9811.
- Hwang S, Shin DM, Hong JH. Drug repurposing as an antitumor agent: disulfiram-mediated carbonic anhydrase 12 and anion exchanger 2 modulation to inhibit cancer cell migration. Molecules. 2019;24(18):3409.
- He Q, Chen H, Wong CHY, Tsang LL, Chan HC. Regulatory mechanism underlying cyclic changes in mouse uterine bicarbonate secretion: role of estrogen. Reproduction. 2010;140(6):903–910.
- Hong JH, Muhammad E, Zheng C, Hershkovitz E, Alkrinawi S, Loewenthal N, Parvari R, Muallem S. Essential role of carbonic anhydrase XII in secretory gland fluid and HCO3 (-) secretion revealed by disease causing human mutation. J Physiol. 2015;593(24):5299–5312.
- Kong SC, Giannuzzo A, Novak I, Pedersen SF. Acid-base transport in pancreatic cancer: molecular mechanisms and clinical potential. Biochem Cell Biol. 2014;92(6):449–459.
- Parks SK, Pouyssegur J. The Na+/HCO3- co-transporter SLC4A4 plays a role in growth and migration of colon and breast cancer cells. J Cell Physiol. 2015;230(8):1954–1963.
- Lee S, Axelsen TV, Andersen AP, Vahl P, Pedersen SF, Boedtkjer E. Disrupting Na+, HCO3–cotransporter NBCn1 (Slc4a7) delays murine breast cancer development. Oncogene. 2016;35(16):2112–2122.
- Lee S, Mele M, Vahl P, Christiansen PM, Jensen VED, Boedtkjer E. Na+,HCO3 (-)-cotransport is functionally upregulated during human breast carcinogenesis and required for the inverted pH gradient across the plasma membrane. Pflugers Arch. 2015;467(2):367–377.
- Song L-J, Liu R-J, Zeng Z, Alper SL, Cui H-J, Lu Y, Zheng L, Yan Z-W, Fu G-H. Gastrin inhibits a novel, pathological colon cancer signaling pathway involving EGR1, AE2, and P-ERK. J Mol Med (Berl)). 2012;90(6):707–718.
- Ji M, Kim HJ, Ahn CB, Son KH, Hong JH. Cellular channelopathy mediated by hypergravity: IL-6-mediated Nkcc1 activation and enhanced Trpm2 expression in rat atrium. Cell Tissue Res. 2021;383(3):1017–1024.
- Matsumoto N, Ebihara M, Oishi S, Fujimoto Y, Okada T, Imamura T. Histamine H1 receptor antagonists selectively kill cisplatin-resistant human cancer cells. Sci Rep. 2021;11(1):1492.
- Waheed A, Sly WS. Carbonic anhydrase XII functions in health and disease. Gene. 2017;623:33–40.
- Hwang S, Shin DM, Hong JH. Protective role of IRBIT on sodium bicarbonate cotransporter-n1 for migratory cancer cells. Pharmaceutics. 2020;12(9):816.
- Lee D, Hong JH. The fundamental role of bicarbonate transporters and associated carbonic anhydrase enzymes in maintaining ion and ph homeostasis in non-secretory organs. Int J Mol Sci. 2020;21(1):339.
- Cingolani HE, Ennis IL. Sodium-hydrogen exchanger, cardiac overload, and myocardial hypertrophy. Circulation. 2007;115(9):1090–1100.
- Jeong YS, Hong JH. Governing effect of regulatory proteins for Cl-/HCO3- exchanger 2 activity. Channels (Austin)). 2016;10(3):214–224.
- Hwang S, Shin DM, Hong JH. Intracellular Ca2+-mediated AE2 is involved in the vectorial movement of HaCaT keratinocyte. Int J Mol Sci. 2020;21(22):8429.
- Clyne CD, Nguyen A, Rainey WE. The effects of KN62, a Ca2+/calmodulin-dependent protein kinase II inhibitor, on adrenocortical cell aldosterone production. Endocr Res. 1995;-May21(1-2):259–265.
- Stenbeck G, Horton MA. Endocytic trafficking in actively resorbing osteoclasts. J Cell Sci. 2004;117(Pt 6):827–836.
- Okiyoneda T, Niibori A, Harada K, Kohno T, Hashimoto Y, Kusuhara H, Takada T, Shuto T, Suico MA, Sugiyama Y, et al. Bafilomycin Al-sensitive pathway is required for the maturation of cystic fibrosis transmembrane conductance regulator. Biochim Biophys Acta. 2006;1763(10):1017–1023.
- Shiozaki A, Hikami S, Ichikawa D, Kosuga T, Shimizu H, Kudou M, Yamazato Y, Kobayashi T, Shoda K, Arita T, et al. Anion exchanger 2 suppresses cellular movement and has prognostic significance in esophageal squamous cell carcinoma. Oncotarget. 2018;9(40):25993–26006.
- Wang H, An JX, Jin H, et al. Roles of Cl-/HCO3- anion exchanger 2 in the physiology and pathophysiology of the digestive system (Review). Mol Med Rep. 2021;24(1):491.
- Park Y, Jeong J, Seong S, et al. In silico evaluation of natural compounds for an acidic extracellular environment in human breast cancer. Cells. 2021;10(10):2673.
- Logozzi M, Spugnini E, Mizzoni D, Di Raimo R, Fais S. Extracellular acidity and increased exosome release as key phenotypes of malignant tumors. Cancer Metastasis Rev. 2019;38(1-2):93–101.
- Ahmed S, Thomas G, Ghoussaini M, Healey CS, Humphreys MK, Platte R, Morrison J, Maranian M, Pooley KA, Luben R, et al. Newly discovered breast cancer susceptibility loci on 3p24 and 17q23.2. Nat Genet. 2009;41(5):585–590.
- McDonald PC, Swayampakula M, Dedhar S. Coordinated regulation of metabolic transporters and migration/invasion by carbonic anhydrase IX. Metabolites. 2018;8(1):20.
- Schwab A, Fabian A, Hanley PJ, Stock C. Role of ion channels and transporters in cell migration. Physiol Rev. 2012;92(4):1865–1913.
- Hwang S, Lee PC-W, Shin DM, Hong JH. Modulated start-up mode of cancer cell migration through spinophilin-tubular networks. Front Cell Dev Biol. 2021;9:652791.
- Cai W-K, Hu J, Li T, Meng J-R, Ma X, Yin S-J, Zhao C-H, He G-H, Xu G-L. Activation of histamine H4 receptors decreases epithelial-to-mesenchymal transition progress by inhibiting transforming growth factor-beta1 signalling pathway in non-small cell lung cancer. Eur J Cancer. 2014;50(6):1195–1206.
- Nicoud MB, Formoso K, Medina VA. Pathophysiological Role of Histamine H4 Receptor in Cancer: Therapeutic Implications. Front Pharmacol. 2019;10:556.
- Saada M-C, Montero J-L, Vullo D, Scozzafava A, Winum J-Y, Supuran CT. Carbonic Anhydrase Activators: Gold Nanoparticles Coated with Derivatized Histamine, Histidine, and Carnosine Show Enhanced Activatory Effects on Several Mammalian Isoforms. J Med Chem. 2011;54(5):1170–1177.
- Provensi G, Nocentini A, Passani MB, Blandina P, Supuran CT. Activation of carbonic anhydrase isoforms involved in modulation of emotional memory and cognitive disorders with histamine agonists, antagonists and derivatives. J Enzyme Inhib Med Chem. 2021;36(1):719–726.