
Abstract
Toll-like receptor (TLR) innate immunity signalling protects against pathogens, but excessive or prolonged signalling contributes to a range of inflammatory conditions. Structural information on the TLR cytoplasmic TIR (Toll/interleukin-1 receptor) domains and the downstream adaptor proteins can help us develop inhibitors targeting this pathway. The small molecule o-vanillin has previously been reported as an inhibitor of TLR2 signalling. To study its mechanism of action, we tested its binding to the TIR domain of the TLR adaptor MAL/TIRAP (MALTIR). We show that o-vanillin binds to MALTIR and inhibits its higher-order assembly in vitro. Using NMR approaches, we show that o-vanillin forms a covalent bond with lysine 210 of MAL. We confirm in mouse and human cells that o-vanillin inhibits TLR2 but not TLR4 signalling, independently of MAL, suggesting it may covalently modify TLR2 signalling complexes directly. Reactive aldehyde-containing small molecules such as o-vanillin may target multiple proteins in the cell.
Introduction
Mammalian Toll-like receptors (TLRs) are integral to innate immune cell activation by foreign molecules. There are ten different TLRs in humans (TLR1-10) that recognise a range of microbial molecules, including bacterial cell-wall products and viral and bacterial nucleic acidsCitation1. For example, TLR4 recognises bacterial lipopolysaccharide (LPS) and signals as a homodimer, and TLR2 functions as a heterodimer with either TLR1 or TLR6, to respond to bacterial lipoproteins. TLR ligand binding leads to dimerisation of their cytosolic TIR (Toll/interleukin-1 receptor) domains, which creates a platform to recruit the TIR domain-containing adaptor proteinsCitation2,Citation3. The adaptor protein MAL (MyD88 adaptor-like protein; also called TIRAP, Toll/interleukin-1 receptor domain-containing adaptor protein) acts as a bridging adaptor for the association of the adaptor MyD88 (myeloid differentiation primary response gene 88) with TLR2 and 4. Recruitment of these adaptors enables further downstream signalling that leads to the production of pro-inflammatory cytokines.
Excessive or prolonged activity of TLR pathways can lead to chronic inflammatory conditions and TLR signalling has been linked to the pathology of a wide variety of conditionsCitation4,Citation5 including sepsisCitation6, inflammatory diseases such as atherosclerosisCitation7, and autoimmune conditions including systemic lupus erythematosusCitation8. In principle, targeted therapies against individual TLRs could provide specific anti-inflammatory outcomes. TLR antagonists, developed both against the TLR extracellular domains and downstream pathwaysCitation9, have not yet progressed beyond clinical trials as drugs available on the market Citation10,Citation11. The targeting of protein-protein interactions involving the downstream adaptors provides an alternative approach and offers a new paradigm to selectively inhibit distinct arms of these pathways. Small molecule drugs have better cell permeability, bioavailability and lower cost, as compared to other therapeutic modalities, e.g. antibodies, oligonucleotides, lipid-A analogues and microRNAsCitation12.
To confront the challenge of targeting the downstream adaptors, a structure-guided approach can be adopted to design small-molecule inhibitors. Structure-function relationships of the TIR domain of MAL (MALTIR) have been studied extensively. A number of groups have reported crystal structures of the wild-type (WT) protein and several mutants of MALTIR Citation13–16. However, all these structures feature disulfide bonds, raising questions whether they reflect the structure in the cytoplasmic compartment of the cell. Indeed, recombinant MALTIR freshly expressed in E. coli does not contain disulfide bonds, and the solution structure of the C116A mutant (MALTIR-C116A) is in the reduced form that shows considerable structural differences from the reported crystal structuresCitation17. Conformational flexibility of the protein is further highlighted in the cryo-EM (cryogenic electron microscopy) structure of the filamentous MALTIR complex, which features an open-ended assembly of two parallel strands of MALTIR subunits arranged in a head-to-tail fashionCitation18. This assembly is held together by two types of asymmetric TIR:TIR interfaces, intra-strand and inter-strand interfaces, and mutations in these interfaces affect the signalling ability of the protein in cells, validating the relevance of the filamentous assembly to the interactions formed during signalling in cells Citation18. A structurally analogous assembly of the TIR domains of MyD88 provides further support for the proposed signalosome structure and the corresponding ‘signalling by cooperative assembly formation’ (SCAF) mechanismCitation19,Citation20.
The available structural information can aid in developing inhibitors targeting MALTIR. To our knowledge, no small molecule inhibitors of MAL have been reported. Mice engineered to have the human MAL polymorphism D96N that leads to impaired TLR4 and TLR2 responses, are protected from LPS-induced lethality in vivo and have reduced inflammation, validating the therapeutic potential of targeting MALCitation21. Peptides directed against MALTIR show a protective response in mice by reducing systemic inflammation against influenza, further supporting the concept of using this adaptor as a drug targetCitation22.
In a study aiming to design inhibitors in silico that bind to the functionally important ‘BB-loop’ region of TLR2, a compound was generated that acted as an inhibitor of TLR2 signalling, following its hydrolysis to ortho-vanillin (o-vanillin)Citation23. We tested if o-vanillin can target MALTIR, and show that it indeed interferes with MALTIR higher-order assembly in vitro. We used a number of nuclear magnetic resonance (NMR) approaches to characterise its binding to MALTIR and show that it forms a covalent bond with K210 of MAL. Consistent with prior workCitation23, at selected TLR ligand concentrations, o-vanillin inhibited TLR2 but not TLR4 signalling. However, there was a complex pattern of inhibition, which was strongest for TLR2 in the absence of MAL. Consequently, it is likely that o-vanillin targets other cellular proteins including TLR2 complexes. We conclude that reactive aldehyde-containing small molecules such as o-vanillin are unlikely to provide highly specific small molecule drugs.
Materials and methods
Materials
Recombinant human colony stimulating factor 1 (CSF-1) was a gift from Chiron, Emeryville, CA. Complete RPMI (Roswell Park Memorial Institute) is RPMI-1640 medium that contains 10% heat-inactivated FCS (foetal calf serum, Gibco), 50 μg/mL streptomycin, 50 U/mL penicillin, 1× GlutaMAX and 25 mM HEPES. Complete DMEM is DMEM medium that contains 10% heat-inactivated FCS, 50 μg/mL streptomycin, 50 U/mL penicillin and 1x GlutaMAX. All tissue culture reagents are from Life Technologies, unless otherwise noted. TLR ligands ultrapure E. coli LPS (TLR4), Pam2CSK4 (TLR2/6), Pam3CSK4 (TLR2/1) and R837 (TLR7) were obtained from InvivoGen, and E. coli DNA was obtained from Sigma and purified free of LPS as describedCitation24. Propidium iodide (PI; Life Technologies) was diluted in phosphate buffered saline (PBS) to a stock concentration of 1 mg/mL. All candidate inhibitor compounds including o-vanillin and its analogues vanillin, 2,4,6-trimethoxybenzaldehyde (2, 4, 6-TMB), 2,4-dihydroxybenzaldehyde (2, 4-DHB), 2-nitrobenzaldehyde (2-NB), 2,4,6-trihydroxybenzaldehyde (2, 4, 6-THB), 3-quinolinecarboxaldehyde (3-QC), o-vanillic acid, o-acetovanillon and 2,3-dimethoxy-benzaldehyde (2,3-DEB) were purchased from Sigma-Aldrich.
Expression and purification of MALTIR
The human MALTIR construct (residues 79–221, Supplemental Figure S1A) in the pMCSG7 expression vectorCitation17 was transformed into E. coli BL21 (DE3) cells by heat-shock. Cells were then grown in auto-induction medium at 37 °C, with shaking at 225 rpm until an OD600 nm of 0.6–0.8 was reached. The temperature was then reduced to 20 °C for protein expression. After about 16 h, cells were harvested and lysed by sonication. The soluble fraction was then collected, and protein purification was carried out by immobilised metal affinity chromatography (IMAC), using a 5 ml nickel (Ni)-column. Fractions from affinity purification were pooled together and treated overnight with tobacco etch virus (TEV) protease at 4 °C to remove the His-tags, and the protein was re-eluted over the 5 ml Ni-column. The flow-through collected from this step was further purified by size-exclusion chromatography (SEC), using a Superdex 75 gel-filtration column (GE Healthcare 26/600 S75) into the gel-filtration buffer that contained 10 mM HEPES, pH 7.5 and 150 mM NaCl. The integrity of the expressed MALTIR was confirmed by mass spectrometry (intact mass analysis; Supplemental Figure S1B-C).
Analysis of MALTIR filament formation in vitro
The MALTIR protein (∼87.5–103 µM in 100 µL of 10 mM HEPES, pH 7.5 and 150 mM NaCl) or protein with pre-mixed ligands was aliquoted into a 96-well plate. Filament formation was then monitored in a SpectraMax 250 spectrophotometer (Molecular Devices) at 30 °C by the change in turbidity at 500 nm as a function of time Citation18. The initial screen of o-vanillin and its analogues was carried out at 1:50 molar ratio, i.e. for ∼87.5 µM MALTIR protein, 4.4 mM compounds were tested. As o-vanillin, 2-NB, and 3-QC inhibited MALTIR filament formation, these compounds were tested further in a concentration-dependent manner. For 90 µM MALTIR protein, compounds were tested at 1:5, 1:10, 1:25, 1:50 and 1:100 molar ratios that corresponds to 0.45, 0.90, 2.25, 4.5 and 9.0 mM compounds, respectively. To determine the role of reactive groups, o-vanillin, and its analogues o-vanillic acid, o-acetovanillon and 2,3-DEB were tested at 1:20 molar ratio, i.e. for ∼103 µM MALTIR protein, 2 mM compounds were tested.
Expression and purification of 13C-15N labelled MALTIR
After transformation of E. coli BL21 (DE3) cells with the construct mentioned above, cells were grown in 5 mL lysogeny broth with 100 mg/L of ampicillin overnight. The cells were then adapted to M9 minimal medium supplemented with 1 g/L 15N-NH4Cl and 4 g/L 13C-glucose, and this starter culture was used to inoculate 1 L of M9 minimal medium. The cells were then grown at 37 °C with shaking at 225 rpm, until an OD600 nm of 0.6–0.8 was reached. The temperature was then reduced to 20 °C and IPTG (isopropyl-β-D-thiogalactopyranoside) was added to the medium to induce protein overexpressionCitation25. After about 16 h, cells were harvested, and protein was purified as described above. For the labelled protein, a low-salt gel-filtration buffer (10 mM HEPES, pH 7.5 and 10 mM NaCl) was used as the NMR experiments were carried on with this buffer condition. MALTIR mutants were expressed and purified using the same methodology.
Determination of MALTIR structure and characterisation of its interactions with o-vanillin by NMR
All the NMR spectra were recorded with ∼106 µM protein in the buffer containing 10 mM NaCl, 10 mM HEPES, pH 7.5 at 20 °C on a 900-MHz Bruker Neo spectrometer equipped with a cryogenically cooled probe. The protein sample was placed inside a 5 mm susceptibility matched NMR cell (Shigemi) for NMR measurements. For structural analysis of MALTIR, 2D 1H-15N-HSQC and 3D HBHA(CO)NH, HNCA, HNCOCA, HNCACB, CBCA(CO)NH, HNCO, HCCH-TOCSY,15N-HSQC-NOESY and 13C-HSQC-NOESY were recorded, with a mixing period of 180 ms for all the NOESY spectra. For 13C-NOESY dimensions, aliphatic and aromatic spectra were recorded separately. 3D NOESY spectra were recorded using uniform sampling, while other 3D spectra were acquired with nonuniform sampling and maximum entropy reconstruction with the Rowland NMR Toolkit Citation26. The sequential and side-chain assignments for the corresponding 1H,15N, and 13C frequencies were carried out using the CCPNMR software Citation27. Subsequent NOE and structure calculations were carried out with CYANA 3.98.5 Citation28.
Intermolecular NOEs between the protein and ligand were identified using isotope (15N and 13C) filtered 1H–1H NOE experiments (Bruker pulse sequence noesygpphwgx2), with a mixing period of 300 ms. The NOE cross-peaks were assigned using Topspin 4.0.7 (Bruker). A mixing period of 250 ms was used to record the 3D-13C-HSQC-NOESY spectrum (for the aliphatic regions), in the presence of 13C-15N labelled MALTIR and unlabelled o-vanillin at a 1:20 molar ratio. This NOESY spectrum was then compared with the spectrum of ligand-free protein using CCPNMR Citation27. All the structural analyses were performed using PyMOL (Version 2.0.6, Schrödinger) and Chimaera Citation29.
ELAM promoter assay
Mouse macrophage cells, RAW264.7 (for control) and ELAM9 (which express an NF‐κB inducible GFP [green fluorescent protein] reporter)Citation24, were maintained on bacteriological plates (Sterilin Limited) in complete RPMI at 37 °C with 5% CO2. These cells were plated at 2.5 x 10⁵ cells/well (25-well Sterilin plate) using a culture volume of 500 μL and incubated overnight. Cells were then treated with o-vanillin or its analogues (Sigma-Aldrich). After incubating for an hour, the cells were treated with TLR ligands and incubated for 5–6 h. The cells were then harvested in 1 mM EDTA and 0.1% sodium azide in PBS. GFP expression was quantified using a BD Accuri C6 flow cytometer (BD Biosciences). The cell population was gated to remove debris, cell doublets and dead cells prior to analysis of mean GFP levels (Supplemental Figure S2). Concomitantly, 1.25 x 10⁵ cells/well were plated and treated as described above but incubated overnight to analyse cell viability by PI staining.
Culture and treatment of BMMs
C57BL/6 mice were purchased from the Animal Resources Centre (Canning Vale, Australia) and MAL-knockout (MAL-KO) mice generated on a C57BL/6 background Citation21 were kindly provided by Ashley Mansell and Paul Hertzog (Hudson Institute of Medical Research, Clayton, Australia). Bone marrow was collected from C57BL/6 and MAL-KO mice under approval from the University of Queensland Animal Ethics Committee. Bone marrow-derived macrophages were differentiated in CSF-1 for 7–10 days as previously described Citation30.
For IL-6 release and PI plate assays, BMMs were plated at 100,000 cells per well in black-walled 96-well μ-plates (ibidi) using complete phenol-red free RPMI-1640. The final volume in each well after all treatments were added was 200 μL. After incubation with TLR ligands, the plate was centrifuged at 500 x g for 5 min and 150 μL of medium was collected. ELISA for IL-6 was performed using the Mouse IL-6 Duoset ELISA kit (DY406. R&D Systems) as per the manufacturer’s instructions. Samples were diluted 1:10 prior to assay.
Propidium iodide staining-based cell viability assays
RAW264.7 and ELAM9 cells were harvested in 1 mM EDTA and 0.1% sodium azide in PBS after overnight treatment. PI was then added to the samples (final concentration of 2 μg/mL) and cells kept on ice. Subsequent PI staining was assessed using a BD Accuri C6 flow cytometer (BD Biosciences) gated as described (Supplemental Figure S2).
For BMMs, after the removal of medium for ELISA assay, PI was added to the remaining 50 μL in each well to give 2 μg/mL final concentration. Cells in detergent-permeabilised control wells were treated with digitonin at 100 μM final concentration to indicate total cell number. The plate was incubated at room temperature for 15 min before fluorescence readings were taken on a CLARIOstar plate reader using 530 nm excitation and 645 nm emission filters.
HEK293 cell-based assays of human TLR signalling
Human TLR signalling assays were performed as described Citation31 in transiently transfected fluorescent HEK293 reporter cell lines. Analysis of TLR4 and MAL signalling used the HEK-TLR4-mScarlet cell line which expresses TLR4, MD-2, and CD14 and has an integrated mScarlet-i reporter gene under the control of an NF-κB-driven promoter Citation31. For analysis of spontaneous MAL signalling, these cells were plated at 40,000 cells/well in 100 μl of complete DMEM without antibiotics and cultured overnight. For transfection, 50 ng of pEF6-hMAL-mEGFP (monomeric enhanced GFP) construct or empty vector was used with 0.4 μl of Lipofectamine 2000. At 4-h post-transfection, o-vanillin was added to cells and incubated for 16 h before analysis. o-Vanillin was in DMSO and gave 0.1% final concentration of DMSO. For the TLR4 signalling assay, the cells were plated at 60,000 cells/well in complete DMEM and incubated for 24 h. The cells were pre-treated with o-vanillin for 1 h and stimulated with or without 100 ng/ml of LPS. After 16-h incubation, the cells were analysed by flow cytometry. Analysis of TLR2 signalling used the HEK-ZsGreen cell line which expresses CD14, TLR1 and TLR6 and has an integrated ZsGreen reporter gene under the control of an NF-κB-driven promoter. The cells were plated at 60,000 cells/well in a 96-well plate in 100 μl of complete DMEM without antibiotics and transfected approximately 6 h later with 100 ng/well of pEF6-hTLR2-mScarlet-I and 0.4 μl of Lipofectamine 2000. After incubation overnight, medium was then replaced with fresh complete DMEM medium. Approximately 5 h later, the cells were pre-treated with o-vanillin for 1 h before stimulation overnight with either 100 ng/ml of Pam2CSK4, 1 μg/ml of Pam3CSK4 or no stimulus. The cells were harvested in PBS for flow cytometry. Samples were run on a Cytoflex S flow cytometer (Beckman Coulter). ZsGreen and mEGFP fluorescent parameters were detected at Ex/Em 488/525 nm, and mScarlet-I at 561/585 nm.
Results
Resonance assignments and solution structure of the wild-type MAL TIR domain
Due to difficulties with performing lengthy NMR experiments with the WT TIR domain of MAL, we have previously determined the solution structure of the C116A mutant of MAL (MALTIR-C116A; PDB ID: 2NDH,Citation17). We have now identified conditions that allow experiments with the WT human protein (MALTIR) by NMR. MALTIR tends to form insoluble assemblies rapidly at room temperature, especially at high protein and salt concentrations Citation18. However, under optimised conditions of 10 mM NaCl, 10 mM HEPES, pH 7.5, MALTIR at ∼106 µM concentration remains soluble and monomeric for ∼48 h at 20 °C, enabling structural NMR studies. In some cases, the protein precipitated between the steps of data acquisition; due to higher-order assembly formationCitation18; such precipitate could be re-solubilised by incubation on ice for 1–2 h, and NMR data acquisition resumedCitation32. For structure calculations, we used the solution structure of MALTIR-C116A as an initial guideCitation17. The better quality of the NMR spectra for MALTIR and the information from the MALTIR-C116A structure helped us to carry out a more complete resonance assignment of 13C-15N-labelled MALTIR (89% and 72% of all atoms were assigned for MALTIR and MALTIR-C116A, respectively). The unassigned atoms (11% of all atoms) are mostly in the flexible regions of the protein. After structure calculation, the final models of MALTIR yielded an average heavy-atom RMSD (root mean square deviation) of 1.17 ± 0.13 Å. The NMR structure statistics are shown in Supplemental Table S1.
TIR domains have a canonical flavodoxin-like fold, consisting of a five-stranded parallel β-sheet (strands βA–βE) surrounded by five α-helices (αA–αE) that are connected by flexible loops Citation33. The MALTIR structure shows a characteristic TIR-domain fold (). The seven cysteine residues of MALTIR are > 8 Å apart from each other and do not form disulfide bonds, consistent with a reduced state of the protein. The chemical shifts of the Cβ atoms of cysteine residues are < 32 ppm, except for C116, further consistent with the reduced form of MALTIR. The Cβ chemical shift for C116 is 33.4 ppm, but it is also most likely in a reduced state, based on the ground rules for deducing the redox state of cysteines Citation34. The MALTIR resonance assignments and structure enable us to use NMR to characterise the binding site of small-molecule inhibitors on the WT protein.
Figure 1. Solution NMR structure of MALTIR. (A) MALTIR structure demonstrates a typical TIR-domain fold with parallel β-strands surrounded by α-helices, as labelled (α-helices, β-strands and loops are coloured in cyan, magenta and salmon, respectively). (B) Superposition of the solution NMR structures of MALTIR (this work; PDB ID: 8JZM) and MALTIR-C116A (PDB ID: 2NDH, top panel), X-ray crystal structure (PDB ID: 2Y92, middle panel) and a monomer of MALTIR higher-order assembly cryo-EM structure (PDB ID: 5UZB, bottom panel). The inset shows the corresponding colours. The orientation of the superpositions is the same as panel A. In this orientation, the stable (e.g., αA, αE and βA) and disordered (e.g., part of αB, αC and αC′) segments of MALTIR are broadly located on the left and right side of the molecule, respectively.
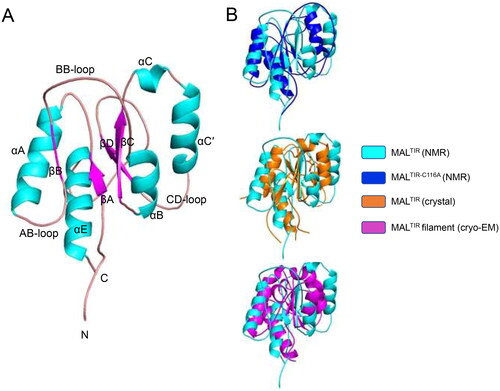
The structure of MALTIR shows notable differences from the disulfide-bonded MALTIR crystal structure, the MALTIR-C116A solution structure and the higher-order MALTIR assembly structure (). Residues 113–120 and 131–137 include βB and αB, respectively, where there is a genuine difference between the MALTIR and MALTIR-C116A structures. The mutation (C116A) may cause these structural differences, which is also reflected by high chemical shift differences around this region (Supplemental Figure S3). These differences are also likely due to the presence of highly disordered flanking regions (residues 108–112 and 120–135, containing AB- and BB-loops, respectively). Although helix αB (residues 133–139) is absent in the MALTIR crystal structures Citation13–16 and poorly resolved in the MALTIR-C116A structureCitation17, this helix is well-defined in the new MALTIR structure. Residues 141–147 (the region around βC), in the core of the protein, align well between MALTIR and MALTIR-C116A structures. However, residues 147–166 (the region containing αC-αC′) show major structural differences. Compared to MALTIR, αC′ stacks well with αB in the MALTIR-C116A structure. Because αC′ is attached to βD via a disordered CD-loop, it is possible that the helix samples both positions and is poorly resolved in either structure. Residues 171–177 (the region around βD) align between structures, but some differences around the start of that β-strand may also reflect high disorder in this region. Residues 180–200 cover a long loop where αD is poorly resolved in both solution structures and can only be observed in the MALTIR crystal and higher-order assembly structures. A disordered segment (residues 197–200) before the ordered helix may explain the structural differences in this region. Residues 205–219, which include αE, align well with MALTIR-C116A solution and MALTIR crystal and higher-order cryo-EM structures.
Overall, major differences are observed at one face of MALTIR, corresponding to residues 115–135 (βB-αB), 150–175 (αC-CD loop) and 180–203 (DD loop-EE loop). This side of the protein contains all the segments predicted to be poorly ordered. Interestingly, this is the region that forms the lateral interface between the strands in the MAL two stranded filament structure. The other side of the protein comprises two helices (αA and αE) and the central β-strands (βA, βC and βD), which are much more stable and align well with other reported MALTIR structures.
MALTIR filament formation is inhibited by o-vanillin and its analogues
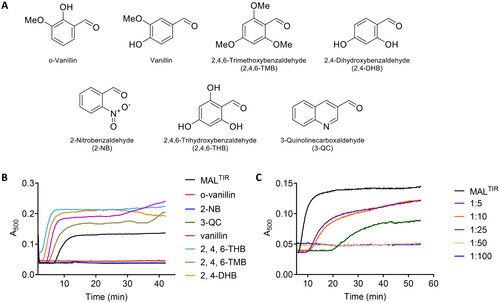
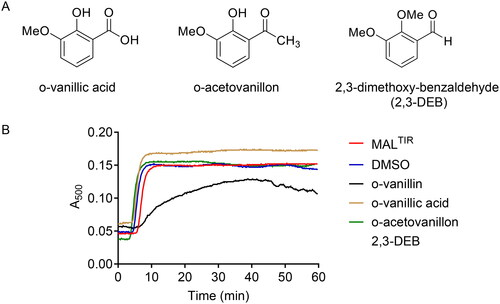
A recent study identified o-vanillin as an inhibitor of TLR2 signalling Citation23, but its mechanism of action has not been characterised. We hypothesised that the compound may target MAL. We therefore first tested the effect of o-vanillin and six of its analogues () on MALTIR assembly formation in vitro. Because filamentous assemblies of MALTIR precipitate, we can follow assembly formation with a simple turbidity assay, measuring absorbance at a wavelength of 500 nmCitation18. Among the seven compounds tested, o-vanillin, 2-NB and 3-QC inhibited MALTIR filament formation in a concentration-dependent manner (). The other tested compounds stimulated filament formation.
Figure 2. Turbidity assays of MALTIR in the presence of o-vanillin and its analogues. (A) o-Vanillin and its analogues. (B) MALTIR polymerisation (black line) was followed by measuring absorbance at 500 nm as a function of time with incubation at 30 °C. MALTIR at ∼87.5 µM was incubated with or without o-vanillin and its analogues at a MALTIR: compound (molar ratio) of 1:50. A representative of two independent experiments is shown. (C) o-Vanillin inhibits MALTIR filament formation in a concentration-dependent manner. MALTIR (∼90 µM) was incubated with the indicated MALTIR: o-vanillin molar ratios and turbidity analysed as in panel B. The result is typical of two independent experiments.
HSQC titration demonstrates that o-vanillin binds MALTIR
NMR resonance assignments allowed us to use 1H-15N-HSQC experiments to investigate the interaction of o-vanillin with MALTIR. We carried out a concentration-dependent titration with o-vanillin. The compound showed slow exchange, where the signal intensities of the interacting residues changed as a function of increasing ligand concentration. At the 1:25 molar ratio (equivalent to o-vanillin concentration of 2.5 mM), the amide cross-peaks of MALTIR in the ligand-free state disappeared, whereas those associated with the bound state emerged; therefore, this condition appears to saturate o-vanillin binding sites (, inset).
Figure 3. HSQC analysis of the concentration-dependent titration of o-vanillin. (A) The overlay of a section of the 1H-15N-HSQC spectrum of MALTIR (black) at different protein: ligand molar ratios between 1:1 (red) and 1:25 (blue). Seven different protein:ligand molar ratios (1:1, 1:2, 1:5, 1:7.5, 1:10, 1:20 and 1:25; MALTIR concentration was ∼106 µM) were tested; for simplicity, only the extreme titration points are presented. Important residues are labelled, with arrows showing the directions in which new peaks appear for each resonance. The inset shows an enlarged view of an example of slow exchange for S113. (B) Chemical-shift changes of MALTIR residues in the presence of o-vanillin (molar ratio 1:25). The dotted line represents the average chemical-shift change for these residues.
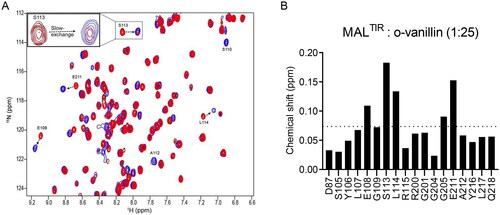
Interestingly, while the resonances for two residues (S110 and A112) were not discernible in the ligand-free protein spectrum (presumably they are located in a flexible loop and disordered), they were observed in the presence of o-vanillin, as confirmed by the CBCACONH spectrum recorded at the molar ratio of 1:25 (); we assume that o-vanillin leads to the ordering of the corresponding loop.
We analysed chemical-shift changes to obtain a map of the interacting residues. Out of 20 perturbed residues, five residues had greater than average chemical-shift changes (>0.074 ppm; ).
o-Vanillin forms a covalent interaction with MALTIR K210
We further analysed MALTIR:o-vanillin interactions using an isotope-filtered 1H–1H NOE experiment. After comparing this filtered 2D NOESY spectrum with the 2D projection (1H–13C) of the 3D-13C-HSQC-NOESY, a shifted cross-peak was identified as HɛCɛ of K210 (). Further analysis of the 3D-13C-HSQC-NOESY for K210 HɛCɛ indeed showed that the peak intensities were reduced in the presence of the ligand (). The shifted NOESY strip also showed cross-peaks for K210 Hδ and Hγ, further supporting the interaction between K210 and o-vanillin. Lysines can form covalent Schiff-base adducts with aldehyde-containing molecules Citation35, and o-vanillin has been documented to form adducts with haemoglobin and porcine somatotropinCitation36,Citation37. We hypothesised that this was occurring for K210 with o-vanillin. This is also consistent with the weak binding and slow exchange observed. The signal intensity for K158 HɛCɛ was not changed in the presence of o-vanillin, while the resonance for K84 HɛCɛ could not be assigned in the ligand-free spectra, as K84 is located in a disordered region at the N-terminus. Thus, among three lysines present in MALTIR, K210 is the most likely to be modified by o-vanillin. Upon modification, o-vanillin may cause de-shielding of the K210 HɛCɛ, so that the peak is shifted downfield in the presence of the ligand. The peak for the potential Schiff-base proton was identified in the 1H–1H NOESY spectrum, showing a direct NOE correlation between the Hɛ of K210 and the aldehyde proton of o-vanillin (i.e. the Schiff-base proton), indicating those two protons are close in space (). This evidence supports the hypothesis that K210 forms a Schiff base with o-vanillin.
Figure 4. Intermolecular interactions between MALTIR and o-vanillin. (A) The overlay of a section of 2D projected (1H–13C) spectrum of the 3D-13C-HSQC-NOESY (aliphatic region) that shows ligand-free protein (blue) and protein: ligand at 1:20 molar ratio (pink). In the presence of o-vanillin, the K210-HɛCɛ peak is shifted downfield, as indicated with the dotted arrow. (B) The overlay of the 3D-13C-HSQC-NOESY strips of K210-HɛCɛ that shows ligand-free protein (blue) and protein: ligand at 1:20 molar ratio (pink). The strip for 13C (42.18 ppm) corresponds to the ligand-free state (left), and the strip for 13C (53.52 ppm) corresponds to the shifted peak that appears in the presence of o-vanillin (right). (C) Isotope-filtered 1H–1H NOESY spectrum. The blue coloured positive peaks provide NOE correlations between ligand protons and all protons (ligand and protein) and are labelled in red. The light green-coloured negative peaks provide NOE correlations between ligand protons only and are labelled in black. (D) The overlay of a section of the 1H-15N-HSQC spectrum of MALTIR-K158A (green), at protein: ligand molar ratios 1:1 (red) and 1:20 (blue). Several residues of MALTIR-K158A show slow exchange in the presence of o-vanillin (analogous to MALTIR), with arrows indicating the directions in which new peaks appear for each resonance. The inset shows an enlarged view of slow exchange for S113. (E) The overlay of the 1H-15N-HSQC spectrum, recorded for ligand-free MALTIR-K210A and in the presence of o-vanillin (same protein: ligand molar ratios and colour scheme as in panel D). The residues are not perturbed by o-vanillin for this mutant; S113, the most perturbed residue for MALTIR and MALTIR-K158A, is labelled as an example.
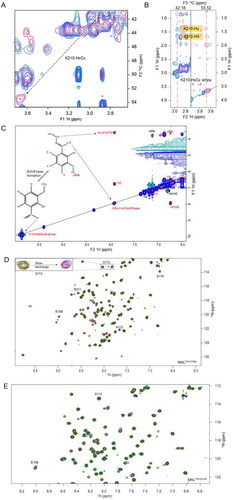
To further validate the observed interaction of o-vanillin with K210, HSQC titration of o-vanillin was carried out with the K158A and K210A mutants of MALTIR (a K84 mutant was not used, as this lysine is disordered in the WT protein). Similar to MALTIR, o-vanillin showed slow exchange with MALTIR-K158A, and caused the appearance of resonances for S110 and A112 (). By contrast, o-vanillin showed no perturbation of resonance in MALTIR-K210A ().
In addition to the close proximity of K210 Hɛ and the aldehyde proton of o-vanillin, the following evidence supports the conclusion that o-vanillin forms a covalent Schiff-base bond with MALTIR K210. The chemical shift of the aldehyde proton in o-vanillin 1H NMR spectra shifts from 10 ppm in the free form to 7.7 ppm in the complex, consistent with Schiff-base formation. The chemical shift of the K210 Cɛ in MALTIR also shifts for about 10 ppm in 13C NMR spectra, also consistent with chemical shifts of Cɛ at ∼50 ppm upon Schiff-base formation Citation38.
Schiff-base formation of o-vanillin with K210 of MALTIR results in conformational changes
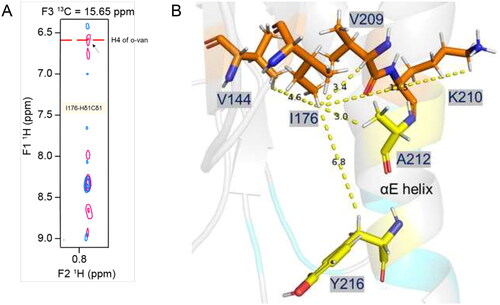
The 3D-13C-HSQC-NOESY spectrum recorded with o-vanillin was further compared with the same spectrum recorded for the ligand-free protein. As the o-vanillin protons have distinct chemical shifts, its NOE correlations with the MALTIR protons can easily be identified (; Supplemental Table S2). The analysis identified o-vanillin and MALTIR I176, V144 and V209 to be in close proximity. The residue I176 is in the core of MALTIR structure, close to V144 and V209, as well as A212 and Y216. Considering K210 is not located close to these residues in the ligand-free structure, the o-vanillin modification likely leads to conformational changes ().
Figure 5. Intermolecular NOE-based distance restraints for binding of o-vanillin. (A) The overlay of 3D-13C-HSQC-NOESY (for the aliphatic region) spectrum recorded for the ligand-free protein (blue) and with ligand at a 1:20 molar ratio (pink). The arrow indicates a new peak along the I176-Hδ1Cδ1 strip that arises in the presence of the ligand and aligns with a proton peak (H4) of o-vanillin in the isotope filtered 1H–1H NOESY spectrum, as labelled. (B) Stick-representation (PDB ID: 8JZM) showing the distance from I176-Hδ1 to V209-Hα, V144-Hγb, K210-Hɛ, A212 and Y216, which are 3.4, 4.6, 11.5, 3.0 and 6.8 Å apart, respectively. The patch-3 residues A212 and Y216 are in the proximity of I176-Hδ1, although their intermolecular NOEs are not defined. The distances from the I176-Hδ1, V209-Hα and V144-Hγb to K210-Hɛ suggest that the orientation of the K210 side-chain may change to bring these protons in proximity to accommodate an o-vanillin molecule.
Aldehyde and ortho-hydroxyl moieties are indispensable for the inhibitory activity by o-vanillin
To test the importance of the aldehyde group in o-vanillin, two analogues having the aldehyde group replaced by either a non-reactive carboxylic group (o-vanillic acid) or a less reactive acetyl group (o-acetovanillon), were tested in turbidity assays. To determine the role of the ortho-hydroxyl group, 2,3-DEB, having the hydroxyl group of o-vanillin replaced by a methoxy group, was also tested (). Along with o-vanillin, only 2,3-DEB modestly inhibited MALTIR filament formation in vitro (). We conclude that the combination of the aldehyde group and its ortho-hydroxyl moiety are required for the inhibitory activity of o-vanillin, providing further evidence that the activity of o-vanillin is due to Schiff-base formation with MAL K210.
Figure 6. The functional role of reactive groups in o-vanillin. (A) Analogues of o-vanillin used to test the role of aldehyde and hydroxyl groups. (B) Turbidity assays of MALTIR (103 µM) in the presence of o-vanillin and its less reactive analogues (protein: ligand = 1:20). Representative result of two independent experiments is shown. Some turbidity increase is observed in the presence of o-vanillin, although it is clearly inhibited compared to the protein-only sample.
Structural basis of the inhibition of MAL assembly by o-vanillin modification of K210
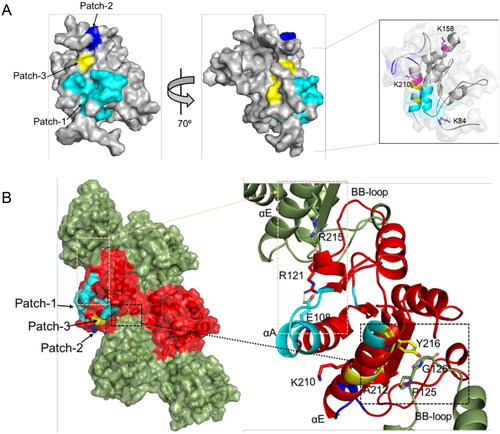
The residues for which the NMR signals are perturbed upon o-vanillin binding form three patches on the surface of MALTIR: patch-1 (residues 87, 105–110, 112–115 and 217–218, extending over the N-terminal region, αA, AB-loop, βB and αE); patch-2 (residues 200, 201, 204 and 205 in the EE-loop); and patch-3 (residues 211, 212 and 216 in the αE helix). Although these three patches are close to each other, considering the size of o-vanillin, they may come closer as a result of conformational changes caused by o-vanillin binding, as suggested by our data (e.g., the appearance of the resonances for S110 and A112 during the HSQC titration; , Supplemental Figure S4). The modified residue K210 is adjacent to patch-3, whereas the other lysines, K84 and K158 are further away from the interacting patches (, inset). The intra-strand interface in the MAL filament includes part of the αE helix in the EE surface, which contacts the BB-loop on the interacting subunit Citation18. A212 in the αE helix forms contacts with the BB-loop residue P125; Y216 in the αE helix is less than 4 Å away from the BB-loop residues P125 and G126 (). P125 and G126 play important roles in the intra-strand interface and are conserved among the human TIR domainsCitation18; therefore, the o-vanillin-interacting residues A212 and Y216 also affect the intra-strand interaction. Another residue implicated in o-vanillin binding, E108, is in the αA helix, and forms a salt-bridge with R121, which in turn forms a hydrogen bond with R215 of another intra-strand subunitCitation18 (). The E108A mutation disrupts MALTIR filament formation in vitro Citation18. The E108A and R121A mutations also reduce NF-κB signalling in HEK293T cellsCitation14, which highlights the importance of the salt bridge between these two residues. On the other hand, another residue altered by o-vanillin binding is R200, which is in the interface between protofilaments forming the hollow tube made from 12 protofilaments in the cryo-EM structure of MALTIR; only the interactions within protofilaments have been proposed to be biologically relevantCitation18. R200A mutation also disrupts MALTIR filament formation in vitroCitation18 (Supplemental Table S3).
Figure 7. MALTIR residues perturbed by o-vanillin in the HSQC titration. (A) The corresponding residues are mapped onto the surface representation of MALTIR (PDB ID: 8JZM), highlighting residues 87, 105–110, 112–115 and 217–218 in cyan (patch-1); residues 200, 201, 204 and 205 in blue (patch-2); and residues 211, 212 and 216 in yellow (patch-3). The views are shown by a rotation of 700 around the y-axis. The inset shows 80% transparent surface representation and the position of three lysine residues (in stick representation and labelled) relative to the interacting patches (the orientation is different from the other two views in this panel, to highlight the positions of the three lysines). (B) The corresponding residues mapped onto the cryo-EM structure of the MALTIR filamentous assembly (PDB: 5UZB). The surface representation shows alternative subunits as green and red, respectively, along each strand. The patches 1, 2 and 3 are mapped (in the same colour scheme as in panel A) onto one of the red subunits. The black and orange boxes indicate the regions of the intra-strand interface that are affected by o-vanillin (left). Within the corresponding boxes, the perturbed residues, their interaction partners and the reactive K210 are shown in stick representation and labelled (right).
o-Vanillin inhibits TLR2/1 but not TLR2/6 or TLR4 signalling in murine macrophages
Our data indicate that o-vanillin can inhibit MALTIR filament formation in vitro, by interacting covalently with K210 of the protein. It has previously been shown that o-vanillin inhibits TLR2/1 signalling, but not TLR2/6 or TLR4 responses, in murine cells Citation23. We examined the inhibitory action of o-vanillin in ELAM9 cells, a RAW264.7 murine macrophage cell line stably transfected with an NF-κB-dependent ELAM promoter, driving a GFP reporter gene Citation24. The effects were assessed by flow cytometry (gating strategy shown in Supplemental Figure S2). Treatment with the TLR2/1 ligand Pam3CSK4 activated the ELAM promoter, and this activity was inhibited by o-vanillin in a dose-dependent manner (). A high dose of 250 μM o-vanillin caused significant cell death in the absence of TLR ligands (). This dose was equally toxic when combined with Pam3CSK4; however, LPS co-treatment protected against cell death. This may be because TLR-mediated NF-κB signalling mediates pro-survival effects Citation39. Given that TLR4 is not inhibited by o-vanillin (), TLR4 signalling may protect from death, whereas TLR2/1 is inhibited and therefore cannot protect.
Figure 8. o-Vanillin inhibits TLR2/1 but not TLR2/6 or TLR4 signalling in a murine macrophage cell line. (A) RAW264.7 cells with an NF-κB-responsive GFP reporter gene (ELAM9) were pre-treated with o-vanillin for 1 h, and then treated with or without 10 ng/mL Pam3CSK4 for 6 h. GFP fluorescence was detected by flow cytometry. Mean fluorescence intensity (MFI) was recorded and the MFI of untreated RAW264.7 cells was subtracted to remove background cellular auto-fluorescence. Results were normalised to Pam3CSK4 treatment with no o-vanillin. (B) ELAM9 cells were incubated overnight in the presence of different concentrations of o-vanillin alone or combined with 10 ng/mL LPS or Pam3CSK4. The cells were harvested and stained with propidium iodide (PI) and the percentage of PI positive cells (% cell death) was determined by flow cytometry. (C) ELAM9 cells were pre-treated for 1 h with or without 62.5 μM o-vanillin prior to the addition of 10 ng/mL LPS, Pam2CSK4 (P2C), Pam3CSK4 (P3C) or medium alone (UT). After a further 6-h incubation the MFI was measured as per panel A. Results were normalised to LPS-treated cells without o-vanillin. For panels A to C, bars represent the mean of two independent experiments, with error bars showing the range. (D) The inhibitory activity of o-vanillin and its analogues in ELAM9 cells. After 1 h of pre-treatment with or without 62.5 µM compounds, 10 ng/mL LPS, Pam3CSK4 (P3C) or medium (UT and compound alone/DMSO control) were added. After 5–6 h of incubation, MFI was measured as per panel A. Bars depict the mean for duplicate treatments with the range indicated. These results are representative of a second independent experiment in which o-vanillin analogues were used at 125 µM.
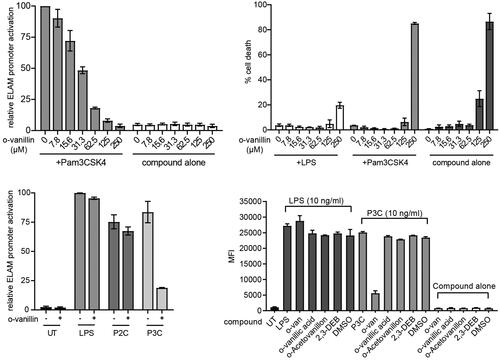
At the non-toxic concentration of 62.5 μM, o-vanillin inhibited most of the TLR2/1 ligand Pam3CSK4-induced activity (), but did not greatly affect the response to TLR4 ligand LPS and the TLR2/6 ligand Pam2CSK4. These results are consistent with the findings of Mistry et al. Citation23. Further testing showed that o-vanillin modestly inhibited TLR7 and TLR9 responses (Supplemental Figure S5A). None of the analogues tested in tubidity assays () inhibited Pam3CSK4-induced TLR2/1 signalling at 62.5 µM or 125 µM concentrations, although o-vanillin displayed its inhibitory activity (), confirming the essential role of the o-vanillin aldehyde, and the ortho-hydroxyl group for reactivity.
Inhibition of mouse TLR2/1 signalling by o-vanillin does not involve MAL
Our in vitro data suggest that o-vanillin could target the TIR domain of MAL in cells. To investigate whether MAL is a possible target of o-vanillin during inhibition of TLR2 signalling, we compared the effect of o-vanillin on TLR signalling responses in bone marrow-derived macrophages (BMMs) from WT and MAL-KO mice. Although early work suggested a very strong dependence of TLR2 signalling on MALCitation40,Citation41, more recent work has shown that mouse TLR2 only requires MAL at low ligand concentrationsCitation42,Citation43. This discrepancy in reports may be due to recent improved purity of reagents and exclusion of LPS. Prior to testing the role of MAL, a dose titration of o-vanillin in combination with TLR2/1, TLR2/6 and TLR4 ligands was conducted on WT BMMs (Supplemental Figure S5B). At the highest concentration of 250 μM o-vanillin, all tested TLR responses were inhibited. This was not due to cell death (Supplemental Figure S5C), despite this concentration being toxic for ELAM9 cells (). The result could indicate a second effect of the compound at high concentrations. However, consistent with the specific inhibition of TLR2/1 responses on ELAM9 cells, the lower dose of 83.3 μM o-vanillin inhibited the TLR2/1 response and had minimal effect on TLR2/6 and TLR4 signalling. This dose was selected for tests on WT and MAL-KO BMMs.
To compare WT and MAL-KO BMMs, cells were pre-treated with o-vanillin prior to the addition of TLR ligands at a range of doses and assessed for release of interleukin 6 (IL-6). If o-vanillin inhibition primarily involved MAL, it would be expected that MAL-dependent TLR2/1 responses to low doses of ligand would be inhibited, while MAL-independent TLR2 responses, which can be seen in MAL-KO cells at higher ligand dosesCitation43, would be unchanged. We observed that o-vanillin inhibited IL-6 release from WT BMMs in response to a low dose of Pam3CSK4, with partial inhibition also seen at high doses. However, the IL-6 release from MAL-KO BMMs was completely inhibited across all ligand concentrations (, Supplemental Figure S6A). At the lowest doses of TLR2/6 ligand Pam2CSK4, where the response is MAL-dependent, o-vanillin actually enhanced the release of IL-6 from WT BMMs (, Supplemental Figure S6B). Again, TLR2/6-mediated IL-6 release from MAL-KO cells was completely inhibited. IL-6 release from BMMs in response to treatment with LPS was almost completely MAL-dependent, as expected, and o-vanillin treatment resulted in a modest reduction in the TLR4 response of WT cells ( and Supplemental Figure S6C). These results were not influenced by toxicity, as no differences in cell death were seen across the treatments (Supplemental Figure S7). Our findings from WT BMMs largely support previous reports that o-vanillin inhibits TLR2/1 signalling. The results from the MAL-KO cells do not support a model of o-vanillin-mediated disruption of signalling through the interaction with MAL. Rather, in the absence of MAL, o-vanillin was able to completely abolish both TLR2/1 and TLR2/6 signalling. This would be more consistent with o-vanillin causing interference with the interaction between TLR2 complexes and MyD88, which must happen directly in the absence of MAL.
Figure 9. Inhibition of TLR2 signalling by o-vanillin in a MAL-independent fashion. (A-C) Inhibition of TLR signalling in mouse macrophages by o-vanillin does not depend on MAL. BMMs from WT or MAL-KO mice were pre-treated with 80 μM o-vanillin or 0.04% DMSO (vehicle control) for 1 h before a 6 h incubation with TLR ligands Pam3CSK4 (A), Pam2CSK4 (B) or LPS (C) at the indicated concentrations. Following incubation, medium was collected and assayed for IL-6 concentration by ELISA. Bars and error bars represent the mean and range of duplicate wells from a single representative experiment. The results of an independent replicate experiment are presented in Supplemental Figure S4 and display the same trends but are not combined with these results due to variation in absolute values. (D-G) o-Vanillin inhibits human TLR2 signalling but not the response to TLR4 or MAL overexpression. (D) Human MAL C-terminally tagged with GFP was overexpressed in HEK cells with an NF-κB-driven mScarlet-I reporter gene, in the presence or absence of o-vanillin and analysed by flow cytometry. The single cell population showing high MAL-GFP expression was selected for analysis of spontaneous NF-κB activity (Supplemental Figure S8). Results were normalised to vehicle treated control. Untreated (UT) sample was transfected with an empty vector, and assessed for the level of basal NF-κB activity. Bars and error bars represent the mean and range from 2 independent experiments. (E) TLR4 signalling was assessed in a HEK293 cell line expressing all components of the signalling pathway with an NF-κB-driven mScarlet-I reporter gene. Cells were pre-treated with o-vanillin prior to treatment with 100 ng/ml LPS, and mScarlet-I expression analysed on the whole live single cell population. Results were normalised to LPS-treated cells without o-vanillin and presented as the mean and range from 2 independent replicate experiments. (F-G) HEK293 cells expressing CD14 and with an NF-κB-driven ZsGreen reporter were transfected with human TLR2 C-terminally tagged with mScarlet-I. They were pre-treated with or without o-vanillin before stimulation with 1 μg/ml Pam3CSK4 (F) or 100 ng/ml Pam2CSK4 (G). Cells expressing low to moderate TLR2-mScarlet were selected for analysis of ZsGreen reporter expression. Results were normalised to ligand-stimulated cells without o-vanillin. Bars show the mean and individual results from 3 independent experiments are indicated.
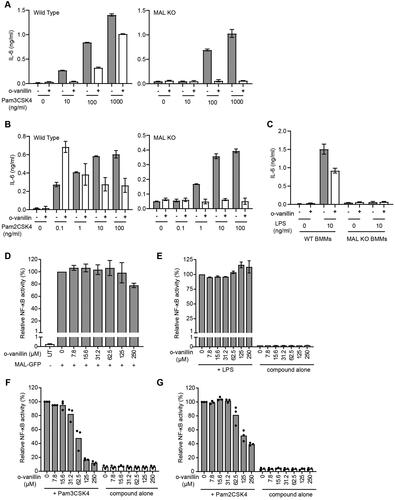
o-Vanillin inhibits TLR2 but not TLR4 or MAL-driven signalling in human cells
We demonstrated that human MAL is modified by o-vanillin, so it was important to check the inhibition of signalling in human cells. Unlike mouse, we have found that human TLR2 signalling is entirely dependent upon MAL (P. Mudai, unpublished) and so we cannot assess a role for MAL in the same way as in mouse. We examined TLR2 and TLR4 ligand-dependent signalling, as well as spontaneous signalling in response to over-expressed MAL, using HEK293 NF-κB-reporter cell lines expressing all relevant TLR signalling proteinsCitation31. The spontaneous MAL signalling was inhibited by o-vanillin only at the highest concentration and this was not due to effects on MAL expression ( and Supplemental Figure S8). TLR4 response to LPS was unaffected by o-vanillin, even though TLR4 signalling is presumed to require some degree of MAL oligomerisation (). TLR4 may stabilise MAL assembly despite the presence of some o-vanillin modification. Similar to the mouse proteins, there was effective inhibition of both TLR2/1 and TLR2/6 signalling starting from 62.5 µM (), consistent with results of Mistry et al.Citation23.
In summary, despite the covalent binding of o-vanillin to a reactive lysine in MAL in vitro, this is unlikely to account for inhibition of TLR2 signalling, because neither MAL-dependent TLR4 signalling nor spontaneous MAL signalling are affected by o-vanillin. The similarity of TLR4 and TLR2 pathways suggests modification of TLR2/1/6 proteins is a likely explanation, rather than effects on downstream signalling, which is shared with TLR4.
Discussion
Therapies targeting TLRs and downstream adaptors have the potential to reduce inflammation associated with a range of disorders from chronic inflammatory diseases to cancer. Only a few small-molecule inhibitors have been reported to target the downstream adaptors in TLR signalling pathways. The small molecule 4210 is an inhibitor of MyD88 that demonstrated therapeutic efficacy against toxic shock-induced death upon exposure to toxins from Gram-positive and Gram-negative pathogens (Staphylococcal enterotoxin SEB and E. coli LPS, respectively) in mouse models Citation44. ST2825 is a synthetic peptidomimetic compound that has been found to inhibit MyD88-dependent inflammatory signalling pathways and could have therapeutic potential for conditions such as systemic lupus erythematosus, traumatic brain injury and diffuse large B-cell lymphomaCitation45–48. Methyl-piperidinio-pyrazole (MPP) has been reported to target the MyD88 TIR domain and an MPP analogue provided protection against TLR4-dependent inflammation in miceCitation49. A number of cell-permeable decoy peptide inhibitors have also been developed that target TIR domain-mediated protein interactions in TLR signallingCitation50. All these studies provide proof-of-principle that TIR-domain containing adaptors could be used as alternative drug targets to modulate the TLR signalosomes.
To our knowledge, no small molecule inhibitors targeting MALTIR have been reported. To facilitate therapeutic development targeting this adaptor protein, we aimed to establish a pipeline involving in vitro signalling assembly formation assays and NMR spectroscopy, in combination with cellular assays. X-ray crystallography has limitations in this case, because all reported crystal structures of MALTIR feature an oxidised form of the protein with disulfide bonds, showing important differences from active reduced structuresCitation17,Citation18. Characterisation of structure-activity relationships by NMR has been employed successfully for numerous drug-discovery campaigns; in a classic example, in the discovery of high-affinity ligands against the FK506 binding protein Citation51. To this end, we have assigned the spectra and determined the 3D solution structure of the WT TIR domain of MAL, and tested the pipeline with o-vanillin, reported as an inhibitor of TLR2/1 signallingCitation23.
We previously reported the NMR structure of the TIR domain of the C116A mutant of MAL, because of difficulties with performing lengthy NMR experiments with the WT proteinCitation17. We have now identified conditions that allow NMR experiments with WT MALTIR. The structure shows substantial differences from the reported MALTIR structures. In the WT MALTIR solution structure, helix αB is resolved well, in contrast to MALTIR crystal and MALTIR-C116A NMR structures, and the position of αC′ appears to be able to sample different conformations in the space between αB and the long CD-loop. The structure shows two sides, corresponding to a well-resolved and therefore stable surface, and a poorly resolved and therefore more disordered surface; the latter undergoes some form of remodelling and stabilisation during signalosome assembly formation, as evident in cryo-EM structures. The plasticity of the disordered surface may allow interaction with multiple different partners. The MALTIR higher-order signalosome corresponds to a two-stranded assembly of TIR domains held together by head-to-tail (intra-strand) interfaces and lateral (inter-strand) interfaces Citation3,Citation18. Two groups of residues in the disordered surface, 155–166 (αC’) and 180–200 (DD-loop to βE), contribute to the inter-strand and intra-strand interfaces of MALTIR two-stranded assembly, respectively. The observed plasticity is consistent with the concept of SCAFCitation19, where MALTIR monomers undergo conformational changes, especially in the disordered surfaces, which facilitates the cooperative formation of large signalling complexesCitation20.
We show that in vitro, o-vanillin binds covalently to the K210 residue of MALTIR. Notably, the binding inhibits the formation of a filamentous assembly of MALTIR in vitro. The MAL filament consists of 12 two-stranded protofilaments arranged into a hollow cylinder Citation18. K210 does not fall directly within any of the interfaces making up the filament - neither the head-to-tail intra-strand interface, the inter-strand interface within the two-stranded protofilament, nor the interface between protofilaments that leads to the assembly of a large cylindrical filamentCitation18. However, conformational changes induced by o-vanillin binding may affect either the intra-strand interface () or the interaction between protofilaments.
Aldehyde groups in aromatic rings have been reported to form Schiff bases with the lysines of interacting protein targetsCitation35, consistent with the observed modification of MAL K210 by o-vanillin. In o-vanillin, the carbonyl oxygen and the proximal hydroxyl hydrogen are likely to form an intramolecular hydrogen bond (Supplemental Figure S9), which may facilitate its Schiff-base formation with the electron-rich ε-amino group of selected lysine residues. This may explain why the aldehyde group and its ortho-hydroxyl group are indispensable for potent inhibitory activity of o-vanillin. The reason for some lysine residues, such as MAL K210, rather than others, being reactive with o-vanillin presumably depends on the environment of the residue within the protein. Notably, K210 was the only lysine in MAL found to chemically cross-link with the vaccinia virus protein A46 that also targets the intra-strand interface to dislodge MALTIR signalosomes Citation52. K210 is conserved across the mammalian MALTIR orthologues (Supplemental Figure S10), but is not conserved in other human TIR-domainsCitation53. Given this conservation, it is possible that its reactivity plays a role in regulation by post-translational modifications. Lysines with enhanced reactivity have been suggested to locate primarily at the functional sites of proteinsCitation54, and it is possible that K210 modification may regulate assembly formation in vivo.
The complex effects in our cellular assays of o-vanillin at different concentrations, and also at different TLR ligand concentrations, suggest that o-vanillin is not acting on a single target. There was much more potent inhibition of TLR2 responses in mouse MAL-KO cells than in WT cells, suggesting that o-vanillin may inhibit the direct interaction between MyD88 and TLR2 complexes, which permits signalling in the absence of MAL (). Despite the demonstrated interaction of o-vanillin with MAL in vitro, it may not play a role in inhibiting MAL at the doses used in vivo. Neither MAL-dependent TLR4 signalling nor spontaneous signalling from MAL were significantly inhibited by o-vanillin. In human cells, TLR2 and TLR4 both signal through a common MAL/MyD88-dependent pathway, leaving the most likely target for o-vanillin inhibition to be TLR2 itself or its binding partners TLR1 and TLR6. Mistry et al. originally aimed to design inhibitors de novo predicted to bind the BB-loop region of TLR2Citation23. They identified compound C29 that inhibited TLR2 responses, but later showed that C29 was hydrolysed to o-vanillin, which was the active agent. This decreases the likelihood that this small molecule actually binds at the originally modelled position in TLR2.
In conclusion, our data confirm that o-vanillin acts on the TLR2 pathway, but the demonstration that it can modify reactive lysine residues makes covalent interaction with TLR2 a likely mode of action, rather than a specific non-covalent interaction with the TLR2 BB-loop region, as initially proposedCitation23. MAL K210 is not conserved in TLR2 and a reactive lysine remains to be established. It may be difficult to achieve the specificity required for drugs using compounds with reactive groups such as aldehydes. However, the NMR pipeline we established here may be used to screen for new potential therapeutics targeting the MAL adaptor. The reactivity of K210 in MAL also suggests it may be a target of post-translational modifications in cells, such as acetylation and ubiquitination.
Authors’ contributions
Conception and design: M.H.R., S.J.T., M.J.M., J.D.N., X.J., P.R.V., P.M., A.H., I.V., T.H., A.A.B.R., B.D., T.V., M.M., K.J.S., B.K.; analysis and interpretation of the data: M.H.R., S.J.T., M.J.M., H.K., I.V., J.D.N., M.M., K.J.S., B.K.; the drafting of the paper: M.H.R., S.J.T., M.J.M., M.M., K.J.S., B.K.; revising it critically for intellectual content: all authors; final approval of the version to be published: all authors. All authors agree to be accountable for all aspects of the work.
Supplemental Material
Download PDF (1.6 MB)Acknowledgements
We would like to thank Ashley Mansell and Paul Herzog (Hudson Institute of Medical Research, Clayton, Australia) for MAL-KO mice.
Disclosure statement
The authors report no conflicts of interest.
Data availability statement
The NMR structure and chemical shifts of MAL were deposited in the Protein Data Bank, with ID 8JZM, and the Biological Magnetic Resonance Bank, with accession number 36579, respectively.
Additional information
Funding
References
- Medzhitov R. Toll-like receptors and innate immunity. Nat Rev Immunol. 2001;1(2):1–15.
- Ve T, Gay NJ, Mansell A, Kobe B, Kellie S. Adaptors in Toll-like receptor signaling and their potential as therapeutic targets. Curr Drug Targets. 2012;13(11):1360–1374.
- Nimma S, Gu W, Maruta N, Li Y, Pan M, Saikot FK, Lim BYJ, McGuinness HY, Zaoti ZF, Li S, et al. Structural evolution of TIR-domain signalosomes. Front Immunol. 2021;12:784484.
- O’Neill LAJ, Bryant CE, Doyle SL. Therapeutic targeting of Toll-like receptors for infectious and inflammatory diseases and cancer. Pharmacol Rev. 2009;61(2):177–197.
- Gao W, Xiong Y, Li Q, Yang H. Inhibition of Toll-like receptor signaling as a promising therapy for inflammatory diseases: a journey from molecular to nano therapeutics. Front Physiol. 2017;8:508.
- Roger T, Froidevaux C, Le Roy D, Reymond MK, Chanson AL, Mauri D, Burns K, Riederer BM, Akira S, Calandra T. Protection from lethal Gram-negative bacterial sepsis by targeting Toll-like receptor 4. Proc Natl Acad Sci USA. 2009;106(7):2348–2352.
- Ding Y, Subramanian S, Montes VN, Goodspeed L, Wang S, Han C, Teresa AS, 3rd, Kim J, O’Brien KD, Chait A. Toll-like receptor 4 deficiency decreases atherosclerosis but does not protect against inflammation in obese low-density lipoprotein receptor-deficient mice. Arterioscler Thromb Vasc Biol. 2012;32(7):1596–1604.
- Cosgrove HA, Gingras S, Kim M, Bastacky S, Tilstra JS, Shlomchik MJ. B cell-intrinsic TLR7 expression drives severe lupus in TLR9-deficient mice. JCI Insight. 2023;8(16):e172219.
- Hennessy EJ, Parker AE, O’Neill LA. Targeting Toll-like receptors: emerging therapeutics? Nat Rev Drug Discov. 2010;9(4):293–307.
- Opal SM, Laterre PF, Francois B, LaRosa SP, Angus DC, Mira JP, Wittebole X, Dugernier T, Perrotin D, Tidswell M, et al. Effect of eritoran, an antagonist of MD2-TLR4, on mortality in patients with severe sepsis: the ACCESS randomized trial. JAMA. 2013;309(11):1154–1162.
- Rice TW, Wheeler AP, Bernard GR, Vincent JL, Angus DC, Aikawa N, Demeyer I, Sainati S, Amlot N, Cao C, et al. A randomized, double-blind, placebo-controlled trial of TAK-242 for the treatment of severe sepsis. Crit Care Med. 2010;38(8):1685–1694.
- Ngo HX, Garneau-Tsodikova S. What are the drugs of the future? MedChemComm. 2018;9(5):757–758.
- Valkov E, Stamp A, Dimaio F, Baker D, Verstak B, Roversi P, Kellie S, Sweet MJ, Mansell A, Gay NJ, et al. Crystal structure of Toll-like receptor adaptor MAL/TIRAP reveals the molecular basis for signal transduction and disease protection. Proc Natl Acad Sci U S A. 2011;108(36):14879–14884.
- Lin Z, Lu J, Zhou W, Shen Y. Structural insights into TIR domain specificity of the bridging adaptor Mal in TLR4 signaling. PLOS One. 2012;7(4):e34202–e34202.
- Snyder GA, Deredge D, Waldhuber A, Fresquez T, Wilkins DZ, Smith PT, Durr S, Cirl C, Jiang J, Jennings W, et al. Crystal structures of the Toll/interleukin-1 receptor (TIR) domains from the Brucella protein TcpB and host adaptor TIRAP reveal mechanisms of molecular mimicry. J Biol Chem. 2014;289(2):669–679.
- Woo JR, Kim S, Shoelson SE, Park S. X-ray crystallographic structure of TIR-domain from the human TIR-domain containing adaptor protein/MyD88-adaptor-like protein (TIRAP/MAL). B Korean Chem Soc. 2012;33(9):3091–3094.
- Hughes MM, Lavrencic P, Coll RC, Ve T, Ryan DG, Williams NC, Menon D, Mansell A, Board PG, Mobli M, et al. Solution structure of the TLR adaptor MAL/TIRAP reveals an intact BB loop and supports MAL Cys91 glutathionylation for signaling. Proc Natl Acad Sci U S A. 2017;114(32):E6480–E6489.
- Ve T, Vajjhala PR, Hedger A, Croll T, DiMaio F, Horsefield S, Yu X, Lavrencic P, Hassan Z, Morgan GP, et al. Structural basis of TIR-domain-assembly formation in MAL- and MyD88-dependent TLR4 signaling. Nat Struct Mol Biol. 2017;24(9):743–751.
- Vajjhala PR, Ve T, Bentham A, Stacey KJ, Kobe B. The molecular mechanisms of signaling by cooperative assembly formation in innate immunity pathways. Mol Immunol. 2017;86:23–37.
- Clabbers MTB, Holmes S, Muusse TW, Vajjhala PR, Thygesen SJ, Malde AK, Hunter DJB, Croll TI, Flueckiger L, Nanson JD, et al. MyD88 TIR domain higher-order assembly interactions revealed by microcrystal electron diffraction and serial femtosecond crystallography. Nat Commun. 2021;12(1):2578.
- Dowling JK, Tate MD, Rosli S, Bourke NM, Bitto N, Lauterbach MA, Cheung S, Ve T, Kobe B, Golenbock D, et al. The single nucleotide polymorphism Mal-D96N mice provide new insights into functionality of Mal in TLR immune responses. J Immunol. 2019;202(8):2384–2396.
- Piao W, Shirey KA, Ru LW, Lai W, Szmacinski H, Snyder GA, Sundberg EJ, Lakowicz JR, Vogel SN, Toshchakov VY. A decoy peptide that disrupts TIRAP recruitment to TLRs is protective in a murine model of influenza. Cell Rep. 2015;11(12):1941–1952.
- Mistry P, Laird MH, Schwarz RS, Greene S, Dyson T, Snyder GA, Xiao TS, Chauhan J, Fletcher S, Toshchakov VY, et al. Inhibition of TLR2 signaling by small molecule inhibitors targeting a pocket within the TLR2 TIR domain. Proc Natl Acad Sci U S A. 2015;112(17):5455–5460.
- Stacey KJ, Young GR, Clark F, Sester DP, Roberts TL, Naik S, Sweet MJ, Hume DA. The molecular basis for the lack of immunostimulatory activity of vertebrate DNA. J Immunol. 2003;170(7):3614–3620.
- Hill JM. NMR screening for rapid protein characterization in structural proteomics. Methods Mol Biol. 2008;426:437–446.
- Mobli M, Maciejewski MW, Gryk MR, Hoch JC. An automated tool for maximum entropy reconstruction of biomolecular NMR spectra. Nat Methods. 2007;4(6):467–468.
- Vranken WF, Boucher W, Stevens TJ, Fogh RH, Pajon A, Llinas M, Ulrich EL, Markley JL, Ionides J, Laue ED. The CCPN data model for NMR spectroscopy: development of a software pipeline. Proteins. 2005;59(4):687–696.
- Güntert P, Mumenthaler C, Wüthrich K. Torsion angle dynamics for NMR structure calculation with the new program DYANA. J Mol Biol. 1997;273(1):283–298.
- Pettersen EF, Goddard TD, Huang CC, Couch GS, Greenblatt DM, Meng EC, Ferrin TE. UCSF Chimera–a visualization system for exploratory research and analysis. J Comput Chem. 2004;25(13):1605–1612.
- Sester DP, Thygesen SJ, Sagulenko V, Vajjhala PR, Cridland JA, Vitak N, Chen KW, Osborne GW, Schroder K, Stacey KJ. A novel flow cytometric method to assess inflammasome formation. J Immunol. 2015;194(1):455–462.
- Muusse TW, Lee MYL, Kim H, Parat MO, Nanson JD, Kobe B, Vajjhala PR, Stacey KJ. Flow cytometric reporter assays provide robust functional analysis of signaling complexes. J Biol Chem. 2022;298(12):102666.
- Miljenović T, Jia X, Lavrencic P, Kobe B, Mobli M. A non-uniform sampling approach enables studies of dilute and unstable proteins. J Biomol Nmr. 2017;68(2):119–127.
- Ve T, Williams SJ, Kobe B. Structure and function of Toll/interleukin-1 receptor/resistance protein (TIR) domains. Apoptosis. 2015;20(2):250–261.
- Sharma D, Rajarathnam K. 13C NMR chemical shifts can predict disulfide bond formation. J Biomol Nmr. 2000;18(2):165–171.
- Dal Corso A, Catalano M, Schmid A, Scheuermann J, Neri D. Affinity enhancement of protein ligands by reversible covalent modification of neighboring lysine residues. Angew Chem Int Ed Engl. 2018;57(52):17178–17182.
- Zaugg RH, Walder JA, Klotz IM. Schiff base adducts of hemoglobin. Modifications that inhibit erythrocyte sickling. J Biol Chem. 1977;252(23):8542–8548.
- Sharp TR, Morris R, Horan GJ, Pezzullo LH, Stroh JG. Method for determining the average degree of substitution of o-vanillin derivatized porcine somatotropin. J Pharm Biomed Anal. 2006;40(1):185–189.
- Farrar MR, Lakshmi KV, Smith SO, Brown RS, Raap J, Lugtenburg J, Griffin RG, Herzfeld J. Solid state NMR study of [epsilon-13C]Lys-bacteriorhodopsin: schiff base photoisomerization. Biophys J. 1993;65(1):310–315.
- Sato K, Taniguchi T, Suzuki M, Shinohara F, Takada H, Rikiishi H. Dual role of NF-kappaB in apoptosis of THP-1 cells during treatment with etoposide and lipopolysaccharide. Leuk Res. 2004;28(1):63–69.
- Yamamoto M, Sato S, Hemmi H, Sanjo H, Uematsu S, Kaisho T, Hoshino K, Takeuchi O, Kobayashi M, Fujita T, et al. Essential role for TIRAP in activation of the signalling cascade shared by TLR2 and TLR4. Nature. 2002;420(6913):324–329.
- Horng T, Barton GM, Flavell RA, Medzhitov R. The adaptor molecule TIRAP provides signalling specificity for Toll-like receptors. Nature. 2002;420(6913):329–333.
- Cole LE, Laird MH, Seekatz A, Santiago A, Jiang Z, Barry E, Shirey KA, Fitzgerald KA, Vogel SN. Phagosomal retention of Francisella tularensis results in TIRAP/Mal-independent TLR2 signaling. J Leukoc Biol. 2010;87(2):275–281.
- Kenny EF, Talbot S, Gong M, Golenbock DT, Bryant CE, O’Neill LA. MyD88 adaptor-like is not essential for TLR2 signaling and inhibits signaling by TLR3. J Immunol. 2009;183(6):3642–3651.
- Alam S, Javor S, Degardin M, Ajami D, Rebek M, Kissner TL, Waag DM, Rebek J, Saikh KU. Structure-based design and synthesis of a small molecule that exhibits anti-inflammatory activity by inhibition of MyD88-mediated signaling to bacterial toxin exposure. Chem Biol Drug Des. 2015;86(2):200–209.
- Loiarro M, Capolunghi F, Fantò N, Gallo G, Campo S, Arseni B, Carsetti R, Carminati P, De Santis R, Ruggiero V, et al. Pivotal advance: inhibition of MyD88 dimerization and recruitment of IRAK1 and IRAK4 by a novel peptidomimetic compound. J Leukoc Biol. 2007;82(4):801–810.
- Capolunghi F, Rosado MM, Cascioli S, Girolami E, Bordasco S, Vivarelli M, Ruggiero B, Cortis E, Insalaco A, Fantò N, et al. Pharmacological inhibition of TLR9 activation blocks autoantibody production in human B cells from SLE patients. Rheumatology. 2010;49(12):2281–2289.
- Zhang HS, Li H, Zhang DD, Yan HY, Zhang ZH, Zhou CH, Ye ZN, Chen Q, Jiang TW, Liu JP, et al. Inhibition of myeloid differentiation factor 88(MyD88) by ST2825 provides neuroprotection after experimental traumatic brain injury in mice. Brain Res. 2016;1643:130–139.
- Wang X, Tan Y, Huang Z, Huang N, Gao M, Zhou F, Hu J, Feng W. Disrupting myddosome assembly in diffuse large B-cell lymphoma cells using the MYD88 dimerization inhibitor ST2825. Oncol Rep. 2019;42(5):1755–1766.
- Ippagunta SK, Pollock JA, Sharma N, Lin W, Chen T, Tawaratsumida K, High AA, Min J, Chen Y, Guy RK, et al. Identification of Toll-like receptor signaling inhibitors based on selective activation of hierarchically acting signaling proteins. Sci Signal. 2018;11(543):eaaq1077.
- Toshchakov VY, Javmen A. Targeting the TLR signalosome with TIR domain-derived cell-permeable decoy peptides: the current state and perspectives. Innate Immun. 2020;26(1):35–47.
- Shuker SB, Hajduk PJ, Meadows RP, Fesik SW. Discovering high-affinity ligands for proteins: SAR by NMR. Science. 1996;274(5292):1531–1534.
- Azar DF, Haas M, Fedosyuk S, Rahaman MH, Hedger A, Kobe B, Skern T. Vaccinia virus immunomodulator A46: destructive interactions with MAL and MyD88 shown by negative-stain electron microscopy. Structure. 2020;28(12):1271–1287 e5.
- Spear AM, Rana RR, Jenner DC, Flick-Smith HC, Oyston PCF, Simpson P, Matthews SJ, Byrne B, Atkins HS. A Toll/interleukin (IL)-1 receptor domain protein from Yersinia pestis interacts with mammalian IL-1/Toll-like receptor pathways but does not play a central role in the virulence of Y. pestis in a mouse model of bubonic plague. Microbiology (Reading). 2012;158(Pt 6):1593–1606.
- Hacker SM, Backus KM, Lazear MR, Forli S, Correia BE, Cravatt BF. Global profiling of lysine reactivity and ligandability in the human proteome. Nat Chem. 2017;9(12):1181–1190.