
 ?Mathematical formulae have been encoded as MathML and are displayed in this HTML version using MathJax in order to improve their display. Uncheck the box to turn MathJax off. This feature requires Javascript. Click on a formula to zoom.
ABSTRACT
Background
The aim of this study was to evaluate the public health and economic impact of the COVID-19 booster vaccination with BNT162b2 in Japan during an Omicron-dominant period from early 2022.
Research design and methods
A combined cohort Markov decision tree model estimated the cost-effectiveness of annual or biannual booster vaccination strategies compared to no booster vaccination for those aged 65 years and above, and those aged 60–64 years at high risk as the base case. The societal perspective was primarily considered. We also examined other target populations with different age and risk groups. Sensitivity and scenario analyses with alternative inputs were performed.
Results
Annual and biannual vaccination strategies were dominant from the societal perspective in the base case. Incremental Cost Effectiveness Ratios (ICERs) from the payer perspective were JPY 1,752,499/Quality Adjusted Life Year (QALY) for annual vaccination and JPY 2,831,878/QALY for biannual vaccination, both less than the threshold value in Japan (JPY 5 million/QALY). The results were consistent even when examining other target age and risk groups. All sensitivity and scenario analyses indicated that ICERs were below JPY 5 million/QALY.
Conclusions
Booster vaccination with the COVID-19 vaccine BNT162b2 is a dominant strategy and beneficial to public health in Japan.
1. Introduction
The World Health Organization (WHO) has reported approximately 771 million confirmed cases of COVID-19, including 6.96 million COVID-19 related deaths worldwide as of September 2023 [Citation1]. In Japan, there have been more than 33.8 million confirmed cases of COVID-19 and nearly 74,700 deaths [Citation1]. Since 2020, the prevention and control of the disease have disrupted societies and caused an enormous public health and economic burden in all countries, with Japan being no exception [Citation1].
The contributions of vaccination to the prevention of COVID-19 infection and severe symptoms have been evident [Citation2]. Globally, a total of 13 billion vaccine doses have been administered. Emerging evidence also indicates the need for booster vaccinations, which reduce symptomatic infections, hospital admissions, and severe COVID-19 outcomes compared to not having a booster vaccination [Citation3–6] which is also consistent in Japan [Citation7,Citation8]. Further efforts are needed to encourage eligible individuals to be vaccinated and staying up to date with the recommended COVID-19 vaccines is also encouraged from a public health perspective [Citation6].
The voluntary lockdown measures promoted by the government and voluntary behavioral changes successfully limited transmission rates, but came with a cost. The impact of COVID-19 went beyond the disease itself; the health service delivery was significantly impacted in Japan, especially during the early phase, disrupting both preventive and curative services for other diseases. The delayed essential healthcare services due to the pandemic affected many patients beyond COVID-19 [Citation9,Citation10].
In Japan, COVID-19 vaccinations have been categorized as ‘Special Temporary Vaccinations’ under the Immunization Act, and the cost has been entirely covered by the government [Citation11]. The free vaccination program is scheduled to end in March 2024, with routine annual vaccinations for those aged 65 years and above, and those aged 60–64 years at high risk beginning in the fall of 2024 [Citation12]. No economic evaluation of the COVID-19 vaccination in the Japanese population has been published to date. This study estimates the public health impacts and economic value of booster vaccination with BNT162b2, mRNA COVID-19 vaccine after the Omicron dominant period in Japan which is ongoing since early 2022.
2. Methods
2.1. Overview
A cost-effectiveness analysis was conducted comparing the booster vaccination with BNT162b2 with no booster vaccination during the Omicron dominant period starting in early 2022 in Japan. Since COVID-19 infection may cause home care or hospitalization, which could significantly affects work productivity for the patients and their caregivers [Citation13], we primarily analyzed from the societal perspective to capture the broader impact of productivity loss. The model incorporated the costs and effects on the COVID-19 disease and the vaccination. The cost-effectiveness model builds on a combined cohort Markov model () and a decision tree [Citation14]. This static model was developed based on the model previously used in Di Fusco et al. [Citation15] and was programmed in Microsoft Excel. The intervention modeled was either an annual or biannual dose of the BNT162b2 booster. In Japan, an annual COVID-19 vaccination program is scheduled to begin in the fall of 2024. However, a study recommended a biannual vaccination in view of the severity of COVID-19 infection [Citation16]. Therefore, our study evaluated the cost-effectiveness of both the annual and biannual vaccinations. The time horizon was set to 3 years to fully capture the impact of immunization through the booster vaccination. A 2% discount rate was applied to both the costs and effectiveness, in line with the Japanese cost-effectiveness evaluation guideline [Citation17]. Ethical approval was not needed since this study was a model analysis with published secondary data and without individual patient data.
Figure 1. Markov cohort model structure.
We set up multiple hypothetical scenarios, including one scheduled for fall 2024 in Japan, in order to examine the cost-effectiveness of vaccination in Japan in a broad range of situations. The primary scenarios are as follows ().
Base case (those aged 65 years and above, and those aged 60−64 years at high risk): In the fall of 2024, COVID-19 vaccination is scheduled for those aged 65 years and above and those aged 60−64 years who are considered ‘at high risk,’ which aligns with the target population for the seasonal influenza vaccination [Citation18]. The ‘at high risk’ population is defined as those who have heart, kidney, or respiratory function disorders that severely limit their daily activities or immune function caused by the human immunodeficiency virus that make daily life almost impossible. It is roughly equivalent to the definition of Grade 1 disability for the physically disabled in Japan. Certification is given in levels from 1 to 6 according to the degree of the impairment, with Grade 1 being the most severely impaired. This study used the MHLW survey and government statistics as the data source [Citation18,Citation19]. The detailed definition of an ‘at high risk’ population is provided in Supplemental Table S1.
Scenario 1 (those aged 65 years and above, and those aged 12−64 years at risk): During the period when the COVID-19 vaccine was categorized as a ‘Temporary Vaccination,’ the prioritized population was those aged 65 years and above and those aged 12−64 years ‘at risk’ [Citation20]. ‘at risk’ population included those with underlying diseases such as chronic respiratory disease and chronic heart disease. The definition is further detailed in Supplemental Table S1. The age-dependent proportion of the population at risk was derived from the 2020 patient survey from the Ministry of Health, Labour, and Welfare of Japan (MHLW) and government statistics [Citation19,Citation21] by matching the disease classification code used in the survey to the ‘at risk’ definitions.
Scenario 2 (those aged 5 and above): We acknowledge the importance of vaccinating a broader population, i.e. age 5 years and above in Japan to reduce transmission. This target population was also aligned with that of Di Fusco et al. [Citation14], which assessed the cost-effectiveness of the one-time BNT162b2 booster in the United States of America (U.S.A.). Neither the ‘at risk’ nor the ‘at high risk’ population was considered under this scenario.
Table 1. Base case and the main scenarios explored.
2.2. Model structure
The model structure was almost the same as the model used in the U.S. setting [Citation14]. The Markov model () simulated the transition of the target population through mutually exclusive health states: susceptible, infected, recovered, and vaccinated states. For the vaccinated states, ‘Full primary vaccination,’ ‘First booster vaccination,’ and ‘Further booster vaccination’ were considered, the results of which led to vaccine-induced immunity. The susceptible state indicates that an individual is no longer protected through vaccine-induced immunity nor infection-induced immunity.
All cohorts entering the model were fully vaccinated with a primary series in line with the current booster authorized indication [Citation14] including those who the received monovalent or bivalent booster regimen. The model assumed that at the model start, the included population belonged to one of the following three categories: fully vaccinated by the primary series, susceptible, or has infection-induced immunity (‘Recovered’). The cohorts moved through these health states in weekly cycles over the three-year time horizon. The cohorts transitioning to other health states are determined by the age-dependent probabilities in each cycle. Those in the recovered state were assumed to be protected by infection-induced immunity which was assumed to wane at a rate of 1/(duration of protection) before they transition to ‘Susceptible.’ A proportion of those in the susceptible state would transition to the infected state based on the age-dependent annual attack rate. Vaccine effectiveness (VE) reduced the age-dependent attack rate in determining the proportion of those in the vaccinated state transitioning to the infected state. The booster uptake was defined based on age-dependent vaccine coverage data to date. Once vaccinated, vaccine effectiveness was assumed to wane at a rate of 1/(duration of protection) and eventually transitioned to the susceptible state with a probability determined by the attack rate and vaccine effectiveness against infection. Infection could either lead to recovery or death, and the recovery would eventually lead to the susceptible state after infection-induced immunity waned. Once infected, the cohorts entered through the decision tree component which is described in Di Fusco et al. [Citation14], which was the model used in the U.S. setting.
2.3. Model parameters/base case model inputs
The main model parameters are presented in and further described in Supplemental Table S2. To the extent possible, relevant data from Japan during the Omicron strain dominant period were prioritized during the parameter search and used in the analyses.
Table 2. Main model parameters for the base case.
2.3.1. Population
Age stratified estimates of population size were adopted from the Statistics Bureau of Japan census data conducted in 2020 [Citation22]. The population eligible for a booster was derived from the reported coverage tracked by the Prime Minister’s Office of Japan of those who had completed full primary vaccination by May 2023 [Citation23]. The coverage includes those who received their first and/or further booster vaccinations. Most of these booster vaccines were the previously authorized monovalent vaccines. Japan age-specific population estimates were used to adjust for the age-stratified percentages to match the model age groups.
2.3.2. Vaccine inputs
Regarding coverage, data were taken from the Prime Minister’s office of Japan website which tracks the number of vaccinations by age groups [Citation23]. VE data on BNT162b2 from randomized controlled trials are unavailable, therefore, these data and duration of protection data were sourced from real world studies used in previous studies [Citation14]. One study in Japan estimated the VE against symptomatic infection to be 71% [Citation24] which was close to the value used in the aforementioned study at 70%. As of writing, the peer-reviewed journal publications to date offer limited data on the effectiveness of vaccines in Japan [Citation25]. Moreover, most of the global studies on the effectiveness of COVID-19 vaccines from the Omicron period captures monovalent vaccines [Citation26]. Duration of protection is also an important parameter for this analysis due to questions remaining around the vaccines and its effect on the recommended frequency of the booster. We assumed 6 months for the duration of protection which is consistent with previous studies and literature [Citation14].
2.3.3. Infection inputs
Multiple data sources (Cabinet Secretariat, National Institute of Infectious Diseases data, etc.) were combined with the assumptions to define the distribution of the starting population for the model (Supplement Table S2) [Citation27,Citation28]. The seroprevalence data was taken from the latest survey conducted by the MHLW in May 2023 [Citation29].
The annual attack rate that determines the proportion of the ‘Susceptible’ who were infected was derived from MHLW data that tracked age-stratified [Citation30] weekly infection rates for the period covering May 2022 to May 2023, which was an Omicron strain dominant period. The reported number of infections is likely under-reported. Conservatively, no adjustments were made for the attack rate. The tracking of weekly infection stopped as of May 2023.
2.3.4. Clinical inputs
Clinical inputs on symptomatic infections, hospitalizations, and death were derived from prefectural evidence by age group, due to unavailability of national-level data [Citation31–33]. Intensive care unit (ICU) admission rates of those hospitalized, invasive mechanical ventilation (IMV) rate among those hospitalized, and death rate among those hospitalized were taken from a nationwide observational study on clinical characteristics of the first three waves of hospitalized COVID-19 patients [Citation34].
The risk ratio for hospitalization, including ICU and IMV, of the ”at high risk” population was taken from the cohort study conducted in New York State [Citation35] while the mortality risk ratio was taken from the existing meta-analysis [Citation36]. The mortality risk ratio of the ‘at risk’ population was calculated based on data from the MHLW Health Center Real-time information-sharing System on COVID-19 [Citation37]. Due to data restriction, the same value as for the mortality risk ratio applied to the hospitalization risk ratio for the ‘at risk’ population.
The probability of post-acute sequelae SARS-CoV-2 infection (PASC) was differentiated among outpatient, inpatient, and asymptomatic cases. We use the terms PASC, long COVID, and post COVID-19 condition interchangeably in this manuscript. For outpatient cases, a survey conducted by the Yamanashi prefecture authority among those who were infected during the June 2021–July 2022 period was used as a proxy for the national representation [Citation38]. For inpatient cases, a study reporting the prevalence of PASC among hospitalized patients were used [Citation39]. For asymptomatic cases, we conservatively assumed that the probability of PASC was 0% across all ages.
2.3.5. Direct medical cost inputs
Vaccine related costs consisted of vaccine acquisition and vaccine administration costs. For the vaccine acquisition costs, considering the lack of a list price in Japan, we used the US-based price used by Di Fusco et al. [Citation14] and applied the average exchange rate over the past 3 years between the U.S. dollar and Japanese yen (JPY) [Citation40]. The vaccine administration costs were derived from the MHLW guidelines [Citation41].
Symptomatic COVID-19 patients could incur medical costs including COVID-19 tests, outpatient visits, and hospitalization. For costs of COVID-19 testing, outpatient care, and treatment of PASC, we used the medical fee information provided by MHLW for calculation [Citation42]. The hospitalization costs (general ward with or without IMV, ICU with or without IMV) were estimated from MDV claims data, one of the largest administrative data sources available in Japan from over 460 hospitals that covers over 40 million patients [Citation43]. The data provided included persons hospitalized in the same year and month they became infected with COVID-19 to estimate the hospitalization cost. The data period was from 1 January 2022 to 31 December 2022. To avoid higher costs affected by outliers, median values were used over average values. The medical costs of PASC were also considered through outpatient care and number of tests.
Even though the reported probability of serious adverse events related to BNT162b2 intake has been extremely low, for example with the expected incidence of myocarditis being lower than 0.00001% [Citation44], the risk and costs of myocarditis and pericarditis were considered in the model [Citation44,Citation45].
2.3.6. Productivity losses
Productivity losses from COVID-19 were calculated based on the age-dependent workforce participation rate, average labor cost per week (JPY 85,025), and number of work days lost [Citation46]. The workdays lost estimates were derived from MHLW guidelines for isolation for those that received outpatient care [Citation13]. The working days lost among hospitalized patients in the general ward (21 days) and ICU with and without IMV (40 days) were taken from the aforementioned large administrative hospital data (MDV data above [Citation43]). The working days lost among PASC patients (60 days) were derived from the WHO clinical case definition [Citation47]. Productivity loss for the patient herself/himself was considered. Moreover, we assumed that if the patient was not working (e.g. those aged 65 and above), the productivity loss for caregivers would occur (set at 100%).
2.3.7. Health utilities
Inputs on general population utility weights and utility decrements were taken from published articles based on the Japanese population [Citation43,Citation48–51].
2.4. Model analyses
The model estimated the health outcome gains achieved by booster vaccination over 3 years compared to no booster vaccination. The health outcomes included COVID-19 symptomatic cases, outpatient cases, hospitalizations, PASC, and total deaths. Total deaths included both COVID-19-related and non-COVID-19-related deaths. The model also predicted the associated direct healthcare costs and productivity losses saved by booster vaccination along with quality-adjusted life years (QALYs) gained.
Incremental cost-effectiveness ratio (ICER) was calculated by dividing the differences in costs by differences in QALYs, comparing the booster vaccination versus no booster vaccination. The formula of ICER:
The analysis is conducted from both the societal perspective and the healthcare payer perspective. The societal one is the primary perspective investigated in our study and requires the examination of productivity loss. The cost per QALY reference values (thresholds) commonly used in Japan is JPY 5 million (Japanese Yen), and this value was used in our analyses [Citation41,Citation52]. Incremental net monetary benefits (INMBs) were also calculated with the threshold from the societal perspective. In addition, we compared annual and biannual booster in terms of cost-effectiveness and evaluated multiple vaccination target population scenarios. The formula of INMB:
Additional scenario analyses were conducted using alternative values for main model inputs. The selection of parameters was made considering the uncertainty of the parameter setting and the impact on the INMB. Moreover, various differing target populations for vaccinations were explored as scenario analyses, which were then compared on the cost-effectiveness plane.
Both deterministic and probabilistic sensitivity analyses were conducted to explore the robustness of the base case results. The deterministic sensitivity analysis (DSA) investigated the impact of individual parameter variability on INMB, and the input parameters were varied from −20% to + 20% from the base case value when there were no standard deviation (error) and 95% confidence interval in the sources. Therefore, most of the data from governmental reports were varied by ± 20%. In the probabilistic sensitivity analysis (PSA), the number of simulations was set at 1,000 times, calculating the ICER based on variable parameter input, according to probability distributions.
3. Results
3.1. Base case analysis
The base case results for annual and biannual vaccinations are presented in and Supplemental Table S3. In the annual vaccination scenario, over 3 years, the booster program for those aged 65 years and above, and those aged 60–64 years at high risk was estimated to have averted 1,915,588 symptomatic cases 23,398 total deaths, and 319,066 hospitalizations related to COVID-19, resulting in an estimated JPY 673 billion additional direct medical costs, and JPY 1.94 trillion productivity loss saved, and JPY 1.27 trillion net cost savings relative to the counterfactual scenario of no booster vaccination. The vaccine-related costs were estimated to be JPY 1.39 trillion for annual vaccination. The annual vaccination resulted in discounted gains of 383,965 QALYs. Therefore, the annual booster base case model prediction indicated that from the societal perspective, the BNT162b2 booster was a dominant strategy compared to no booster vaccination.
Table 3. Results of the cost-effectiveness analysis of booster vaccination with the BNT162b2 vaccine in Japan for the base case over 3 years.
In the biannual vaccination scenario, the booster program was estimated to have averted 2,921,188 symptomatic cases 35,573 deaths, and 482,340 hospitalizations related to COVID-19 over three years, resulting in an estimated JPY 1.65 trillion additional direct medical costs, JPY 2.95 trillion productivity loss saved compared to no vaccination. The net cost savings was JPY 1.30 trillion. The vaccine-related costs were estimated to be JPY 2.73 trillion for biannual vaccination. The biannual vaccination resulted in discounted gains 582,197 QALYs. Therefore, the base case model predictions indicated that from the societal perspective, the BNT162b2 booster was a dominant strategy compared to no booster vaccination, both in the case of annual and biannual vaccination. Detailed results of the cost-effectiveness analysis of booster vaccination with the BNT162b2 vaccine in Japan for the base case over 3 years are shown in Supplemental Table S3 at the population (3–1) and the individual (3–2) levels. On the other hand, ICERs for annual and biannual vaccinations versus no vaccination in terms of healthcare payer perspective were JPY 1,752,499/QALY and JPY 2,831,878/QALY which were less than the Japanese threshold of JPY 5 million/QALY (). Comparing with annual vaccination among the base case population, biannual vaccination was dominant from the societal perspective (Supplemental Table S4).
3.2. Scenario analyses
The results of the main scenario analyses are presented in and Supplemental Tables S5-1 and S5-2. In Scenario 1, the target population was those aged 65 years and above, and those aged 12–64 years at risk. Generally, the differences were small between Scenario 1 and the Base case, and ICER from the societal perspective remained dominant. From the payer perspective in Scenario 1, ICERs for annual and biannual vaccinations were JPY 1,752,192/QALY and JPY 2,796,259/QALY respectively, which are less than the Japanese threshold JPY 5 million/QALY. When comparing the Scenario 1 results with the respective base case based on the number of vaccinations per year, the benefits of the vaccine increased in Scenario 1 in terms of symptomatic cases averted, total deaths averted, outpatient and hospitalization cases averted, and QALY saved. Scenario 1 also had larger productivity losses saved, and overall costs saved compared to the respective base case, however, the incremental direct medical costs were larger in Scenario 1 than in the base cases.
Table 4. Results of the cost-effectiveness analysis of booster vaccination with the BNT162b2 vaccine in Japan under two scenarios over 3 years.
In Scenario 2, the target population was age 5 and above. Due to the expanded vaccination target population in Scenario 2, the direct healthcare costs incurred were JPY 1.92 trillion (annual vaccination) and JPY 4.39 trillion (biannual vaccination) compared to no vaccination. The annual vaccination resulted in discounted gains of 937,046 QALYs while the biannual vaccination resulted in 1,507,884 QALYs. ICER remained dominant and therefore cost-effective from the societal perspective. ICERs for annual and biannual vaccinations were JPY 2,050,302/QALY and JPY 2,909,520/QALY from the payer perspective, respectively. These results were also less than the threshold value used in Japan. When comparing the Scenario 2 results with the respective Base case according to the number of vaccinations per year, the benefits of the vaccine increased in Scenario 2 in terms of symptomatic cases averted, total deaths averted, outpatient and hospitalization cases averted, and QALY saved.
3.3. Further scenario analyses
Further scenario analyses were conducted using alternative values for main model inputs as presented in and Supplemental Tables S6–1 and S6–2. The inputs explored included percentage of population with infection-induced immunity at the start of the model horizon, annual attack rates, infected-induced duration of protection, vaccine effectiveness and duration, probability of symptomatic infection, and hospitalization rate and cost. In all scenarios, ICER from the societal perspective remained dominant, both for annual and biannual booster vaccination. All ICER values from the healthcare payer perspective were below the threshold of JPY 5 million/QALY.
Table 5. Scenario analyses using alternative values for main model inputs.
Moreover, various differing target populations were explored as additional scenarios. The description of each target population and their respective results are shown in Supplemental Table S7. The target groups included various age groups with and without the ”at high risk” population consideration, and both annual and biannual vaccinations were considered. The results were robust, with all target population groups showing ICER from the societal perspective being dominant. All ICER values from the payer perspectives were below the threshold of JPY 5 million/QALY. Cost-effectiveness planes for the scenarios explored in Supplemental Table S7 are presented in Supplemental Figures S1 and S2.
3.4. Sensitivity analyses
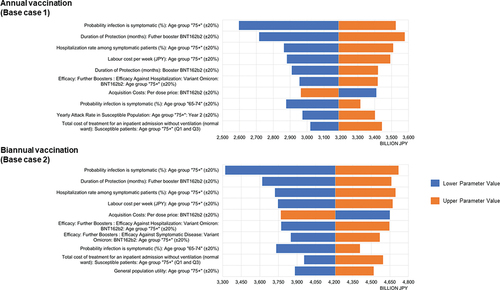
The results of the DSA were presented as Tornado diagrams, and the most impactful parameters for INMB are shown in for Base case 1 (annual vaccination) & 2 (biannual vaccination). Both in Base case 1 and 2, the probability of symptomatic infection for the eldest group (i.e. age 75 and above) was the most impactful parameter. This was followed by parameters related to the duration of protection associated with the vaccine and the hospitalization rate among symptomatic patients aged 75 and above. The INMBs were positive in all cases examined in the DSA.
Figure 2. Deterministic sensitivity analyses for annual and biannual groups: Tornado diagrams for incremental net monetary benefit – societal perspective.
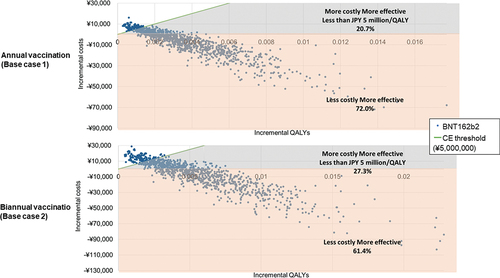
The PSA showed that the results were robust. shows the cost-effectiveness acceptability curves. For Base case 1 & 2, they show that an average 92.7% and 88.7% probability of the booster vaccine being cost-effective at JPY 5 million per QALY gained, respectively. shows the cost-effectiveness plane for the societal perspective in Base case 1 & 2 and the simulation results. For Base case 1 and 2, 72.0% and 61.4% of the simulations were in the fourth quadrant (lower cost, higher efficacy versus no booster vaccination), respectively.
Figure 3. Probabilistic sensitivity analysis: cost-effectiveness acceptability curve for societal perspective.
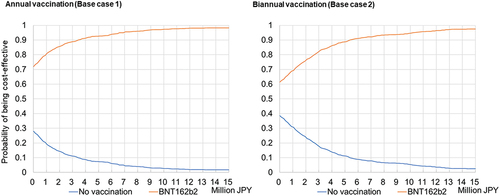
Figure 4. Probabilistic sensitivity analysis: cost-effectiveness plane for societal perspective.
4. Discussion
Comparing the cost-effectiveness of having a booster vaccination compared to no booster vaccination was the primary focus of this study. The base case was the main target population, i.e. those aged 65 years and above, and those aged 60–64 years at high risk. The ICERs in the base case analyses were found to be dominant from the societal perspective. The findings remained consistent in Scenarios 1, 2, and other target populations. Moreover, all ICERs from the payer perspective remained under the threshold of JPY 5 million commonly applied in Japan. Further, the findings were supported by additional scenario analyses and sensitivity analyses. The analysis from the societal perspective leads to an understanding of the broader value of vaccines.
From a cost-effectiveness perspective, our study suggested that a biannual COVID-19 vaccination strategy may be more beneficial than an annual vaccination (Supplemental Table S4). This is in agreement with a previous study on the severity of COVID-19 infection where biannual vaccinations are recommended [Citation16]. In Japan, however, an annual vaccination is scheduled in the fall of 2024, and to the best of our knowledge, there are no countries currently recommending the use of biannual vaccinations [Citation53–55]. Biannual vaccination may be operationally burdensome and unfeasible as a measure for the governments.
COVID-19 infection and its spread have significant impacts on loss of productivity due to having to stay at home or in hospitals. Vaccine-related costs overall were estimated to be JPY 1.39 trillion for annual vaccination and JPY 2.73 trillion for biannual vaccination, however, they were offset by the reductions in productivity losses (JPY 1.94 trillion and JPY 2.95 trillion for annual and biannual vaccinations, respectively). Therefore, the booster vaccinations are cost-saving from the societal perspective. This study supported the value of booster vaccination from the cost-effectiveness aspect.
Infection rates had an impact on all analyses. They especially had a significant impact on the cost-effectiveness among the elderly population. The base case had a setting where the attack rate was assumed to be lower as the age increased based on the data obtained, and the rate was less than 10% for those over 65 years old. The scenario analysis () showed that when the annual attack rate was set at 30% for all age groups, the ICERs improved significantly, and the ICER from the payer perspective became dominant. The spread of the infection would affect the value of the vaccine. As of July 2023, there were reports that the infection is still spreading in some areas of Japan [Citation27]. It remains challenging to predict how the epidemic will evolve in the future.
For both annual and biannual booster vaccination, the results were sensitive to clinical and vaccine efficacy inputs for those aged 75 years and older (). Even when these input parameters were varied by some ranges, the INMBs remained positive. The INMBs still remained positive with a 20% increase in the vaccine acquisition costs in the analysis. Consequently, the results showed robust cost-effectiveness in all sensitivity and scenario analyses, despite sensitivities to some inputs.
The after-effects of infection as long COVID also lead to stagnations in social and economic activities. COVID-19 vaccinations are also effective for preventing long COVID [Citation56]. As patients who have experienced hospitalization are more likely to develop long COVID, our study indirectly observed the effects of vaccination on long COVID. Our results demonstrate that treatment costs related to long COVID were reduced by 3.9% and 5.9% for annual and biannual vaccinations respectively ().
Previous research on the cost-effectiveness of one-shot only booster vaccination in the context of the U.S., the United Kingdom, and Australia, all indicate that it would be cost-saving to invest in the booster vaccination [Citation14,Citation57–59]. Although these studies differed in settings from this study, their cost-effectiveness results also indicated being dominant or under the threshold of the ICER which is in agreement with this present study.
This study had some limitations. First, the strains continue to evolve, and the challenge was to obtain the timeliest data available. Due to limited clinical data (symptomatic case rate, hospitalization rate, etc.) from the Omicron period, select pre-Omicron period data were also used. There was also a lack of appropriate data at the national level in Japan, and we used data from the prefecture-level. Therefore, there may be issues associated with representativeness and validity of the data for Japan as a whole. Second, our model did not account for seasonal or epidemic variation in infection as we used the proportion of those infected during the preceding year. To complement the analyses, we performed additional scenario analyses and sensitivity analyses (DSA and PSA) and showed the robustness of the main results. Third, COVID-19 had broad societal impacts on activities such as going to school and accessing public services including healthcare. Our model, however, only included loss of productivity for patients and caregivers. Advanced models that consider the broader impact of COVID-19 May be needed for future research. Lastly, our study was based on situations in September 2023 in Japan. CEAs of booster vaccinations in future situations and settings in Japan and in other countries will be needed based on the appropriate assumptions.
5. Conclusions
This study indicated that booster vaccination with COVID-19 vaccine BNT162b2 was cost-saving and beneficial to public health in Japan, compared to no vaccination during the Omicron predominance among those aged 65 years and above, and those aged 60–64 years at high risk. The results were consistent with other plausible target populations from both the societal and payer perspectives. This evidence supports the policy of booster vaccination program by the government of Japan.
Declaration of interests
M Nagano, K Kamei, C Takahashi and N Yonemoto are full-time employees of Pfizer Japan Inc. K Wada was a full-time employee of Pfizer Japan Inc. when the study was conducted. M Nagano and K Kamei hold Pfizer stock, and C Takahashi and N Yonemoto hold stock and stock options from Pfizer Inc. H Matsuda is a full-time employee of IQVIA Solutions Japan G.K., was employed and compensated for conducting the study and medical writing support from Pfizer Japan Inc. Y Jingyan is a full-time employee of Pfizer Inc.
Reviewer disclosures
Peer reviewers on this manuscript have no relevant financial or other relationships to disclose.
Author contributions
All named authors take responsibility for the integrity of the work as a whole and have given final approval for this version to be published. All authors conceived and designed the study, populated the model inputs, and reviewed the manuscript.
Supplemental Material
Download PDF (720 KB)Acknowledgments
The authors’ appreciation goes to Karin Matsumoto of IQVIA Solutions G.K. for the project management of this study, Kanae Togo and Masashi Mikami of Pfizer Japan Inc. for data analysis for cost parameters, Kosuke Tanabe of Pfizer Japan Inc. for providing his medical opinions, and Ataru Igarashi of the Department of Public Health, Yokohama City University School of Medicine, and the Department of Health Economics and Outcomes Research, Graduate School of Pharmaceutical Sciences, The University of Tokyo for providing valuable scientific advice.
Supplementary Material
Supplemental data for this article can be accessed online at https://doi.org/10.1080/14760584.2024.2323133
Additional information
Funding
References
- World Health Organization. WHO coronavirus (COVID-19 dashboard). 2023 Sep 26 [cited 2023 Sep 26]. Available from: https://covid19.who.int/?adgroupsurvey=%7Badgroupsurvey%7D&gclid=Cj0KCQiAw8OeBhCeARIsAGxWtUxR9wuVfKmK8awaDLSRrSm65bKiEJOcvWX34XpP2LX4eD_sR9ZfUqAaArNPEALw_wcB
- Altmann DM, Boyton RJ. COVID-19 vaccination: the road ahead. Science. 2022 Mar 11;375(6585):1127–1132. doi: 10.1126/science.abn1755
- Kelly SL, Le Rutte EA, Richter M, et al. COVID-19 vaccine booster strategies in light of emerging viral variants: frequency, timing, and target groups. Infect Dis Ther. 2022 Oct;11(5):2045–2061.
- Zarebska-Michaluk D, Hu C, Brzdek M, et al. COVID-19 vaccine booster strategies for omicron SARS-CoV-2 variant: Effectiveness and future prospects. Vaccines (Basel). 2022, Jul 30;10(8):1223. doi: 10.3390/vaccines10081223
- Zhu Y, Liu S, Zhang D. Effectiveness of COVID-19 vaccine booster shot compared with non-booster: a meta-analysis. Vaccines (Basel). 2022 Aug 25;10(9):1396.
- Arbel R, Peretz A, Sergienko R, et al. Effectiveness of a bivalent mRNA vaccine booster dose to prevent severe COVID-19 outcomes: a retrospective cohort study. Lancet Infect Dis. 2023, Apr 13;23(8):914–921. doi: 10.1016/S1473-3099(23)00122-6
- Kinugasa Y, Llamas-Covarrubias MA, Ozaki K, et al. Post-coronavirus disease 2019 syndrome in Japan: an observational study using a medical database. Japan Med Assoc J. 2023;6(4):416–425. doi: 10.31662/jmaj.2023-0048
- Tomioka K, Uno K, Yamada M. Association between vaccination status and severe health consequences among community-dwelling COVID-19 patients during omicron BA.1/BA.2 and BA.5-predominant periods in Japan. Environ Health Prev Med. 2023;28:35. doi: 10.1265/ehpm.23-00061
- Karako K, Song P, Chen Y, et al. An average of nearly 200,000 new infections per day over a six-week period: what is the impact of such a severe COVID-19 pandemic on the healthcare system in Japan? Biosci Trends. 2022, Nov 20;16(5):371–373. doi: 10.5582/bst.2022.01390
- Yamaguchi S, Okada A, Sunaga S, et al. Impact of COVID-19 pandemic on healthcare service use for non-COVID-19 patients in Japan: retrospective cohort study. BMJ Open. 2022, Apr 24;12(4):e060390. doi: 10.1136/bmjopen-2021-060390
- Ministry of Health., Labour and welfare. Temporary vaccination implementation guidelines related to COVID-19 2023. 2023 Dec 4 [cited 2024 Feb 8]. Available from: https://www.mhlw.go.jp/content/001174286.pdf
- Ministry of Health., Labour and welfare. COVID-19 vaccination Q&A 2023. 2023 Dec 25 [cited 2024 Feb 8]. Available from: https://www.cov19-vaccine.mhlw.go.jp/qa/0180.html
- Ministry of Health., Labour and welfare. Measures to be taken after the transition of the COVID-19 to class 5 infectious diseases. 2023 Sep 15 [cited 2023 Sep 26]. Available from: https://www.mhlw.go.jp/stf/corona5rui.html
- Di Fusco M, Marczell K, Thoburn E, et al. Public health impact and economic value of booster vaccination with pfizer-BioNTech COVID-19 vaccine, bivalent (original and omicron BA.4/BA.5) in the United States. J Med Econ. 2023 Jan;26(1):509–524.
- Di Fusco M, Marczell K, Deger KA, et al. Public health impact of the pfizer-BioNTech COVID-19 vaccine (BNT162b2) in the first year of rollout in the United States. J Med Econ. 2022 Jan;25(1):605–617.
- Link-Gelles R, Weber ZA, Reese SE, et al. Estimates of bivalent mRNA vaccine durability in preventing COVID-19-associated hospitalization and critical illness among adults with and without immunocompromising conditions - VISION network, September 2022–April 2023. MMWR Morb Mortal Wkly Rep. 2023 May 26;72(21):579–588. doi: 10.15585/mmwr.mm7221a3
- Core 2 Health. Guideline for preparing cost-effectiveness evaluation to the central social insurance medical council. 2023 Jan 19 [cited 2023 Sep 26]. Available from: https://c2h.niph.go.jp/tools/guideline/guideline_en.pdf
- Ministry of Health, Labour and Welfare of Japan, Social welfare and War victims’ Relief Bureau, Department of Health and Welfare for Persons with Disabilities. 2016 survey results on difficulties on living-national survey of people living with disability at home. Tokyo, Japan: Ministry of Health, Labour and Welfare of Japan. 2016 [cited 2023 Jun 18]. Available from: https://www.mhlw.go.jp/toukei/list/dl/seikatsu_chousa_c_h28.pdf
- e-Stat (Portal Site of Official Statistics of Japan). Population estimates. 2020 [cited 2023 Sep 26]. Available from: https://www.e-stat.go.jp/stat-search/files?page=1&layout=datalist&toukei=00200524&tstat=000000090001&cycle=7&year=20200&month=0&tclass1=000001011679&result_back=1&tclass2val=0
- Ministry of Health, Labour and welfare. Announcement on the COVID-19 vaccination program in Spring 2023. 2023 Apr 26 [cited 2023 Sep 26]. Available from: https://www.mhlw.go.jp/content/001068244.pdf
- Ministry of Health, Labour and Welfare. 2020 patient survey (confirmed numbers). 2022 Jun 30 [cited 2023 Sep 26]. Available from: https://www.mhlw.go.jp/toukei/saikin/hw/kanja/20/index.html
- Statistics Bureau of Japan. 2020 population census. 2021 Nov 30 [cited 2023 Sep 26]. Available from: https://www.stat.go.jp/english/data/kokusei/2020/summary.html
- Prime Minister’s Office of Japan. Ongoing topics on COVID-19 vaccines. [cited 2023 Jun 17]. Available from: https://www.kantei.go.jp/jp/headline/kansensho/vaccine.html
- National Institute of Infectious Diseases. Fifth preliminary report of a case-control study examining the efficacy of COVID-19 vaccines: the efficacy of a bivalent vaccine against omicron 2022. 2022 Dec 13 [cited 2022 Sep 26]. Available from: https://www.niid.go.jp/niid/ja/2019-ncov/2484-idsc/11688-covid19-9999.html
- Maeda H, Saito N, Igarashi A, et al. Effectiveness of mRNA COVID-19 vaccines against symptomatic SARS-CoV-2 infections during the SARS-CoV-2 omicron BA.1 and BA.2 epidemic in Japan: vaccine effectiveness real-time surveillance for SARS-CoV-2 (VERSUS). Expert Rev Vaccines. 2023 Jan;22(1):288–298.
- Solante R, Alvarez-Moreno C, Burhan E, et al. Expert review of global real-world data on COVID-19 vaccine booster effectiveness and safety during the omicron-dominant phase of the pandemic. Expert Rev Vaccines. 2023 Jan;22(1):1–16.
- National Institute of Infectious Diseases. Current situation of infection. 2023 Jun 16 [cited 2023 Jun 17]. Available from: https://www.niid.go.jp/niid/en/2019-ncov-e.html
- Cabinet Secretariat, Japan. COVID-19 information and resources 2023 [cited 2023 Jun 17]. Available from: https://corona.go.jp/dashboard/
- COVID-19 Infectious Disease Advisory Board Secretariat. The third survey of antibody prevalence rate of COVID-19 using residual blood from test specimens at the time of blood donation (preliminary report, summary) 2023. 2023 Jun 16 [cited 2023 Sep 26]. Available from: https://www.mhlw.go.jp/content/001109157.pdf
- Ministry of Health, Labour and Welfare. Visualizing the data: information on COVID-19 infections. 2023 [cited 2023 Sep 26]. Available from: https://covid19.mhlw.go.jp/en/
- Hiroshima Prefecture Health and Welfare Bureau. Hiroshima prefecture COVID-19 J-SPEED (J-SPEED: surveillance in post extreme emergencies and disasters, Japan version) data analysis from the 7th wave. 2022 [cited 2023 Sep 26]. Available from: https://www.mhlw.go.jp/content/10900000/000975398.pdf
- Ishikawa Infectious Disease Information Center. The status of SARS-CoV-2 infection in Ishikawa Prefecture. 2022 [cited 2023 Sep 26]. Available from: https://www.pref.ishikawa.lg.jp/kansen/documents/202207kansenzyokyo.pdf
- Osaka Prefectural Department of Health and Medical Care. The current situation of infection and medical treatment(COVID-19). 2023 [cited 2023 Sep 26]. Available from: https://www.mhlw.go.jp/content/10900000/001039367.pdf
- Matsunaga N, Hayakawa K, Asai Y, et al. Clinical characteristics of the first three waves of hospitalised patients with COVID-19 in Japan prior to the widespread use of vaccination: a nationwide observational study. Lancet Reg Health West Pac. 2022 May 01;22:100421.
- Tesoriero JM, Swain C-A, Pierce JL, et al. COVID-19 outcomes among persons living with or without diagnosed HIV infection in New York State. JAMA Netw Open. 2021;4(2):e2037069–e2037069. doi: 10.1001/jamanetworkopen.2020.37069
- Ssentongo P, Heilbrunn ES, Ssentongo AE, et al. Epidemiology and outcomes of COVID-19 in HIV-infected individuals: a systematic review and meta-analysis. Sci Rep. 2021 Mar 18;11(1):6283. doi: 10.1038/s41598-021-85359-3
- The 49th new coronavirus infectious disease control advisory board. Ministry of Health, Labour and Welfare. Responses to risk factors for exacerbation of COVID-19-positive patients 2021 [cited 2023 Sep 26]. Available from: https://www.mhlw.go.jp/content/10900000/000823697.pdf
- Yamanashi Prefecture Infectious Disease Control Center, Welfare and Health Department. Results of the COVID-19 sequelae (summary) 2022 [cited 2023 Sep 26]. Available from: https://www.pref.yamanashi.jp/kansensho/documents/coronavirus_kouisho2.pdf
- Sugiyama A, Miwata K, Kitahara Y, et al. Long COVID occurrence in COVID-19 survivors. Sci Rep. 2022 Apr 11;12(1):6039. doi: 10.1038/s41598-022-10051-z
- Organisation for Economic Co-operation and Development. Exchange rates. [cited 2023 Sep 26]. Available from: https://data.oecd.org/conversion/exchange-rates.htm
- Ministry of Health, Labour and welfare. Cost-effectiveness estimation method for vaccination. [cited 2023 Sep 26]. Available from: https://www.mhlw.go.jp/stf/shingi/2r98520000014ryv-att/2r98520000014sdi.pdf
- Ministry of Health, Labour and Welfare. Various information of medical fee. 2023 [cited 2023 Jul 27]. Available from: https://shinryohoshu.mhlw.go.jp/shinryohoshu/
- Medical Data Vision. MDV database. [cited 2023 Sep 26]. Available from: https://en.mdv.co.jp/
- Ministry of Health, Labour and Welfare. Reports of suspected side effects of the COVID-19 vaccine. [cited 2023 Jul 9]. Available from: https://www.mhlw.go.jp/stf/seisakunitsuite/bunya/vaccine_hukuhannou-utagai-houkoku.html
- Tsutsui H, Sakamaki H, Momomura S, et al. Cost-effectiveness analysis of empagliflozin in patients with heart failure with reduced ejection fraction in Japan based on the EMPEROR-Reduced trial. Journal of Cardiology. 2023, ;81(6):522–530 . doi: 10.1016/j.jjcc.2023.02.007 26 Sep 2023 https://doi.org/10.1016/j.jjcc.2023.02.007
- e-Stat (Portal Site of Official Statistics of Japan). Basic statistical survey of wage structure. 2021 [cited 2023 Sep 26]. Available from: https://www.e-stat.go.jp/stat-search/files?page=1&layout=datalist&toukei=00450091&tstat=000001011429&cycle=0&tclass1=000001164106&tclass2=000001164107&tclass3=000001164108&tclass4val=0%E8%A1%A81%2C%20%E7%94%B7%E5%A5%B3%E8%A8%88
- World Health Organization. A clinical case definition of post COVID-19 condition by a Delphi consensus, 6 October 2021. Geneve, Switzerland: World Health Organization; 2021 [cited26 Sep 2023]. Availabe from: https://www.who.int/publications/i/item/WHO-2019-nCoV-Post_COVID-19_condition-Clinical_case_definition-2021.1
- Aoki T, Sugiyama Y, Mutai R, et al. Impact of primary care attributes on hospitalization during the COVID-19 pandemic: a nationwide prospective cohort study in Japan. Ann Fam Med. 2023 Jan;21(1):27–32.
- Shiroiwa T, Noto S, Fukuda T. Japanese population norms of EQ-5D-5L and health utilities index mark 3: disutility catalog by disease and symptom in community settings. Value Health. 2021 Aug;24(8):1193–1202. doi: 10.1016/j.jval.2021.03.010
- Yamamoto H, Tanaka S, Kasugai D, et al. Physical function and mental health trajectories in COVID-19 patients following invasive mechanical ventilation: a prospective observational study. Scientific reports. 2022 [cited2023 Sep];13(1):14529. doi: 10.1038/s41598-023-41684-3
- National Institute of Infectious Diseases. Active epidemiological investigation of COVID-19 caused by SARS-CoV-2 omicron variant (6th report): virological and serological characteristics. 2022 [cited 2024 Feb 9]. Available from: https://www.niid.go.jp/niid/images/epi/corona/76/covid19-76.pdf
- Shiroiwa T, Sung YK, Fukuda T, et al. International survey on willingness-to-pay (WTP) for one additional QALY gained: what is the threshold of cost effectiveness? Health Econ. 2010 Apr;19(4):422–437.
- Ministry of Health, Labour and Welfare. Target population of COVID-19 vaccination. 2023 [cited 2024 Jan 31]. Available from: https://www.cov19-vaccine.mhlw.go.jp/qa/uploads/0148_231130.pdf
- Wallace M. COVID-19 vaccine policy and next steps: centers for disease control and prevention. 2023 [cited 2024 Jan 31]. Available from: https://www.cdc.gov/vaccines/acip/meetings/downloads/slides-2023-10-25-26/03-COVID-Wallace-508.pdf
- World Health Organization. WHO roadmap on uses of COVID-19 vaccines in the context of omicron and high population immunity 2023. 6th ed. 2023 Nov 10 [cited 2024 Jan 31]. Available from: https://iris.who.int/bitstream/handle/10665/373987/WHO-2019-nCoV-Vaccines-SAGE-Prioritization-2023.2-eng.pdf?sequence=1
- Marra AR, Kobayashi T, Callado GY, et al. The effectiveness of COVID-19 vaccine in the prevention of post-COVID conditions: a systematic literature review and meta-analysis of the latest research. Antimicrob Steward Healthc Epidemiol. 2023;3(1):e168. doi: 10.1017/ash.2023.447
- Li R, Liu H, Fairley CK, et al. mRNA-based COVID-19 booster vaccination is highly effective and cost-effective in Australia. Vaccine. 2023, Apr 6;41(15):2439–2446. doi: 10.1016/j.vaccine.2023.01.075
- Li R, Liu H, Fairley CK, et al. Cost-effectiveness analysis of BNT162b2 COVID-19 booster vaccination in the United States. Int J Infect Dis. 2022 Jun;119:87–94.
- Mendes D, Chapman R, Aruffo E, et al. Public health impact of UK COVID-19 booster vaccination programs during omicron predominance. Expert Rev Vaccines. 2023 Jan;22(1):90–103.