
 ?Mathematical formulae have been encoded as MathML and are displayed in this HTML version using MathJax in order to improve their display. Uncheck the box to turn MathJax off. This feature requires Javascript. Click on a formula to zoom.
ABSTRACT
The hip joint and surrounding musculature must generate and withstand torque during the swing phase of running. Prior research has demonstrated that sagittal plane hip torque increases with speed, indicating that thigh angular acceleration likely increases in a similar manner and may be an important gait parameter. In this investigation, we modelled thigh angle vs. time data with a sine wave function, requiring inputs of thigh angular amplitude and stride frequency. This enabled a simple formula to model maximum thigh angular acceleration (αmax, rad/s2) during the swing phase of steady-speed running. A total of 40 participants (20 male, 20 female) completed submaximal and maximal 40 m running trials (n = 154 trials, speed range: 3.1–10.0 m/s), with kinematic data collected from 31–39 m. Thigh angle vs. time curves were well fit by a sine wave function (mean R2 > 0.94 across all trials) and modelled αmax was highly correlated with top speed (R2 = 0.81, p < 0.001). We conclude that thigh angular acceleration is an important parameter when examining running performance across a range of speeds and the simple method introduced here to model αmax may have practical utility for future examinations into high-speed running mechanics.
Introduction
Running velocity is a product of stride length and stride frequency. Faster steady speeds require increased range of angular motion in hip flexion and extension (Clark et al., Citation2020; R. A. Mann et al., Citation1986) and increased stride frequency (Dorn et al., Citation2012; Weyand et al., Citation2000). Increased thigh angular amplitude and frequency indicate that the hip joint and corresponding musculature must generate and withstand greater torques during the swing phase of the stride cycle. Indeed, larger values for sagittal plane hip joint torques (or moments) have been reported at faster steady speeds (Ae et al., Citation1986; Dorn et al., Citation2012; Schache et al., Citation2011).
Larger hip joint torque values at faster steady speeds enable greater thigh segment angular accelerations with increased speed (Andersson et al., Citation1997). This may be necessary to provide the rapid thigh reversal at peak flexion and extension that occurs during high-speed running (Clark et al., Citation2020; Kakehata et al., Citation2021; R. A. Mann et al., Citation1986; Nagahara et al., Citation2017). Accordingly, terms such as ‘scissoring’ or ‘switching’ of the thighs have been used to describe the kinematics and muscle activation involved with rapid thigh reversal at peak flexion and extension (Bosch, Citation2014; Kakehata et al., Citation2021). Thigh angular acceleration has also been noted as a critical variable for sprinting performance by high-level coaches (Seagrave et al., Citation2009).
Despite the potential importance of thigh angular acceleration, further investigation is warranted. Only a few prior publications have specifically presented values for this variable (Dorn et al., Citation2012; Kunz & Kaufmann, Citation1981) and the relationship between thigh angular acceleration and running speed has not been fully established. Qualitative observations of previously published thigh angular data indicate that thigh angle vs. time follows a sinusoidal pattern (Clark et al., Citation2020; Higashihara et al., Citation2016, Citation2018, Citation2010; R. A. Mann et al., Citation1986; Novacheck, Citation1998). This suggests that thigh angular position data can be modelled with a sine wave function to enable direct calculations of maximum thigh angular acceleration without invoking more advanced signal processing analyses. Therefore, our goal was to employ this method to evaluate the relationship between modelled maximum thigh angular acceleration and running speed.
Thus, our first hypothesis was that thigh angle vs. time motion could be modelled with a sine wave function. Our second hypothesis was that modelled maximum thigh angular acceleration, derived from the sine wave function, would be significantly related to top sprinting speed. Correlation of thigh angular acceleration with top sprinting speed would highlight the importance of this parameter for locomotor performance.
Materials and methods
Model formulation
During running, the thighs rotate in the sagittal plane with sinusoidal motion () (Clark et al., Citation2020; Higashihara et al., Citation2016, Citation2018, Citation2010; R. A. Mann et al., Citation1986; McGeer, Citation1990; Novacheck, Citation1998). The model equations for angular position θ(t) (rad), velocity ω(t) (rad/s) and acceleration α(t) (rad/s2) are
Figure 1. Thigh angular motion during sprinting. (a) Simplified representation of thigh angular motion for an upright runner. (b) Thigh angular position vs. time, θ(t). The total thigh range of motion from peak flexion to peak extension is θtotal, the phase angle is θphase, and the offset angle is θshift. (c) Thigh angular velocity vs. time, ω(t). (d) Thigh angular acceleration vs. time, α(t). Figure reproduced/adapted with permission from Clark et al. (Citation2020).
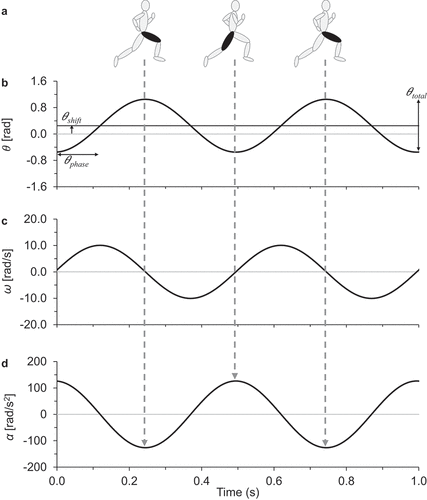
where θtotal (rad) is the total thigh range of motion, θphase (rad) is the phase angle, θshift (rad) is the offset angle, f (strides/s) is the stride frequency and t (s) is the time ().
All angles in the model equations are measured in radians referenced to a vertical axis perpendicular to the ground. Experimentally measured angles in degrees can be expressed in radians by the standard conversion factor (2π rad/360 deg). The thigh segment moves from a positive maximum angle at peak flexion to zero at the downward vertical position to a negative maximum angle at peak extension. The total thigh range of motion (θtotal) is determined from peak extension to peak flexion of the thigh segment. The phase value (θphase) allows the experimental data acquisition of the thigh segment to occur at any time during the rotation cycle and determines the temporal position of the model equations on θ(t) vs. t, ω(t) vs. t and α(t) vs. t graphs. The offset angle (θshift) determines the central angular position of the sine wave model equation on the θ(t) vs. t graph. Conceptually, the θshift value represents a single metric to quantify the extent to which the mean thigh angular motion, averaged over the entire stride cycle, occurs in front or behind the vertical axis. From a practical standpoint, this θshift value is related to how ‘front-side’ thigh mechanics are shifted (Haugen et al., Citation2018; Kratky et al., Citation2016; R. V. Mann & Murphy, Citation2018).
The magnitude of the modelled maximum thigh angular velocity ωmax (rad/s) is
The magnitude of the modelled maximum thigh angular acceleration αmax (rad/s2) during the swing phase at peak flexion or extension is
Participants and testing procedures
A description of the research design, including participant information and testing procedures, has been detailed in a prior publication (Clark et al., Citation2020). A brief summary of the experimental protocol and data analysis procedures is provided below.
A total of 40 participants volunteered and provided written informed consent in accordance with the West Chester University Institutional Review Board, which had approved the study (No. 20180419-B). Participants included 20 males (mean ± standard deviation [SD], age: 21.6 ± 2.2 years, height: 1.80 ± 0.06 m, mass: 79.7 ± 13.4 kg) and 20 females (age: 21.7 ± 1.8 years, height: 1.67 ± 0.08 m, mass: 59.0 ± 6.4 kg) from a range of athletic backgrounds.
Testing was conducted in an indoor facility incorporating a 60 m running lane equipped with a motion capture system (eight OptiTrack Prime 13 cameras with Motive software from NaturalPoint, Corvallis, OR). Participants performed 40 m running trials over a range of speeds with data captured and analysed for four complete trials. The participants were instructed to complete the trials at progressively faster speeds, culminating with maximal intensity (‘top speed’) trials.
The participants wore 12 reflective markers for motion capture. Six markers each were placed on the lateral aspect of the right and left sides of the body. This included markers on the running shoe (area over fifth metatarsal head and lateral calcaneus [posterior to peroneal tubercle]) and lateral malleolus, lateral femoral condyle, greater trochanter, and acromion process. Three-dimensional kinematic data were collected from the 31 to the 39 m mark in the running lane. Kinematic data were collected at a sampling rate of 200 Hz and low-pass filtered at 25 Hz. A seven-segment model (foot, shank and thigh on both legs and a head-arms-trunk segment) was generated from the 12 reflective markers (Winter, Citation2009).
Instantaneous values of centre of mass (COM) position were calculated from marker and segment data (Winter, Citation2009), with running speed quantified from average COM horizontal velocity. The motion capture software was used to review all trials, with touchdown and takeoff events determined from the coordinates and visual inspection of the vertical position of the calcaneal and fifth metatarsal head markers relative to the running surface. Each of the analysed trials contained at least one step (ground contact plus aerial phase) on both the right and left leg and thus included one complete stride from consecutive touchdown or takeoff events on the ipsilateral leg. Stride frequency (f) values were determined from the inverse of the total stride time (sum of left and right steps). Additionally, for evaluating the motion of the thigh, consecutive maximums or minimums of the COM vertical positions were used to identify complete gait cycles to confirm that both peak flexion and peak extension had occurred for each thigh. Thigh angle vs. time waveforms were obtained for one complete gait cycle from the left and right legs. The total thigh range of motion (θtotal) values were quantified from peak thigh flexion to peak thigh extension, calculated as a trial average of both right and left limbs during one complete gait cycle. Modelled maximum thigh angular velocity (ωmax) and modelled maximum thigh angular acceleration (αmax) were calculated from EquationEquations (4(4)
(4) ) and (Equation5
(5)
(5) ), respectively.
Evaluation of model approximation
The fundamental approximation of our method is that the angular acceleration can be derived from a sine wave function representing the angular motion of each thigh ( and EquationEquations 1(1)
(1) –Equation3
(3)
(3) ). This generalisation provides a formulaic value for modelled αmax in terms of the fundamental gait parameters of θtotal and f (EquationEquation 5
(5)
(5) ). To quantify the agreement between measured thigh angular positional data and sinusoidal motion, the following analysis was performed. We extracted the measured thigh angle data θ(t) during each left and right gait cycle, the measured peak-to-peak amplitude θtotal for each thigh and the measured stride frequency f determined from two consecutive steps. The model sine wave was then generated for each gait cycle using EquationEquation (1)
(1)
(1) with these θtotal and f values. The model data were aligned with the temporal and angular position of the experimental data by adjusting phase and offset (EquationEquation 1
(1)
(1) ) using a least-squares evaluation, which provided a coefficient of determination value R2 (see the explanation below in Statistical Analysis, and examples in ).
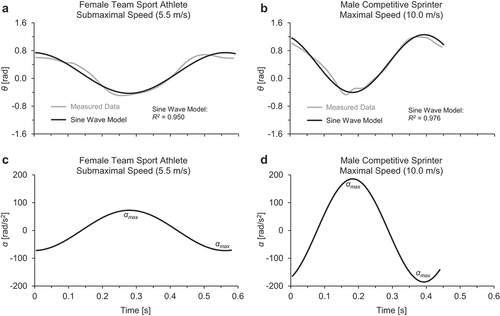
Figure 2. Panels (a) and (b) illustrate measured and modelled thigh angle data θ(t) during a gait cycle for the right leg of two individual participants. The model θ(t) was generated using EquationEquation (1)(1)
(1) with measured values of θtotal and f, and adjusted for phase and offset (θphase and θshift). Panels (c) and (d) illustrate modelled thigh angular acceleration α(t) during the gait cycle, with model α(t) generated using EquationEquation (3)
(3)
(3) with measured values of θtotal and f. (a and c) Female team sport athlete at submaximal speed. (b and d) Male competitive sprinter at maximal speed.
Statistical analysis
The data were analysed across all participants and trials to examine the kinematic variables of interest. Six of the 40 participants had submaximal trials with marker occlusions that made the motion capture data unusable, resulting in n = 154 total trials included in the data analysis with speeds ranging from 3.1 to 10.0 m/s.
To test our first hypothesis, the R2 value (theoretical maximum of R2 = 1.0) was used to evaluate the goodness-of-fit between measured thigh angle and modelled sine wave curves. First, differences between measured and modelled values were used to obtain an index of the total variation within the measured curve, the total sum of squares [SStotal = ∑(Measured—Mean)2]. Next, the difference between the curves was determined [SSerror = ∑(Measured—Modelled)2]. Finally, the proportion of the total variation between the two curves was calculated with R2 = 1- SSerror/SStotal.
To test our second hypothesis, we used simple linear regression with coefficient of determination (R2) to examine the relationship between modelled αmax and top speed (n = 40 trials, one per participant). For the purpose of comparison, this analysis was also performed for the other three variables (θtotal, f, ωmax) and top speed.
The a priori threshold for significance was set at α = 0.05. All statistics were completed using Microsoft Excel and GraphPad Prism software (version 9, San Diego, CA).
Results
presents examples of thigh angle vs. time data, sine wave model approximations and modelled αmax for two individual participants (female team sport athlete at submaximal speed and male competitive sprinter at maximal speed). Faster running speeds were typified by greater f and θtotal as observed in compared to , which resulted in increased modelled αmax at faster speeds as observed in compared to .
In evaluating the first hypothesis, the sine wave model representing the angular motion of each thigh showed a high level of agreement with the measured kinematic data. Across all 308 waveforms (left and right leg for 154 running trials), the average sine wave model agreement was R2 = 0.941 ± 0.032 (mean ± SD), with a range of R2 = 0.834 to 0.984. Nearly 90% of the waveforms (274 out of 308) had an R2 > 0.90. Across all 80 waveforms for the top-speed trials only (left and right leg for 40 top speed trials), the average sine wave model agreement was R2 = 0.964 ± 0.012, with a range of R2 = 0.934 to 0.984.
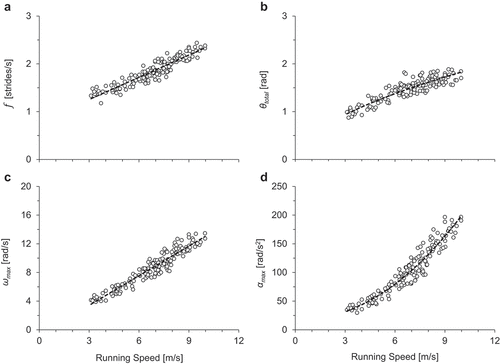
Each of the analysed variables (f, θtotal,ωmax,αmax) demonstrated increases with speed, both for individual participants and across all participants and trials. For illustrative purposes, data for each of the variables for two representative participants (female team sport athlete and male competitive sprinter) are presented in across their individual range of speeds. Similarly, for illustrative purposes, data for each of the variables across all participants and trials are presented in . Values for θtotal have been previously listed in Clark et al. (Citation2020).
Figure 3. Data for two representative participants (female team sport athlete and male competitive sprinter) across their individual range of speeds. (a) Stride frequency (f), (b) total thigh range of motion (θtotal), (c) modelled maximum thigh angular velocity (ωmax), and (d) modelled maximum thigh angular acceleration (αmax).
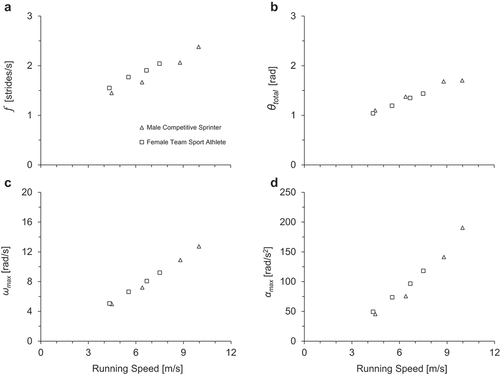
Figure 4. Data for all participants and trials across all speeds. (a) Stride frequency (f), (b) total thigh range of motion (θtotal), (c) modelled maximum thigh angular velocity (ωmax), and (d) modelled maximum thigh angular acceleration (αmax).
Data for each of the variables across all top-speed trials only are presented in . For the statistical evaluation of the second hypothesis, simple regression indicated a positive relationship between modelled αmax and top speed (αmax = 27.01x—76.02, R2 = 0.81, p < 0.001), which had a greater correlation with top speed than did the other three variables (θtotal = 0.08x + 1.02, R2 = 0.31, p < 0.001; f = 0.15x + 0.89, R2 = 0.69, p < 0.001; ωmax = 1.27x + 0.51, R2 = 0.74, p < 0.001). The range (minimum to maximum) across all top-speed trials for each variable are as follows: θtotal = 1.40 to 1.89 rad, f = 1.79 to 2.44 strides/s, ωmax = 8.89 to 13.46 rad/s, and αmax = 102.18 to 196.70 rad/s2. Additionally, for descriptive purposes, lists mean ± SD for each variable for top-speed trials, with runners grouped by sex (male and female) and top speed (faster 10 participants vs. slower 10 participants for each sex).
Figure 5. Data for all participants at top speed only. (a) Stride frequency (f), (b) total thigh range of motion (θtotal), (c) modelled maximum thigh angular velocity (ωmax), and (d) modelled maximum thigh angular acceleration (αmax).
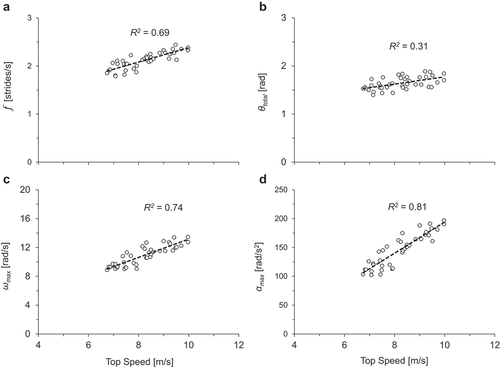
Table 1. Descriptive statistics for top-speed trials.
Discussion and implications
Overview of findings
The primary purpose of this investigation was to utilise a novel, simplified method for modelling the thigh angular position to examine the relationship between modelled αmax and running speed. Our hypotheses are (1) that a sine wave function could model thigh angle vs. time data and (2) that modelled αmax, derived from the sine wave function would be significantly correlated with top speed. Both these hypotheses were strongly supported by the results.
For our first hypothesis, we evaluated the sinusoidal nature of the thigh angle vs. time data using inputs of f and θtotal, and adjusting θphase and θshift to align the model data with the experimentally obtained data. The sine wave model representation of thigh angular data was quite accurate across all participants and speeds (average R2 > 0.94) and was even more accurate for the top-speed trials (average R2 > 0.96). Therefore, the results supported the hypothesis that thigh angle vs. time data can be modelled with a sine wave function. This allowed a relatively simple method for modelling αmax during the swing phase using EquationEquation (5)(5)
(5) with kinematic measurements of f (inverse of total stride time) and θtotal (peak thigh flexion to peak thigh extension).
Our second hypothesis was also supported, as modelled αmax showed a positive relationship with top speed across a heterogenous group of 40 participants that included males and females with a diverse range of anthropometrics and athletic backgrounds. Although several prior publications have indicated the importance of thigh angular velocity in high-speed running (Clark et al., Citation2020; Kivi et al., Citation2002; R. V. Mann & Herman, Citation1985; R. V. Mann & Murphy, Citation2018; Miyashiro et al., Citation2019), the present findings demonstrated that modelled αmax had a stronger relationship with top speed compared to any of the other kinematic variables, including modelled ωmax. This was not known a priori due to the lack of prior research examining thigh angular acceleration, as to our knowledge only one prior study (Kunz & Kaufmann, Citation1981) has analysed this variable at top speed across runners of different sprinting abilities. Our finding here that modelled αmax was more highly correlated with top speed than the other kinematic variables is supported by the mathematical relationship between EquationEquations (4(4)
(4) ) and (Equation5
(5)
(5) ), as thigh angular acceleration effectively incorporates thigh angular frequency, amplitude and velocity.
Implications for muscular contributions and force application
In the present study, modelled αmax demonstrated a positive curvilinear relationship with running speed () due to the product of θtotal and f 2 expressed in the model formulation (EquationEquation 5(5)
(5) ). This positive curvilinear relationship indicates that thigh angular acceleration requirements become increasingly more demanding at faster speeds, which aligns with prior investigations reporting larger torque demands with faster speeds (Dorn et al., Citation2012; Schache et al., Citation2011). From a muscular standpoint, this may be associated with greater hip flexor electromyography amplitude (Andersson et al., Citation1997) and hip flexor work (Dorn et al., Citation2012) during the first half of swing phase, and associated with high peak eccentric contraction speeds of the hip extensors (hamstrings) in the second half of swing phase (Yu et al., Citation2008). Additionally, the onset and offset timing of both ipsilateral and contralateral hip flexors and extensors (‘switching’ and ‘scissoring’) may be a critical determinant of stride frequency during top-speed sprinting (Kakehata et al., Citation2021), indicating that the temporal sequencing of muscular activity may be an important factor underpinning thigh angular acceleration.
There are also important implications for each of the variables in this study (f, θtotal,ωmax,αmax) as it relates to vertical force application during high-speed running. Prior research has demonstrated that faster speeds are associated with increased thigh angular amplitudes and stride frequencies, shorter ground contact times and larger mass-specific vertical forces (Clark et al., Citation2020; Dorn et al., Citation2012; Weyand et al., Citation2010, Citation2000). The greater mass-specific vertical forces of faster runners are primarily achieved in the first half of ground contact (Clark & Weyand, Citation2014), due in large part to fast lower limb touchdown velocities and the resulting lower limb impact with the ground at initial contact (Clark et al., Citation2014, Citation2017). Fast touchdown velocities of the lower limb are positively related to the thigh angular velocity throughout the entire stride cycle and directly prior to contact (Clark et al., Citation2020; Miyashiro et al., Citation2019). These fast thigh angular velocities and limb touchdown velocities are contingent upon aggressive thigh reversal from large angular acceleration values at peak thigh flexion and extension. Collectively, this provides a robust mechanistic explanation for the positive correlation of modelled αmax with top speed observed in the present study ().
Practical applications
While coaches and practitioners have previously described the importance of thigh angular acceleration (Seagrave et al., Citation2009) or ‘scissors’ of the thighs (Bosch, Citation2014), only a few prior studies have reported values of hip or thigh angular acceleration (Dorn et al., Citation2012; Kunz & Kaufmann, Citation1981). To facilitate evaluation of this critical gait variable, in the present study, we modelled thigh angle vs. time data with a sine wave function using inputs of thigh angular amplitude and stride frequency. This allowed for an analytical derivation, resulting in a formula (EquationEquation 5(5)
(5) ) to model αmax during the swing phase of steady-speed running. The approach introduced here provides researchers and practitioners with a tangible metric to quantify the athlete’s ability to achieve high magnitudes of thigh angular acceleration, and the data presented in and facilitate interpretation by providing normative values of modelled αmax across a range of submaximal and maximal speeds.
Additionally, the equations utilised in our sine wave method suggest the potential to calculate modelled αmax via field-based methods. All data in this study were acquired and analysed at 200 frames per second. Since only the values of thigh angular amplitude and frequency are required to model αmax, quantifying θtotal and f from field-based video applications at 240 frames per second (e.g., Dartfish, Kinovea, Binary) and then calculating αmax using EquationEquation (5)(5)
(5) may have acceptable accuracy. In a field setting, f can be calculated as the inverse of total stride time (sum of left and right step time) and θtotal can be obtained from marking the thigh angles at peak flexion and peak extension. Although further experiments are necessary to evaluate the validity of such field-based approaches, prior research has confirmed that existing smartphone video applications can accurately quantify stride frequency during running (Balsalobre-Fernández et al., Citation2017), so the possibilities are intriguing.
Finally, the findings of this study may provide insight into optimal strategies for training interventions. Angular acceleration is proportional to torque and inversely proportional to the moment of inertia due to Newton’s second law for rotation. Thus, the functional capability to produce the larger angular acceleration values required at higher speeds is largely determined by the runner’s maximum torque capacity at the hip joint. This concept is supported by research demonstrating that measurements of hip flexion power and moments are positively related to sprinting speed (Copaver et al., Citation2012; Nagahara et al., Citation2020). Therefore, interventions aimed at improving an athlete’s hip torque capacity (and thus maximum thigh angular acceleration), such as resistance training to increase hip flexor strength (Deane et al., Citation2005) or use of wearable resistance during sprinting (Macadam et al., Citation2020), may be warranted.
Limitations and future research
Several aspects of this study warrant additional investigation. First, we employed a basic kinematic marker set to examine thigh angular motion in the sagittal plane and future studies on this topic could analyse angular motion in all three planes with more extensive marker sets. Second, in this study, we examined the relationship between running speed and modelled maximum thigh angular acceleration, with values for αmax derived from a sine wave function modelling thigh angular motion. The approximations implicit in this approach may potentially exclude relevant kinematic data and further evaluation is required to establish whether a similar relationship with running speed exists if maximum thigh angular velocity or acceleration is computed using alternative measurement systems or analysis techniques. Finally, our results demonstrate that modelled maximum thigh angular acceleration can be useful when analysing performance in a heterogenous group of runners across a range of speeds, but future investigations should examine the utility of this metric when studying homogenous samples of elite athletes.
Conclusion
In this investigation, we introduced a simple sine wave method for modelling maximum thigh angular acceleration requiring only measurements of thigh angular amplitude and stride frequency. As hypothesised, our sine wave method accurately modelled the thigh angle vs. time data and values for modelled maximum thigh angular acceleration were significantly related to top speed in our heterogenous group of participants. We conclude that this novel method for modelling maximum thigh angular acceleration has practical utility for examining an important parameter in high-speed running performance.
List of Symbols and Abbreviations
| θ(t) | = | thigh angular position (rad) |
| ω(t) | = | thigh angular velocity (rad/s) |
| α(t) | = | thigh angular acceleration (rad/s2) |
| θ | = | total thigh excursion during flight (rad) |
| θ | = | phase angle (rad) |
| θ | = | offset angle (rad) |
| ω | = | maximum thigh angular velocity (rad/s) |
| αmax | = | maximum thigh angular acceleration (rad/s2) |
| f | = | stride frequency (strides/s) |
Disclosure statement
The authors declare no financial or other conflicts of interest.
References
- Ae, M., Miyashita, K., Yokoi, T., Ooki, S., & Shibukawa, K. (1986). Mechanical powers and contributions of the lower limb muscles during running at different speeds. Bull Health & Sports Science, University of Tsukuba, 9, 229–239.
- Andersson, E. A., Nilsson, J., & Thorstensson, A. (1997). Intramuscular EMG from the hip flexor muscles during human locomotion. Acta Physiologica Scandinavica, 161(3), 361–370. https://doi.org/10.1046/j.1365-201X.1997.00225.x
- Balsalobre-Fernández, C., Agopyan, H., & Morin, J. B. (2017). The validity and reliability of an iPhone app for measuring running mechanics. Journal of Applied Biomechanics, 33(3), 222–226. https://doi.org/10.1123/jab.2016-0104
- Bosch, F. (2014). Fine-tuning motor control. In D. Joyce & D. Lewindon (Eds.), High- performance training for sports (pp. 113–126). Human Kinetics.
- Clark, K. P., Meng, C. R., & Stearne, D. J. (2020). ‘Whip from the hip’: Thigh angular motion, ground contact mechanics, and running speed. Biology Open, 9 (10) , Article bio053546. https://doi.org/10.1242/bio.053546
- Clark, K. P., Ryan, L. J., & Weyand, P. G. (2014). Foot speed, foot-strike and footwear: Linking gait mechanics and running ground reaction forces. Journal of Experimental Biology, 217 (12) , 2037–2040. https://doi.org/10.1242/jeb.099523
- Clark, K. P., Ryan, L. J., & Weyand, P. G. (2017). A general relationship links gait mechanics and running ground reaction forces. Journal of Experimental Biology, 220 (2) , 247–258. https://doi.org/10.1242/jeb.138057
- Clark, K. P., & Weyand, P. G. (2014). Are running speeds maximized with simple-spring stance mechanics? Journal of Applied Physiology, 117(6), 604–615. https://doi.org/10.1152/japplphysiol.00174.2014
- Copaver, K., Hertogh, C., & Hue, O. (2012). The effects of psoas major and lumbar lordosis on hip flexion and sprint performance. Research Quarterly for Exercise and Sport, 83(2), 160–167. https://doi.org/10.1080/02701367.2012.10599846
- Deane, R. S., Chow, J. W., Tillman, M. D., & Fournier, K. A. (2005). Effects of hip flexor training on sprint, shuttle run, and vertical jump performance. Journal of Strength & Conditioning Research, 19 (3) , 615–621. https://doi.org/10.1519/14974.1
- Dorn, T. W., Schache, A. G., & Pandy, M. G. (2012). Muscular strategy shift in human running: Dependence of running speed on hip and ankle muscle performance. Journal of Experimental Biology, 215(11), 1944–1956. https://doi.org/10.1242/jeb.064527
- Haugen, T., Danielsen, J., Alnes, L. O., McGhie, D., Sandbakk, O., & Ettema, G. (2018). On the importance of “front-side mechanics” in athletics sprinting. International Journal of Sports Physiology and Performance, 13(4), 420–427. https://doi.org/10.1123/ijspp.2016-0812
- Higashihara, A., Nagano, Y., Ono, T., & Fukubayashi, T. (2016). Relationship between the peak time of hamstring stretch and activation during sprinting. European Journal of Sport Science, 16(1), 36–41. https://doi.org/10.1080/17461391.2014.973913
- Higashihara, A., Nagano, Y., Ono, T., & Fukubayashi, T. (2018). Differences in hamstring activation characteristics between the acceleration and maximum-speed phases of sprinting. Journal of Sports Sciences, 36(12), 1313–1318. https://doi.org/10.1080/02640414.2017.1375548
- Higashihara, A., Ono, T., Kubota, J., Okuwaki, T., & Fukubayashi, T. (2010). Functional differences in the activity of the hamstring muscles with increasing running speed. Journal of Sports Sciences, 28(10), 1085–1092. https://doi.org/10.1080/02640414.2010.494308
- Kakehata, G., Goto, Y., Iso, S., & Kanosue, K. (2021). Timing of rectus femoris and biceps femoris muscle activities in both legs at maximal running speed. Medicine and Science in Sports and Exercise, 53(3), 643–652. https://doi.org/10.1249/MSS.0000000000002497
- Kivi, D. M., Maraj, B. K., & Gervais, P. (2002). A kinematic analysis of high-speed treadmill sprinting over a range of velocities. Medicine and Science in Sports and Exercise, 34 (4) , 662–666. https://doi.org/10.1097/00005768-200204000-00016
- Kratky, S., Buchecker, M., Pfusterschmied, J., Szekely, C., & Müller, E. (2016). Effects of a body-weight supporting kite on sprint running kinematics in well-trained sprinters. Journal of Strength & Conditioning Research, 30(1), 102–108. https://doi.org/10.1519/JSC.0000000000001070
- Kunz, H., & Kaufmann, D. A. (1981). Biomechanical analysis of sprinting: Decathletes versus champions. British Journal of Sports Medicine, 15(3), 177–181. https://doi.org/10.1136/bjsm.15.3.177
- Macadam, P., Cronin, J. B., Uthoff, A. M., Nagahara, R., Zois, J., Diewald, S., Tinwala, F., & Neville, J. (2020). Thigh loaded wearable resistance increases sagittal plane rotational work of the thigh resulting in slower 50-m sprint times. Sports Biomechanics, 1–12. https://doi.org/10.1080/14763141.2020.1762720
- Mann, R. A., Moran, G. T., & Dougherty, S. E. (1986). Comparative electromyography of the lower extremity in jogging, running, and sprinting. The American Journal of Sports Medicine, 14(6), 501–510. https://doi.org/10.1177/036354658601400614
- Mann, R. V., & Herman, J. (1985). Kinematic analysis of Olympic sprint performance: Men’s 200 meters. Journal of Applied Biomechanics, 1 (2) , 151–162 https://doi.org/10.1123/ijsb.1.2.151 .
- Mann, R. V., & Murphy, A. (2018). The mechanics of sprinting and hurdling. CreateSpace Independent Publishing Platform.
- McGeer, T. (1990). Passive bipedal running. Proceedings of the Royal Society of London. B. Biological Sciences, 240 (1297) , 107–134. https://doi.org/10.1098/rspb.1990.0030
- Miyashiro, K., Nagahara, R., Yamamoto, K., & Nishijima, T. (2019). Kinematics of maximal speed sprinting with different running speed, leg length and step characteristics. Frontiers in Sports and Active Living, 1, 37. https://doi.org/10.3389/fspor.2019.00037
- Nagahara, R., Kameda, M., Neville, J., & Morin, J. B. (2020). Inertial measurement unit-based hip flexion test as an indicator of sprint performance. Journal of Sports Sciences, 38(1), 53–61. https://doi.org/10.1080/02640414.2019.1680081
- Nagahara, R., Matsubayashi, T., Matsuo, A., & Zushi, K. (2017). Alteration of swing leg work and power during human accelerated sprinting. Biology Open, 6 (5) , 633–641. https://doi.org/10.1242/bio.024281
- Novacheck, T. F. (1998). The biomechanics of running. Gait and Posture, 7(1), 77–95. https://doi.org/10.1016/s0966-6362(97)00038-6
- Schache, A. G., Blanch, P. D., Dorn, T. W., Brown, N. A., Rosemond, D., & Pandy, M. G. (2011). Effect of running speed on lower limb joint kinetics. Medicine and Science in Sports and Exercise, 43(7), 1260–1271. https://doi.org/10.1249/MSS.0b013e3182084929
- Seagrave, L., Mouchbahani, R., & O’Donnell, K. (2009). Neuro-biomechanics of maximum velocity sprinting. New Studies in Athletics, 24 (1) , 19–29.
- Weyand, P. G., Sandell, R. F., Prime, D. N., & Bundle, M. W. (2010). The biological limits to running speed are imposed from the ground up. Journal of Applied Physiology, 108(4), 950–961. https://doi.org/10.1152/japplphysiol.00947.2009
- Weyand, P. G., Sternlight, D. B., Bellizzi, M. J., & Wright, S. (2000). Faster top running speeds are achieved with greater ground forces not more rapid leg movements. Journal of Applied Physiology, 89(5), 82–106. https://doi.org/10.1152/jappl.2000.89.5.1991
- Winter, D. A. (2009). Biomechanics and motor control of human movement (4th ed.). John Wiley & Sons, Inc.
- Yu, B., Queen, R. M., Abbey, A. N., Liu, Y., Moorman, C. T., & Garrett, W. E. (2008). Hamstring muscle kinematics and activation during overground sprinting. Journal of Biomechanics, 41(15), 3121–3126. https://doi.org/10.1016/j.jbiomech.2008.09.005