
 ?Mathematical formulae have been encoded as MathML and are displayed in this HTML version using MathJax in order to improve their display. Uncheck the box to turn MathJax off. This feature requires Javascript. Click on a formula to zoom.
ABSTRACT
The objective of this study was to determine the fifth metatarsal strain generation mechanism during cutting motions performed while playing soccer using a finite element foot model. Five collegiate soccer players performed the side-step cutting and the cross-step cutting motions to measure the three-dimensional foot kinematics, ground reaction force, and plantar pressure distribution. In addition, a finite-element model of a foot consisting of bony structures, ligaments, and skin was constructed from computed tomography images. Simulations were conducted to perform the cutting motions, using the measured foot motion and distributed load on the plantar surface as boundary conditions for the model. During the side-step cutting, the maximum principal strain on the fifth metatarsal was correlated to forefoot adduction angle during stepping out. For cross-step cutting, the maximum principal strain was correlated with plantar pressure at the distal end of the fifth metatarsal. Therefore, to prevent a fracture, it is necessary to take measures to reduce the lateral bending deformation of the forefoot while stepping out during side-step cutting and to reduce the plantar pressure on the distal end of the fifth metatarsal during cross-step cutting.
Introduction
Fifth metatarsal stress fractures is one of the most common foot injuries in sports such as football (Ekstrand & van Dijk, Citation2013; Shuen et al., Citation2009) and American football (Low et al., Citation2004). Fifth metatarsal stress fractures make it difficult for athletes to return to competitive play due to delayed union, non-union and recurrence (Clapper et al., Citation1995; R. W. Wright et al., Citation2000). Therefore, it is necessary to elucidate the mechanisms underlying the occurrence of the fifth metatarsal stress fracture to develop appropriate preventive measures.
Various studies have been conducted on the occurrence mechanisms and risk factors of fifth metatarsal stress fractures, including the investigation of various internal factors such as the effects of foot or bone morphologies including forefoot adduction, fifth metatarsal length, and arch shape (Fleischer et al., Citation2017; Fujitaka et al., Citation2020; Hetsroni et al., Citation2010; Karnovsky et al., Citation2019; Matsuda et al., Citation2017; Yoho et al., Citation2012). In addition, plantar pressure distribution was used to estimate the injury risk in the cutting and accelerating motions (Eils et al., Citation2004; Orendurff et al., Citation2008, Citation2009) with and without a history of fracture (Kuzuyama et al., Citation2019), in the youth soccer player (Azevedo et al., Citation2020; Hotfiel et al., Citation2020) and in gender differences (Queen et al., Citation2016; Sims et al., Citation2008). Furthermore, the effects of external factors have been investigated, such as the effect of the outsole (Carl et al., Citation2014; Sun et al., Citation2017) orthotic insole (Lo et al., Citation2016; Queen et al., Citation2014; Yu et al., Citation2007) and artificial turf (Miyamori et al., Citation2019). Most biomechanical studies above have used the plantar pressure distribution to evaluate the fracture risk. However, the strain distribution of the fifth metatarsal during cutting motions, which is a mechanical index directly related to stress fractures, has not been evaluated to the best of our knowledge. To clarify the external and internal factors related to the fifth metatarsal stress fracture and to take preventive measures, it is necessary to elucidate the relationship between the fifth metatarsal strain and cutting motions and the relationship between the fifth metatarsal strain and plantar pressure. Finite element analysis is a useful tool to analyse the strain distribution of the fifth metatarsal during cutting motions. Several studies have been carried out to simulate the human gait (Akrami et al., Citation2018; Moayedi et al., Citation2021; Scarton et al., Citation2018; Wong et al., Citation2016); however, the finite element models of metatarsals were homogeneous models with constant Young’s modulus, and no dynamical finite element analysis has been carried out to simulate the cutting motion in soccer.
Therefore, this study aimed to clarify whether differences in cutting motions affect the fifth metatarsal strain generation. To address the research objectives, a finite-element model of the foot that reproduced the bone mineral density distribution of the fifth metatarsal was constructed, and cutting motions reproduction simulations were performed based on the measured foot motion and plantar pressure distribution. We hypothesised that 1) differences in the stepping motion would influence the deformation mechanism of the fifth metatarsal bone and 2) the conventional evaluation index for the fifth metatarsal stress fracture, the plantar pressure distribution under the fifth metatarsal, would correlate with bone strain generation. In addition, in situations where the plantar pressure distribution did not affect metatarsal strain depending on the step type, we investigated 3) what new evaluation index could be used instead of the plantar pressure distribution under the fifth metatarsal.
Materials and methods
Motion-measurement experiment
Finite element analysis requires inputting a cutting motion into the simulation and inputting its external force distribution as a boundary condition. Therefore, a cutting motion experiment was conducted on five male collegiate football players (average body mass: 173.8 ± 3.3 cm, weight: 66.4 ± 2.9 kg, age: 20.4 ± 1.0 years). All participants were right-footed and had no medical history of fractures. The experimental shoe used for the study was a training shoe without any studs. We set up a long-pile artificial turf (FieldTurf Revolution 360, FieldTurf Co.) in the laboratory to reproduce an environment similar to an actual football environment.
Markers were attached to six points on the left foot:
The medial malleolus
The lateral malleolus
The medial side of the metacarpophalangeal (MP) joint on the big toe
The lateral part of the proximal end of the fifth metatarsal
The lateral part of the distal end of the fifth metatarsal and
The posterior side of the calcaneus.
An optical motion capture system (MX3+, VICON Co.) was used to measure the three-dimensional coordinates of the attached markers and force plates (BP6001200, AMTI Co.) to measure the reaction forces and centre of pressure. An insole sensor (Pedar, Novel Co.) was used to measure the plantar pressure distribution that can measure the pressure distribution on the foot plantar and was divided into 99 areas.
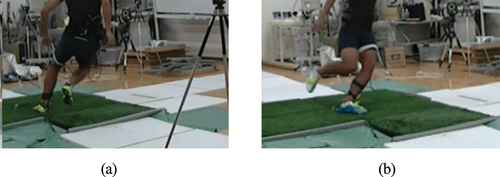
This study involved two types of cutting motion: side-step cutting, in which the player touched the ground with the left foot and turned to the right, and cross-step cutting, in which the player touched the ground with the left foot and turned to the left (). Timing gates with phototubes were installed on the runway to unify step motion speeds. Each participant performed five successful trials. Two outliers were disregarded, and the results of three trials were used in further analyses. This study was conducted with the approval of the Human Participants Research Ethics Review Committee of the Tokyo Institute of Technology (ID 2,016,121).
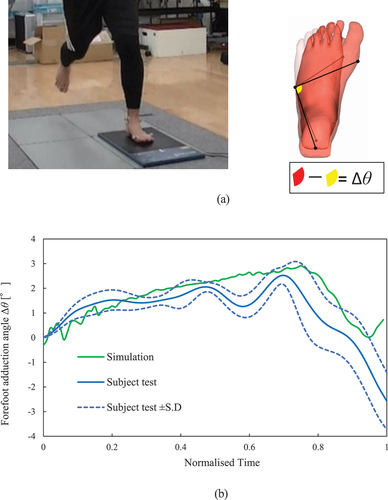
Figure 1. Two types of cutting motion measured in a participant: (a) Side-step cutting (the participant touches the ground with the left foot and turned to the right); (b) Cross-step cutting (the participant touches the ground with the left foot and turns to the left).
Construction of finite-element foot model
Structure of finite-element foot model
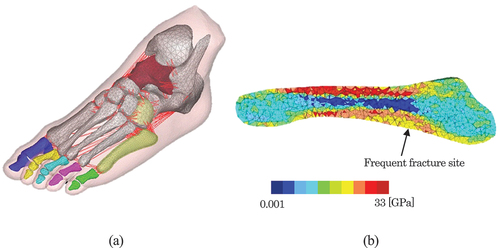
The finite-element foot model was constructed based on the computed tomography (CT) image of a foot, as shown in , using Hypermesh 2019 (Altair Engineering Co.). Materialise Mimics (Materialise Co.) was used to construct the finite-element model of the fifth metatarsal with distributed material properties. The bone structure consisted of the basal bone, metatarsal bones, medial cuneiform bone, intermediate cuneiform bone, lateral cuneiform bone, and cuboid bone. The talus—calcaneus–scaphoid bone and proximal phalanx—intermediate phalanx—distal phalanx of each toe were integrated as rigid bodies. Beam elements were used to model the ligaments, tendons, and aponeuroses. Second order tetrahedral solid elements were used for the bones and soft-tissue modelling. The total number of finite elements was 199 634.
Figure 2. Finite-element foot model: (a) 3D bone and ligament structure of the foot model (b) Young’s modulus distribution of the fifth metatarsal model.
Material properties
To reduce the computation time, bones other than the fifth metatarsal were modelled as rigid bodies. Skin and subcutaneous tissue were defined as elastic bodies, and the Young’s modulus was set to 136 kPa for skin and 34 kPa for subcutaneous tissue (Maeno et al., Citation1997). An elastic cable model with a Young’s modulus of 260 MPa was employed for the ligaments (Siegler et al., Citation1988), and the cross-sectional area of each ligament was determined based on the literature (Mkandawire et al., Citation2005). The plantar aponeurosis was assigned a Young’s modulus of 350 MPa as a linear elastic cable (D. G. Wright & Rennels, Citation1964).
The distribution of the material properties of the fifth metatarsal was determined based on the Hounsfield unit (HU) values at voxels in CT images. Ideally, this relationship would be determined by simultaneous CT scanning of the bone and calibration phantom. However, simultaneous imaging of the phantom was not possible during CT imaging of the foot used for model development. Therefore, the Young’s modulus of each part of the cortical bone was assumed to be proportional to the cube of the HU value based on the Carter-Hayes relationship (Carter & Hayes, Citation1977) as shown in EquationEquation (1).(1)
(1) Ten Young’s modulus levels were set according to the Hounsfield unit (HU) value of each voxel.
where is the Young’s modulus at the i-th part,
is the maximum Young’s modulus of the cortical bone,
is the HU value level at the i-th part of the cortical bone, and
is the HU value at the part assigned the maximum Young’s modulus. The maximum Young’s modulus of 33 GPa for the cortical bone was set and validated with the results of cadaver tests on metatarsals, as described in Section 2.4.1. shows the distribution of the Young’s modulus of the finite element model of the fifth metatarsal.
Simulation conditions
Cutting-motion reproduction simulation
During the experiments, foot motion, ground reaction forces, and plantar pressure distribution for side-step and cross-step cutting were measured. From the measurement results, the average of the ground reaction force waveforms of the three trials was calculated for each participant, and a trial that measured the ground reaction force waveform closest to the average was selected for the cutting-motion reproduction simulation. The selected foot motion and distributed load on the plantar surface were used as boundary conditions for the finite-element model of the foot to simulate the reproduction of these cutting motions for each player.
For foot motion, six degrees of freedom were applied to the rigid talus. In addition, for the plantar load distribution, the distributed load applied to the plantar surface was determined from the ground reaction force and plantar pressure distribution based on EquationEquation (2)(2)
(2) .
where is the plantar load at the ith plantar area,
is the plantar pressure at the ith plantar area, and
is the ground reaction force. The three-axis ground reaction forces were distributed over 99 plantar areas, similar to the measurement area of the insole sensor. First, the ratio of the plantar pressure in each area to the total value of the measured plantar pressure was obtained. Next, the forces in the three axial directions for each area were calculated by multiplying the obtained plantar pressure ratio by the three-axis reaction forces, and then applied to the nodes of the plantar surface of the foot model divided into 99 areas.
Fifth metatarsal strain mechanism evaluation indices
Principal strain at frequent fracture site
The maximum principal strain occurring at the frequent fracture site of the fifth metatarsal was defined as the evaluation index of fracture risk of the fifth metatarsal. First, the locations at which fifth metatarsal stress fractures frequently occurred were determined based on medical images taken from 10 patients. Setting the length of the fifth metatarsal to 100% showed that the fracture line start position had an average of 36% and a standard deviation of 3.85%, which was often observed in the basolateral direction of the bone. Therefore, we focused on the finite elements corresponding to this point and evaluated the fracture risk, as shown in .
Cross-correlation analysis
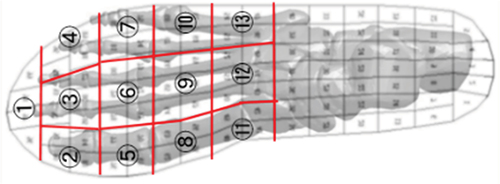
To clarify the mechanical factors influencing the occurrence of fifth metatarsal strain, the relationship between the fifth metatarsal maximum principal strain waveform, plantar pressure distribution, and foot adduction angle waveform was analysed. The forefoot plantar area was divided into 13 areas according to the stud positions found in general football boots to clarify the plantar areas that affect the strains generated at the fracture site in each cutting motion (). In addition, the forefoot adduction angle Δθ was defined as a kinematic parameter representative of forefoot deformation during cutting motion. The forefoot adduction angle Δθ is defined in EquationEquation (3)(3)
(3) .
Figure 3. Thirteen plantar areas divided for cross-correlation analysis with fifth metatarsal strain.
Here, θ0 is the angle before contacting the ground, which is formed by the three points shown in . θ is the angle at each time point.
The factors influencing the generation of the strain waveforms were analysed by calculating the cross-correlation coefficients between the fifth metatarsal strain waveform, time history of the plantar pressure distribution in 13 areas, and time history of the forefoot adduction angle. To compare these waveforms, they were first smoothed using a fourth-order Butterworth filter at 20 Hz. Next, the strain waveform, plantar pressure waveforms, and forefoot adduction angle waveforms were standardised as they have different units. Standardised waveforms were evaluated for waveform similarity using cross-correlation coefficients. When the two waveforms to be compared are f1(t) and f2(t), their cross-correlation coefficients can be calculated using EquationEquation (4)(4)
(4) .
N is the length of the waveform and the cross-correlation coefficient is C(τ), which is the maximum at 0 ≤ τ ≤ N-1. The cross-correlation coefficient of the waveforms takes a value between 0 and 1; the closer it is to 1, the higher the similarity of the waveforms and the more correlated they would be.
Statistical analysis
Statistical tests were conducted to determine the 14 parameters (plantar pressure distribution in 13 areas and forefoot adduction angle) that affected the occurrence of strain at the fracture site in the fifth metatarsal bone. First, the Kruskal—Wallis test was conducted to determine whether there was a difference in the similarity (i.e., cross-correlation) between the 14 parameters (plantar pressure distribution in 13 areas and forefoot adduction angle) and bone strain waveforms. In addition, post-hoc tests were conducted for each parameter using a Conover test.
Validation of the finite-element foot model
Validation of bone strain on the fifth metatarsal model
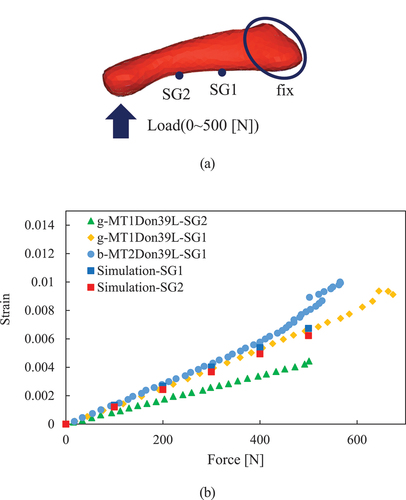
Simulations of the cadaveric bending tests were performed to validate the bending deformation of the fifth metatarsal model (Trabelsi et al., Citation2014). Similar to the cadaver’s bending test conducted by Trabelsi et al., these simulations constrained the displacement of nodes in the proximal part of the fifth metatarsal finite-element model. After selecting a node at the distal end, a bending load was applied in the vertically upward direction. The proximal and distal strains measured in the cadaver experiment were at SG1 and SG2, respectively, as shown in . shows the strains obtained from the experimental results and simulations at the positions of SG1 and SG2. As because the experiment focused on the first and second metatarsal bones, the results cannot be compared with those of the fifth metatarsal finite-element model. The minimum diameters of the first and second metatarsal bones used in the experiment were 14.2 ± 0.424 mm and 8.76 ± 0.677 mm, respectively. In contrast, the minimum diameter of the fifth metatarsal finite-element model used in the simulation was 10.3 mm. Thus, we assumed that the strain decreases in the order of the second metatarsal bone, the fifth metatarsal bone, and the first metatarsal bone. As shown in , the strain on the fifth metatarsal finite-element model was larger than that on the second metatarsal bone and smaller than that on the first metatarsal bone, as expected.
Figure 4. Validation of the finite element model of fifth metatarsal model: (a) Boundary condition of reproductive simulation of cadaver tests and (b) Comparison of bending strains at measured site of the fifth metatarsal model with those from cadaver tests (Trabelsi et al., Citation2014).
Validation of forefoot deformation behaviour
We performed a motion measurement experiment to validate the adduction deformation behaviour of the finite-element model of the foot. In this experiment, a participant moved five times with barefoot (without wearing shoes) so that the deformation behaviour of the foot can be obtained more accurately. A plate-type plantar pressure distribution measuring device (emed-c50, Novel) was fixed on the force plate, as shown in to measure the plantar pressure distribution and ground reaction force simultaneously. Markers were attached to six positions on the barefoot, similar to the experiments with shoes. The forefoot adduction angle, Δθ, is calculated using EquationEquation (3)(3)
(3) , formed by the three points shown in . Foot motion and plantar load distribution were used as boundary conditions for the finite-element model. A side-step cutting motion reproduction simulation is performed. shows that the forefoot adduction angle Δθ in the simulation was generally within the standard deviation of the experimental value.
Figure 5. Validation of the finite-element foot model: (a) Definition of the foot adduction angle Δθ measured in barefoot step (b) Comparison of forefoot adduction angle of simulation model with participant test.
Results
Relationship between the cutting motion and the fifth metatarsal principal strain
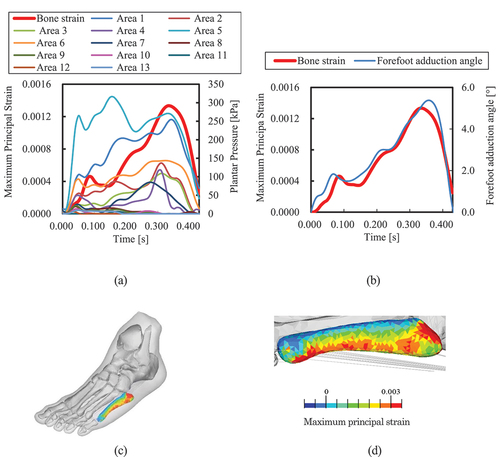
As a typical example, the fifth metatarsal principal strain of subject 1 and plantar pressure waveform in area 13 are shown in , and the strain and forefoot adduction angle waveforms are shown in . As shows, the maximum principal strain at the frequent fracture site during the side-step cutting occurred after 0.3 s, at the time during stepping out. However, the plantar pressure in Areas 10 and 13, located just below the fifth metatarsal, was significantly small. On the other hand, as shown in , the strain waveform is similar to that of the forefoot adduction angle. show that the maximum principal strain occurred at the outer plantar aspect of the fifth metatarsal, which was higher at the frequent fracture site.
Figure 6. Relationship between MPS at frequent fracture site and plantar pressure in 13 areas or forefoot adduction angle in side-step cutting: (a) Relationship between MPS and plantar pressure in 13 areas shown in . (b) Relationship between MPS and the forefoot adduction angle. (c) MPS distribution of fifth metatarsal, and (d) MPS distribution from bottom view.
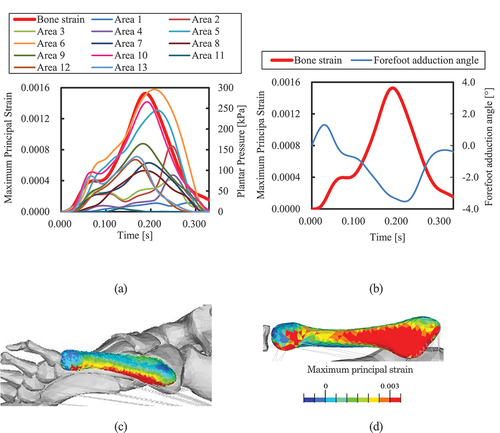
As shows, the maximum principal strain in the cross-step cutting reached its first peak at approximately 0.05 s; then, the waveforms plateaued until 0.1 s and exhibited a second peak at approximately 0.18 s. Comparing the pressure waveform in Area 13 qualitatively with the bone strain waveform, the pressure waveform in Area 10 is similar to the bone strain waveform. In other words, in cross-step cutting, the plantar pressure in the Area 10, which is located just below the distal end of the fifth metatarsal, might affect strain generation.
Figure 7. Relationship between MPS at frequent fracture site and plantar pressure in 13 areas or forefoot adduction angle in cross-step cutting for Participant 1: (a) Relationship between MPS and plantar pressure in 13 areas shown in Figure 3. (b) Relationship between MPS and the forefoot adduction angle. (c) MPS distribution of fifth metatarsal, and (d) MPS distribution from bottom view.
The results for participants 2–5 are shown in Appendices A1–A4. All waveforms differed for each participant during the experiment. However, the relationship between the maximum principal strain waveform and the 14 parameters for Participants 2–5 was similar to that for Participant 1.
Cross-correlation
As shows, in side-step cutting, the correlation coefficient was highest with the forefoot adduction angle, and the inter-participant variability was small (mean = 0.965, S.D. = 0.034). The cross-correlation coefficients between plantar pressure and bone strain waveforms were lower than the forefoot adduction angle but higher in Areas 5 and 6 proximal to the plantar area just under the first metatarsal and lower in Areas 10 and 13 just below the fifth metatarsal.
Figure 8. Box-plots of cross-correlation coefficients between MPS waveform at frequent fracture site and plantar pressure waveform at 13 area or forefoot adduction angle waveform: (a) Side-step cutting and (b) Cross-step cutting.
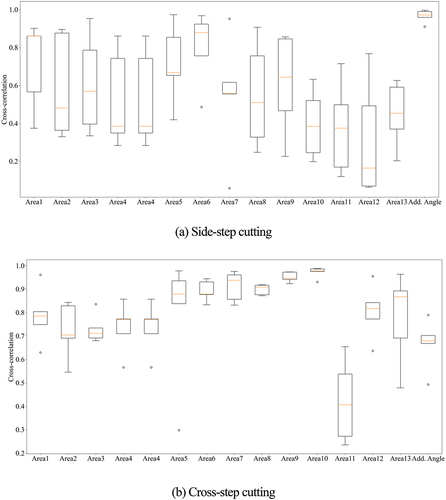
As shown in , in cross-step cutting, the cross-correlation coefficients were the highest in Area 10, corresponding to the distal end of the fifth metatarsal, and the inter-participant variability was small (mean = 0.971, S.D. = 0.024). However, the cross-correlation coefficient for forefoot adduction angle was low.
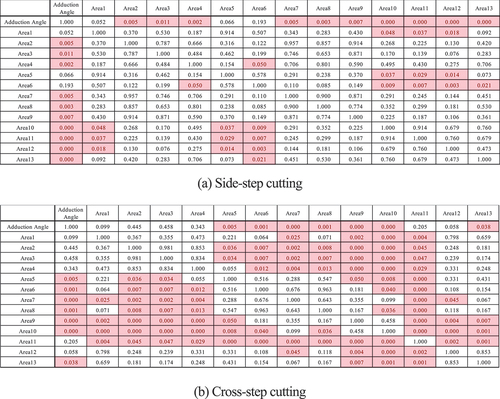
The results of the Kruskal—Wallis test revealed that both steps were significantly different (p-value = 1.96 × 10⁻⁵ for the cross step and p-value = 0.013 for the side step). The results of the multiple comparison tests using the Conover test are shown in . Regarding cross-step cutting, the similarity of the plantar pressure waveforms in Area 10 was significantly higher than those in other areas (p < 0.05). However, there were no significant differences between Areas 10, 7, and 9 near the distal end of the fifth metatarsal bone. Regarding side-step cutting, the similarity of the forefoot adduction angles was significantly higher than that of the plantar pressure waveforms in other areas, except for Areas 5 and 6, which were directly under the ball (p < 0.05).
Figure 9. P-value obtained by multiple testing of 14 parameters with the Conover test.: (a) Side-step cutting and (b) Cross-step cutting. Areas in red indicate p < 0.05.
Discussion and implication
As the answer for the first hypothesis, the results showed that differences in the stepping motion influenced the deformation mechanism of the fifth metatarsal bone. Regarding sidestep cutting, the similarity of the forefoot adduction angles was significantly higher (p < 0.05) than that of the plantar pressure waveforms in other areas, except for the plantar pressure waveforms in Areas 5 and 6, which were directly under the first metatarsal. Therefore, high strain generation at the frequent fracture site of the fifth metatarsal is caused by lateral bending of the forefoot. Furthermore, because the area directly below the first metatarsal is distant from the proximal end of the fifth metatarsal, a bending moment is generated around the proximal end when a force is applied to this area. The plantar pressure in Areas 5 and 6 generated forefoot adduction, and there was no significant difference between the plantar pressure in Areas 5 and 6, and the forefoot adduction angle. Therefore, high plantar pressure in the plantar area under the first metatarsal during stepping out could contribute to lateral bending of the forefoot. In contrast, an upward bending moment in the cross-step cutting can act on the fifth metatarsal because of the upward force from the distal end of the fifth metatarsal, causing high strain in the frequent fracture site. Therefore, we propose that the mechanism of strain generation at the frequent fracture site of the fifth metatarsal varies with different cutting motions.
As the answer for the second hypothesis, the effect of plantar pressure distribution, used in conventional fifth metatarsal fracture evaluation, on the fifth metatarsal strain affects cross-step cutting, but not side-step cutting. The forefoot adduction mainly causes on the fifth metatarsal strain during the side-step cutting because of the lateral bending moment when stepping out. Therefore, we propose a new fifth metatarsal fracture evaluation index other than plantar pressure distribution is forefoot adduction angle during side-step cutting as the answer for the third hypothesis.
Practical implication
Several studies indicated that the risk of fracture increased when forefoot adduction was observed (Fleischer et al., Citation2017; Karnovsky et al., Citation2019; Matsuda et al., Citation2017; Yoho et al., Citation2012). Therefore, for injury prevention in such athletes, it is important to design shoe uppers that suppress forefoot bending deformation during step-out, and insole and outsole designs that distribute and reduce plantar distribution around the plantar area under the first metatarsal during stepping-out, which is related to forefoot bending deformation.
Meanwhile, the upward bending moment from the plantar pressure just below the distal end of the fifth metatarsal mainly caused the strain on the fifth metatarsal in the cross-step cutting. Accordingly, the distribution of the plantar pressure from the distal end of the fifth metatarsal to the proximal end, which is the support end of the fifth metatarsal, is important for reducing the strain at the frequent fracture site. The plantar pressure directly under the fifth metatarsal is high in athletes with a history of fracture (Kuzuyama et al., Citation2019). Therefore, measures, such as designing insoles and outsoles to reduce the pressure on the distal side of the fifth metatarsal, are deemed effective for players who generates high plantar pressure directly under the fifth metatarsal.
Limitation
The strain on the fifth metatarsal was high not only on the frequent fracture site but also on the proximal end, which was fixed by the cuboid bone and ligaments. This could be because the ligaments that fixed the fifth metatarsal proximal end were modelled using wire models. In the wire model, the forces acting on the tendon were concentrated at the nodes, resulting in a high stress at the attachment points. Because the actual ligament is composed of a two-dimensional membrane, modelling the ligament as a membrane model reduces the stress concentration in the constrained area. Therefore, it is necessary to model the ligament using a 2D membrane model and construct a finite-element model with higher biological fidelity.
Since the conventional finite element foot models have modelled metatarsals with homogeneous Young’s modulus distribution (Akrami et al., Citation2018; Moayedi et al., Citation2021; Scarton et al., Citation2018; Wong et al., Citation2016) we constructed a fifth metatarsal model whose Young’s modulus is distributed based on HU values. However, ideally, the relationship between HU value and bone density should be determined by imaging a calibration phantom, and then the Young’s modulus distribution should be determined (Trabelsi et al., Citation2014). Furthermore, there are many equations for the relationship between bone density and Young’s modulus of bone (Helgason et al., Citation2008). The differences between modelling methods might affect the strain distribution. Therefore, it will be a challenge to construct a fifth metatarsal model with a more accurate material property distribution.
The tangential force applied to the foot, measured by the force plates, was distributed in proportion to the magnitude of the plantar pressure when given as a boundary condition to the finite-element model. However, the tangential force distribution is not always proportional to the plantar pressure distribution because currently, no insole sensor can measure the tangential force distribution.
As the aim of this study was to clarify the mechanism of fifth metatarsal strain generation by different steps, training shoes without studs were used to eliminate the influence of studs on plantar pressure distribution. However, the placement and shape of studs can affect the plantar pressure distribution and bone strain generation. Other possible factors, such as differences in surface type and shoe upper constraints, may also influence this mechanism. Therefore, it is necessary to consider the effects of stud placement and shape, upper design, and surface type when implementing preventive measures.
Conclusions
We constructed a foot finite-element model that reproduced the Young’s modulus distribution of the fifth metatarsal and performed simulations that reproduced the cutting motions in football to determine the relationship between the plantar pressure distribution and the mechanism of strain generated on the fifth metatarsal. The results showed that the mechanism of strain generation at the frequent fracture site varied depending on the type of the cutting motion. During side-step cutting, the strain generated on the fifth metatarsal was mainly due to forefoot adduction during stepping out. Meanwhile, the strain on the fifth metatarsal during the cross-step cutting occurred mainly because of the upward bending moment caused by the plantar pressure just below the distal end of the fifth metatarsal. Therefore, to prevent the fifth metatarsal stress fracture, it is necessary to take measures to reduce the lateral bending deformation of the forefoot while stepping out during side-step cutting and to reduce the plantar pressure on the distal end of the fifth metatarsal during cross-step cutting.
Ethical approval
Human Participants Research Ethics Review Committee of the Tokyo Institute of Technology [ID 2,016,121].
Supplemental Material
Download PDF (276.5 KB)Disclosure statement
No potential conflict of interest was reported by the author(s).
Supplemental data
Supplemental data for this article can be accessed online at https://doi.org/10.1080/14763141.2023.2241839.
Additional information
Funding
References
- Akrami, M., Qian, Z., Zou, Z., Howard, D., Nester, C. J., & Ren, L. (2018). Subject-specific finite element modelling of the human foot complex during walking: Sensitivity analysis of material properties, boundary and loading conditions. Biomechanics and Modeling in Mechanobiology, 17(2), 559–576. https://doi.org/10.1007/s10237-017-0978-3
- Azevedo, R. R., Nery, S. B., Stefanyshyn, D. J., & Carpes, F. P. (2020). Plantar loading in the youth soccer player during common soccer movements and risk for foot injury. Injury, 51(8), 1905–1909. https://doi.org/10.1016/j.injury.2020.06.009
- Carl, H. D., Pauser, J., Swoboda, B., Jendrissek, A., & Brem, M. (2014). Soccer boots elevate plantar pressures in elite male soccer professionals. Clinical Journal of Sport Medicine, 24(1), 58–61. https://doi.org/10.1097/01.jsm.0000432857.79305.6c
- Carter, D. R., & Hayes, W. C. (1977). The compressive behavior of bone as a two-phase porous structure. The Journal of Bone and Joint Surgery American Volume, 59(7), 954–962. https://doi.org/10.2106/00004623-197759070-00021
- Clapper, M. F., O’Brien, T. J., & Lyons, P. M. (1995). Fractures of the fifth metatarsal. Analysis of a fracture registry. Clinical Orthopaedics & Related Research, 1995(315), 238–241. https://doi.org/10.1097/00003086-199506000-00027
- Eils, E., Streyl, M., Linnenbecker, S., Thorwesten, L., Völker, K., & Rosenbaum, D. (2004). Characteristic plantar pressure distribution patterns during soccer-specific movements. The American Journal of Sports Medicine, 32(1), 140–145. https://doi.org/10.1177/0363546503258932
- Ekstrand, J., & van Dijk, C. N. (2013). Fifth metatarsal fractures among male professional footballers: A potential career-ending disease. British Journal of Sports Medicine, 47(12), 754–758. https://doi.org/10.1136/bjsports-2012-092096
- Fleischer, A. E., Stack, R., Klein, E. E., Baker, J. R., Weil, L., & Weil, L. S. (2017). Forefoot adduction is a risk factor for Jones fracture. The Journal of Foot and Ankle Surgery, 56(5), 917–921. https://doi.org/10.1053/j.jfas.2017.04.017
- Fujitaka, K., Tanaka, Y., Taniguchi, A., Ogawa, M., Isomoto, S., Otuki, S., & Okubo, M. (2020). Pathoanatomy of the Jones fracture in male university soccer players. The American Journal of Sports Medicine, 48(2), 424–431. https://doi.org/10.1177/0363546519893365
- Helgason, B., Perilli, E., Schileo, E., Taddei, F., Brynjólfsson, S., & Viceconti, M. (2008). Mathematical relationships between bone density and mechanical properties: A literature review. Clinical Biomechanics, 23(2), 135–146. https://doi.org/10.1016/j.clinbiomech.2007.08.024
- Hetsroni, I., Nyska, M., Ben-Sira, D., Mann, G., Segal, O., Maoz, G., & Ayalon, M. (2010). Analysis of foot structure in athletes sustaining proximal fifth metatarsal stress fracture. Foot & Ankle International, 31(3), 203–211. https://doi.org/10.3113/FAI.2010.0203
- Hotfiel, T., Golditz, T., Wegner, J., Pauser, J., Brem, M., Swoboda, B., & Carl, H.-D. (2020). A cross-sectional study on foot loading patterns in elite soccer players of different ages. Journal of Back and Musculoskeletal Rehabilitation, 33(6), 939–946. https://doi.org/10.3233/BMR-181436
- Karnovsky, S. C., Rosenbaum, A. J., DeSandis, B., Johnson, C., Murphy, C. I., Warren, R. F., Taylor, S. A., & Drakos, M. C. (2019). Radiographic analysis of national football league players’ fifth metatarsal morphology relationship to proximal fifth metatarsal fracture risk. Foot & Ankle International, 40(3), 318–322. https://doi.org/10.1177/1071100718809357
- Kuzuyama, M., Perrier, J., Kusaki, Y., Sato, K., Yamaura, I., & Tsuchiya, A. (2019). Characteristics of plantar pressure distribution in elite male soccer players with or without history of proximal fifth metatarsal fracture: A case-control study. Journal of Physical Therapy Science, 31(7), 530–535. https://doi.org/10.1589/jpts.31.530
- Lo, W. T., Wong, D. P., Yick, K. L., Ng, S. P., & Yip, J. (2016). Effects of custom-made textile insoles on plantar pressure distribution and lower limb EMG activity during turning. Journal of Foot and Ankle Research, 9(1), 22. https://doi.org/10.1186/s13047-016-0154-5
- Low, K., Noblin, J. D., Browne, J. E., Barnthouse, C. D., & Scott, A. R. (2004). Jones fractures in the elite football player. Journal of Surgical Orthopaedic Advances, 13(3), 156–160.
- Maeno, T., Kobayashi, K., & Yamazaki, N. (1997). Relationship between structure of finger tissue and location of tactile receptors. Transactions of the Japan Society of Mechanical Engineers Series C, 63(607), 881–888.
- Matsuda, S., Fukubayashi, T., & Hirose, N. (2017). Characteristics of the foot static alignment and the plantar pressure associated with fifth metatarsal stress fracture history in male soccer players: A case-control study. Sports Medicine - Open, 3(1), 27. https://doi.org/10.1186/s40798-017-0095-y
- Miyamori, T., Nagao, M., Sawa, R., Tumilty, S., Yoshimura, M., Saita, Y., Ikeda, H., & Kaneko, K. (2019). Playing football on artificial turf as a risk factor for fifth metatarsal stress fracture: A retrospective cohort study. BMJ Open, 9(2), e022864. https://doi.org/10.1136/bmjopen-2018-022864
- Mkandawire, C., Ledoux, W. R., Sangeorzan, B. J., & Ching, R. P. (2005). Foot and ankle ligament morphometry. Journal of Rehabilitation Research and Development, 42(6), 809–820. https://doi.org/10.1682/JRRD.2004.08.0094
- Moayedi, M., Arshi, A. R., Salehi, M., Akrami, M., & Naemi, R. (2021). Associations between changes in loading pattern, deformity, and internal stresses at the foot with hammer toe during walking; a finite element approach. Computers in Biology and Medicine, 135, 104598. https://doi.org/10.1016/j.compbiomed.2021.104598
- Orendurff, M. S., Rohr, E. S., Segal, A. D., Medley, J. W., Green, J. R., & Kadel, N. J. (2008). Regional foot pressure during running, cutting, jumping, and landing. The American Journal of Sports Medicine, 36(3), 566–571. https://doi.org/10.1177/0363546507309315
- Orendurff, M. S., Rohr, E. S., Segal, A. D., Medley, J. W., Green, J. R., & Kadel, N. J. (2009). Biomechanical analysis of stresses to the fifth metatarsal bone during sports maneuvers: Implications for fifth metatarsal fractures. The Physician and Sportsmedicine, 37(2), 87–92. https://doi.org/10.3810/psm.2009.06.1714
- Queen, R. M., Abbey, A. N., Verma, R., Butler, R. J., & Nunley, J. A. (2014). Plantar loading during cutting while wearing a rigid carbon fiber insert. Journal of Athletic Training, 49(3), 297–303. https://doi.org/10.4085/1062-6050-49.2.24
- Queen, R. M., Vap, A., Moorman, C. T., Garrett, W. E., Jr., & Butler, R. J. (2016). Gender differences in plantar loading during an unanticipated side cut on FieldTurf. Clinical Journal of Sport Medicine, 26(2), 157–161. https://doi.org/10.1097/JSM.0000000000000205
- Scarton, A., Guiotto, A., Malaquias, T., Spolaor, F., Sinigaglia, G., Cobelli, C., Jonkers, I., & Sawacha, Z. (2018). A methodological framework for detecting ulcers’ risk in diabetic foot subjects by combining gait analysis, a new musculoskeletal foot model and a foot finite element model. Gait & Posture, 60, 279–285. https://doi.org/10.1016/j.gaitpost.2017.08.036
- Shuen, W. M., Boulton, C., Batt, M. E., & Moran, C. (2009). Metatarsal fractures and sports. The Surgeon, 7(2), 86–88. https://doi.org/10.1016/S1479-666X(09)80022-X
- Siegler, S., Block, J., & Schneck, C. D. (1988). The mechanical characteristics of the collateral ligaments of the human ankle joint. Foot & Ankle, 8(5), 234–242. https://doi.org/10.1177/107110078800800502
- Sims, E. L., Hardaker, W. M., & Queen, R. M. (2008). Gender differences in plantar loading during three soccer-specific tasks. British Journal of Sports Medicine, 42(4), 272–277. https://doi.org/10.1136/bjsm.2007.042432
- Sun, D., Mei, Q., Baker, J. S., Jia, X., & Gu, Y. (2017). A pilot study of the effect of outsole hardness on lower limb kinematics and kinetics during soccer related movements. Journal of Human Kinetics, 57(1), 17–27. https://doi.org/10.1515/hukin-2017-0043
- Trabelsi, N., Milgrom, C., & Yosibash, Z. (2014). Patient-specific FE analyses of metatarsal bones with inhomogeneous isotropic material properties. Journal of the Mechanical Behavior of Biomedical Materials, 29, 177–189. https://doi.org/10.1016/j.jmbbm.2013.08.030
- Wong, D.-C., Niu, W., Wang, Y., & Zhang, M. (2016). Finite element analysis of foot and ankle impact injury: Risk evaluation of calcaneus and talus fracture. PloS One, 11(4), e0154435. https://doi.org/10.1371/journal.pone.0154435
- Wright, D. G., & Rennels, D. C. (1964). A study of the elastic properties of plantar fascia. The Journal of Bone and Joint Surgery American Volume, 46(3), 482–492. https://doi.org/10.2106/00004623-196446030-00002
- Wright, R. W., Fischer, D. A., Shively, R. A., Heidt, R. S., Jr., & Nuber, G. W. (2000). Refracture of proximal fifth metatarsal (Jones) fracture after intramedullary screw fixation in athletes. The American Journal of Sports Medicine, 28(5), 732–736. https://doi.org/10.1177/03635465000280051901
- Yoho, R. M., Carrington, S., Dix, B., & Vardaxis, V. (2012). The association of metatarsus adductus to the proximal fifth metatarsal Jones fracture. The Journal of Foot and Ankle Surgery, 51(6), 739–742. https://doi.org/10.1053/j.jfas.2012.08.008
- Yu, B., Preston, J. J., Queen, R. M., Byram, I. R., Hardaker, W. M., Gross, M. T., Davis, J. M., Taft, T. N., & Garrett, W. E. (2007). Effects of wearing foot orthosis with medial arch support on the fifth metatarsal loading and ankle inversion angle in selected basketball tasks. The Journal of Orthopaedic and Sports Physical Therapy, 37(4), 186–191. https://doi.org/10.2519/jospt.2007.2327