
 ?Mathematical formulae have been encoded as MathML and are displayed in this HTML version using MathJax in order to improve their display. Uncheck the box to turn MathJax off. This feature requires Javascript. Click on a formula to zoom.
ABSTRACT
Establishing the links between running technique and economy remains elusive due to high inter-individual variability. Clustering runners by technique may enable tailored training recommendations, yet it is unclear if different techniques are equally economical and whether clusters are speed-dependent. This study aimed to identify clusters of runners based on technique and to compare cluster kinematics and running economy. Additionally, we examined the agreement of clustering partitions of the same runners at different speeds. Trunk and lower-body kinematics were captured from 84 trained runners at different speeds on a treadmill. We used Principal Component Analysis for dimensionality reduction and agglomerative hierarchical clustering to identify groups of runners with a similar technique, and we evaluated cluster agreement across speeds. Clustering runners at different speeds independently produced different partitions, suggesting single speed clustering can fail to capture the full speed profile of a runner. The two clusters identified using data from the whole range of speeds showed differences in pelvis tilt and duty factor. In agreement with self-optimisation theories, there were no differences in running economy, and no differences in participants’ characteristics between clusters. Considering inter-individual technique variability may enhance the efficacy of training designs as opposed to ‘one size fits all’ approaches.
Introduction
Long-distance running is a widely practiced sport with a growing number of runners participating in competitive events (García-Pinillos et al., Citation2017). As a result, there is increasing interest in the science underpinning running to enhance performance while reducing running related injuries. For biomechanists and coaches, understanding the relationship between running technique and economy, and how running technique can be improved through training have been central research questions (Folland et al., Citation2017; Moore, Citation2016; Tartaruga et al., Citation2012; van Hooren et al., Citation2020; van Hooren, Jukic, et al., Citation2024). These issues are also receiving considerable attention from running consumer technology developers who have found in runners a community keen to include wearable sensors within their sports kit, to track and improve their technique and training (Aroganam et al., Citation2019; Scheerder et al., Citation2015).
At first sight, the relationship between technique, running related injuries and running performance seems straightforward from a mechanical perspective: a poor running technique can place excessive strain on the musculoskeletal tissue that may result in injury (Bramah et al., Citation2018); a more economical running technique (i.e., lower metabolic cost) can allow an athlete to run faster while spending the same amount of energy (Kipp et al., Citation2019). However, current evidence-based relationships between running technique and injury and economy, respectively, are mostly inconsistent, contrasting or limited at best (Ceyssens et al., Citation2019; Moore, Citation2016; van Hooren et al., Citation2020; Vannatta et al., Citation2020). Indeed, a recent extensive review with meta-analysis on running technique and economy (van Hooren, Jukic, et al., Citation2024) identified only consistent trends for a weak association between higher step frequency and better economy, and moderate associations between lower vertical displacement of the centre of mass, higher vertical and leg stiffness and better economy. Inter-individual variability in running technique emerges as a possible contributor to these discrepancies, since runners are thought to self-optimise their movements with practice (Cavanagh & Williams, Citation1982; Moore et al., Citation2019; Williams & Cavanagh, Citation1987), making running technique highly individual. Building upon the self-optimisation principle, the preferred movement path paradigm was proposed in the study of running footwear (Nigg, Citation2010). According to this theory, runners exhibit a preferred intersegmental coordination pattern that is assumed to be associated with minimal energetic demand and most comfort, and that athletes are reluctant to depart from despite changes in e.g., footwear (Nigg et al., Citation2017). In related work, Hoerzer et al. (Citation2015) showed how clustering methods could be used to identify functional groups or clusters of runners with a similar technique or style, and how such groups were able to better explain athletes’ response to different footwear compared to generic common groupings such as by age or sex.
The definition of functional groups of runners who share a similar technique has traditionally been based on expert knowledge. For instance, the dual-axis framework has been recently introduced to characterise the full spectrum of running techniques based on stride frequency and duty factor, proposing five main styles: stick (long contact), bounce (long flight), hop (small steps), push (long steps) and sit (somewhere in the middle) (van Oeveren et al., Citation2021). The definition of these running techniques was based on an extensive review of centre of mass displacement and spatiotemporal running parameters. However, the popularisation of machine learning methods in biomechanics is leading researchers to increasingly adopt data-driven methods such as clustering, which can minimise the introduction of researcher bias in the definition of running functional groups (Phinyomark et al., Citation2015; Watari et al., Citation2018). Clustering is a family of unsupervised learning algorithms whose objective is to group datapoints with similar behaviour within a dataset, uncovering potentially a priori unknown patterns within the data. Clustering methods have been embraced in the study of running, with a special focus on injury biomechanics (see ). For instance, Phinyomark et al. (Citation2015) clustered healthy runners based on their running technique and then compared each healthy cluster with a group of runners with patellofemoral pain. Each comparison yielded different conclusions about which aspects of running technique were associated with healthy or injured status, highlighting the importance of considering the existence of different running techniques when comparing healthy and injured individuals. Jauhiainen et al. (Citation2020) clustered runners with different injuries expecting the runners within each cluster would present the same injury. Contrary to their initial hypothesis, runners with the same injury did not necessarily cluster together, stressing again the importance of considering different running techniques when planning injury prevention or rehabilitation strategies.
Table 1. Running clustering studies.
The increasing number of clustering studies () show potential to further understand the relation of biomechanics with running economy and performance. The current literature appears to be drifting away from the idea that a single most economical technical model that every runner should pursue exists (Moore, Citation2016; van Hooren et al., Citation2020). According to the self-optimisation and preferred movement path theories, clusters of runners with different but similarly economical techniques may exist, but this hypothesis has not been experimentally tested. Also, the association of running technique clusters with physiological factors and anthropometrics has not been explored, despite their importance to running economy and performance (Barnes & Kilding, Citation2015).
It is well established that changes to technique and training can result in greater economy in some runners while it may not work for others (Barnes & Kilding, Citation2015; Moran & Wager, Citation2020). Indeed, Watari et al. (Citation2021) showed how clusters of runners undergoing the same foot core exercise programme reacted differently to the intervention. Cluster-specific training designs may better target individual technical and strength and conditioning needs that can help enhance the effectiveness of the interventions. However, a critical gap persists in the clustering literature prior to developing cluster-specific training: studies have predominantly focused on singular running speeds, disregarding the diverse pacing strategies and racing distances that runners encounter. How well clusters found at one speed generalise to the full spectrum of speeds an athlete runs at remains unanswered. Addressing this issue appears essential before proceeding to develop and test cluster-specific training interventions.
Therefore, the main purpose of this study was to identify clusters of runners who share a similar running technique and compare the clusters for their running economy. It was hypothesised that clusters would not exhibit differences in their economy, in line with the self-optimisation and preferred movement path theories. Additionally, a comprehensive list of demographic, anthropometric, physiological capacity, training and performance characteristics of the clusters were compared. A secondary aim of this study was to compare the clustering partitions of the same runners at three different speeds as well as at the three speeds combined to assess how representative single speed clustering may be of the full spectrum of speeds a runner uses.
Materials and methods
One-hundred runners (50 females) were recruited for this study. Participants were aged 18–50 years, free from neuromusculoskeletal injury in the 6 months preceding the test and with a most recent self-reported race (or equivalent) 10K time under 57:20 (minutes:seconds) for females and 50:00 for males to ensure matched age-grading (USATF, Citation2020). These inclusion criteria were selected to prevent sex, age, injury status and athletic level from dominating and driving the clustering, since these factors are known to influence running technique (Boyer et al., Citation2017; Clermont et al., Citation2017; Willy & Paquette, Citation2019; Xie et al., Citation2022). All participants provided written informed consent before taking part in the study and ethical approval was granted by the Research Ethics Approval Committee for Health (REACH) of the University of Bath.
Participants completed a maximal incremental running test on a treadmill (J100, Powerjog Inc., North Charleston, South Carolina, US) at a 1% gradient (Jones & Doust, Citation1996). The test included four-minute stages of constant speed running to ensure valid blood lactate concentration and maximal respiratory variable measurements (Bentley et al., Citation2007). The test started at 10 km/h and speed was increased by 1 km/h after every completed stage until volitional exhaustion. Participants were provided with one-minute rest between stages to allow lactate concentration collection and were given frequent verbal encouragement throughout the test to obtain participants’ maximum effort (Andreacci et al., Citation2010; Midgley et al., Citation2017; van Hooren, van Der Lee, et al., Citation2024). Verbal encouragement was systematically provided after every completed minute and 30 seconds before the end of the initial stages using standardised cues (e.g., ‘That is 2 minutes gone, 2 more to go, you are doing really well, keep going’) and a 5-second countdown was provided at the end of each stage. Frequency was increased to every 30 seconds based on higher rate of perceived exertion reported by the runner and became nearly constant (every 5–10 seconds) when runners started exhibiting symptoms of being close to maximal exertion (e.g., ‘Come on’, ‘keep pushing’, ‘you are doing really well’, ‘keep going for as long as you can’, ‘you can do it’, ‘you can finish this one’). To maximise performance and standardise the testing conditions, participants were asked to refrain from strenuous exercise, alcohol and caffeine the 48 hours preceding the test and to attend the test at least 2 hours postprandial. Participants completed the test using their preferred running shoes to prevent influencing their habitual running technique. All the testing sessions took place in the Applied Biomechanics Suite at the University of Bath, where air flow, temperature and humidity were kept consistent through mechanical ventilation.
Physiological data collection and processing
A lactate analyser (Lactate Plus, Nova Biomedical, USA) was used to record the lactate concentration in blood (~0.7 μl samples) after every completed stage. The device was calibrated weekly with known concentrations following the manufacturer's standards. These data were used to calculate individuals’ lactate threshold by fitting an exponential curve to the data (Santos-Concejero et al., Citation2014) and using the Dmax method (Cheng et al., Citation1992). Stages under lactate threshold can be assumed to be completed in metabolically steady state conditions (Faude et al., Citation2009), ensuring valid estimations of metabolic energy expenditure using respiratory variables. During the treadmill test, a portable metabolic analyser (K5, Cosmed, Italy) was used to capture breath-by-breath gas exchange. This device in breath-by-breath mode has been found to obtain excellent reliability against a metabolic simulator (Guidetti et al., Citation2018). The device was calibrated as per manufacturer’s recommendation prior to every test. The mask was fitted to the participant 5 minutes before commencing the test to allow participants to habituate to breathing wearing the mask. Breath-by-breath data were inspected in 30-second windows to discard aberrant breaths (±2 standard deviations away from the local mean) due to e.g., talking, coughing, swallowing. For every stage completed under lactate threshold, the measured and
were used to estimate aerobic energy expenditure using the Jeukendrup and Wallis equation for substrate oxidation during exercise (Jeukendrup & Wallis, Citation2005). The average value over the last minute of each sub-lactate threshold stage was calculated, normalised by body mass and expressed as the aerobic energy expenditure per minute per kg (kcal/min/kg) i.e., running economy (Beck et al., Citation2018). Additionally,
data were smoothed using a 15-breath rolling average and the highest smoothed
during the test was identified and normalised to body mass (
) (Robergs et al., Citation2010).
Biomechanical data collection and processing
A 16-camera motion capture system (Oqus, Qualisys, Sweden) was used to record the three-dimensional trajectories of retroreflective spherical markers attached to the participant (see Appendix) at a sampling frequency of 200 Hz. Marker placement was performed by the same researcher for every participant to prevent systematic differences in segment and joint kinematics due to inter-tester marker placement variability (Pohl et al., Citation2010). Marker trajectories were low-pass filtered (Butterworth, fourth order, zero-lag) with a cut-off frequency of 10 Hz (Fukuchi et al., Citation2017) and used to estimate full-body kinematics using a six degrees-of-freedom modelling approach (Visual 3D, C-Motion, C-Motion, Inc, Rockville, MD). The first and last 10 seconds of the trial were discarded to avoid capturing unnatural gait when getting on and off the treadmill. Foot-strike and toe-off were detected based on segment and joint kinematics (Rivadulla et al., Citation2021). Trials were segmented into strides from foot-strike to foot-strike and strides were time-registered to 201 data points (average stride duration was 141 ± 7 frames). Only right-leg strides were considered. Running technique was characterised by the average pattern of six time-series (1D) variables: the vertical displacement of the centre of mass normalised to leg length (vCOM), trunk-to-pelvis, pelvis, hip, knee, and ankle angles in the sagittal plane; and two discrete (0D) variables: stride frequency normalised to leg length and duty factor. The choice of these variables to characterise running technique was motivated by the fact that during running, most metabolic energy is spent to support body weight and generate forward propulsion (80%) and leg swing (7%) (Arellano & Kram, Citation2014). Movements in the frontal and transverse plane may be less relevant for running technique and economy (van Hooren, Lennartz, et al., Citation2024) and are more sensitive to marker placement errors and soft tissue artefact (Osis et al., Citation2016; Reinschmidt et al., Citation1997). Therefore, they were not considered in this study.
Data analysis
To maximise sample size included in the analysis we assumed the effects of fatigue on running technique were minimal up to the first stage completed past lactate threshold speed. Out of the 100 participants completing the test, 84 runners () were able to complete speeds 10, 11, 12 and 13 km/h in these conditions and were therefore considered. The first stage (10 km/h) was excluded from the analysis as participants were familiarising themselves with running with the testing kit on. Therefore, only data from 84 runners at 11, 12 and 13 km/h were included in the clustering analysis.
Table 2. Runners’ descriptive statistics.
We used Principal Component Analysis (PCA) to reduce the dimensionality of the data used to characterise participants’ running technique. PCA linearly combines the original data into a new set of uncorrelated variables known as principal components (PCs) which can capture different aspects of the variance within the dataset (Jollife & Cadima, Citation2016). A small number of PCs can typically capture most of the variance in the original space, providing dimensionality reduction. We chose to keep the number of PCs which explained 99% of the variance in the dataset. This approach was found to be a good compromise between data compression and data representation, as well as cluster separability in a previous study comparing different dimensionality reduction approaches and their effects on clustering of a subset of the present data [Rivadulla et al., (under review)]. To assess how well this PCs were capturing the original data, we looked at the reconstruction of the original data with the retained PCs compared to the original variables as per [Rivadulla et al., (under review)]. The 1D and 0D variables forming each dataset were standardised and combined prior to applying PCA.
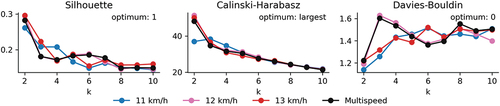
Agglomerative hierarchical clustering was then applied using the Euclidean distance as a measure of similarity and the Ward linkage criterion (Ward, Citation1963) to merge clusters. Initially, each data point constitutes its own cluster, and clusters are iteratively merged while minimising within-cluster variance until all the data points belong to the same cluster, thereby creating a hierarchical structure. To determine the optimal number of clusters, we evaluated various cluster solutions using three internal validity metrics: Silhouette score, Calinski-Harabasz index, and Davies-Bouldin index (Akhanli & Hennig, Citation2020; Arbelaitz et al., Citation2013). The Silhouette score measures the cohesion and separability between clusters, ranging from −1 to 1, with higher scores indicating better clustering. The Calinski-Harabasz index assesses clustering quality based on the distance from each point to the global and cluster centroids, while the Davies-Bouldin index compares within-cluster and between-cluster distances. The final number of clusters was determined by majority voting among the three metrics, with priority given to the Silhouette score in the event of a tie, due to its robustness (Arbelaitz et al., Citation2013).
The dimensionality reduction and clustering process was repeated for each considered speed independently and for the overall dataset, in which we included (i.e., concatenated) data from every speed. We shall refer to these two approaches as ‘single speed’ and ‘multispeed’, respectively. To assess the agreement between the clustering partitions resulting from each single speed and the multispeed approaches, the adjusted mutual information index (AMI) (Vinh et al., Citation2010) was calculated. The AMI adjusts for the agreement between two different partitions due to chance and ranges between 0 (random agreement) and 1 (perfect agreement).
The running kinematics of the resulting clusters were statistically compared using SPM1D for the 1D variables and discrete methods for the 0D variables (α = 0.05). Similarly, clusters were also compared for their running economy, demographics (sex and age), anthropometrics (height, body mass, trunk, leg, thigh, shank and foot length, and pelvis width), physiological capacity ( and lactate threshold), training (training days per week and weekly volume) and performance (10K time). Since the optimal number of clusters was found to be two for every condition, t-tests were used when the normality assumption was met and Mann–Whitney U tests otherwise for every continuous and ordinal 0D variable, whereas non-parametric SPM t-tests were used for the 1D variables. Nominal variables were compared using the
test. For the multispeed condition and running economy, parametric 2-way ANOVA with repeated measures and 1D non-parametric SPM 2-way ANOVA with repeated measures were used to assess the main effects of cluster, speed and the interaction between these two factors on 0D and 1D variables, respectively. Significant cluster and cluster x speed interaction effects were followed up by Bonferroni adjusted pairwise post hoc tests. For the 1D interaction effects, post hoc tests were conducted on the change of the variable from one speed with respect to (wrt) the previous one (i.e., change in variable at speed 12 km/h wrt to 11 km/h, and 13 km/h wrt 12 km/h). Cohen’s d effect sizes (Cohen, Citation1977) are reported for pairwise 0D comparisons. All the analyses were performed on Python 3.8, using the scikit-learn 1.3.8 (PCA, clustering and related analyses), pingouin 0.5.3 and spm1d 0.4.20 (statistics) packages. Data, environment file and code to replicate the current results can be found in https://github.com/adrianrivadulla/clustering_runners.
Results
For dimensionality reduction, 20 PCs were enough to account for 99% of the variance for the 11, 12 and 13 km/h datasets whereas 24 PCs were needed for the multispeed condition. These models reconstructed the data with mostly acceptable errors (Appendix). The Silhouette, Calinski-Harabasz and Davies-Bouldin scores agreed in indicating the optimal number of clusters was two (C0 and C1) regardless of the speed condition ().
Figure 1. Internal validity scores for clustering partitions with different number of clusters (k) for each single speed and the multispeed dataset.
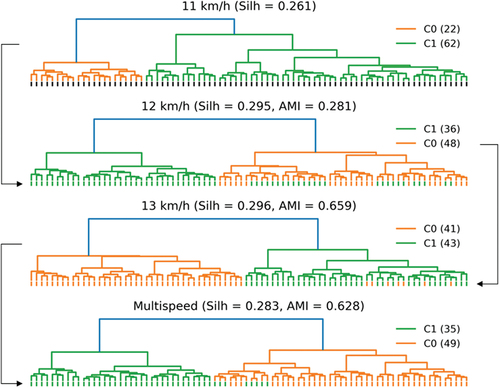
The agreement between clustering partitions at different speeds and the multispeed condition was generally low, implying that members of each cluster changed at 11, 12, 13 km/h and for the multispeed condition (). Since the clustering partitions changed for every single speed dataset, we considered the multispeed dataset the most comprehensive description available of runners’ technique. Therefore, the statistical comparisons between clusters presented hereafter used the clusters obtained by the multispeed model regardless of the speed being compared (comparisons of clusters derived from each individual speed dataset may be found in the Appendix).
Figure 2. Dendrogram for each speed condition. The bottom leaves of the tree represent each single runner in the dataset. The vertical length of the branch is proportional to the distance between the two clusters being merged. Vertical lines underneath each leaf are coloured according to the cluster membership for each participant in the previous condition in descending order as indicated by the black arrows on the sides e.g., vertical lines underneath the leaves at the multispeed dendrogram correspond to the cluster membership at 13 km/h. The reported AMI scores correspond to each cluster membership comparison, with respect to the previous condition.
The two-way ANOVA revealed a main effect of speed for every kinematic variable considered (see ) and a main effect of cluster for duty factor, trunk to pelvis, pelvis, hip and knee angles. Cluster follow-up post-hoc tests showed the C0 cluster exhibited greater duty factor at every speed (), less trunk-to-pelvis extension () a less anteriorly tilted pelvis (), and less hip flexion () throughout the entire gait cycle at every speed but no differences in knee () and ankle () angles. Because of the postural behaviour observed and for the sake of readability, we shall refer to C0 as the ‘neutral pelvis cluster’ and to C1 as the ‘tilted pelvis cluster’. During mid/late stance, there were significant interaction effects between cluster and speed for the vCOM, and hip, knee and ankle angles. Post-hoc analysis following significant cluster x speed interaction effects comparing the change in kinematic variables from one speed to another showed that the tilted pelvis cluster showed greater increase in vCOM (), alongside a greater increase in hip () and knee extension () and ankle dorsiflexion () towards the end of the contact phase when changing from 11 to 12 km/h compared to the neutral pelvis cluster. The average pattern for each cluster throughout the gait cycle can be visualised in .
Figure 3. 0D variables: Violin plots by cluster for stride frequency and duty factor. Main effects for cluster (C), speed (S) and interaction effect (CxS) are reported in the titles. A significant cluster effect on duty factor was found and posthoc tests results are reported underneath each graph. CT and ST in the Duty Factor y label correspond to contact time and stride time, respectively.
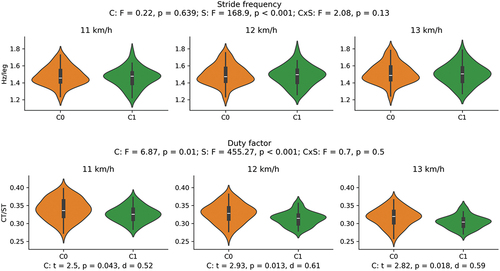
Figure 4. Main effect of speed on 1D variables: Average (and standard deviation cloud) stride pattern (0–100 % of time) for the entire sample at 11, 12 and 13 km/h, respectively. Vertical dotted lines represent the average toe-off for each speed. Grey patches represent areas of the gait cycle where a significant main effect of speed was found. Full statistics are reported in the Appendix.
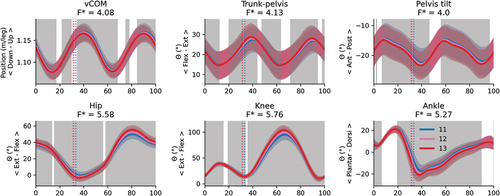
Figure 5. Cluster (C) and cluster x speed interaction effects (CxS) for the vCOM during the stride (foot-strike to foot-strike, 0–100%): Top row: Average vCOM displacement (and standard deviation cloud) for each cluster. Bottom row: Average change in vCOM displacement (and standard deviation cloud) for each cluster. Areas of the gait cycle where significant differences were found in post-hoc analysis following a significant cluster x speed interaction are highlighted in grey. Vertical dotted lines indicate the end of the average contact phase of the stride.
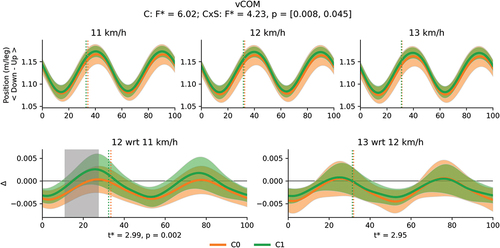
Figure 6. Cluster (C) and cluster x speed interaction effects (CxS) for the trunk-to-pelvis angle during the stride (foot-strike to foot-strike, 0–100%): Top row: Average trunk-to-pelvis angle (and standard deviation cloud) for each cluster. Areas of the gait cycle where significant differences were found in post-hoc analysis following a significant cluster effect are highlighted in grey. Bottom row: Average change in trunk-to-pelvis angle (and standard deviation cloud) for each cluster. Vertical dotted lines indicate the end of the average contact phase of the stride.
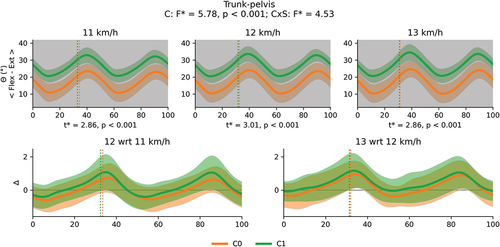
Figure 7. Cluster (C) and cluster x speed interaction effects (CxS) for the pelvis tilt angle during the stride (foot-strike to foot-strike, 0–100%): Top row: Average pelvis angle (and standard deviation cloud) for each cluster. Areas of the gait cycle where significant differences were found in pot-hoc analysis following a significant cluster effect are highlighted in grey. Bottom row: average change in pelvis angle (and standard deviation cloud) for each cluster. Vertical dotted lines indicate the end of the average contact phase of the stride.
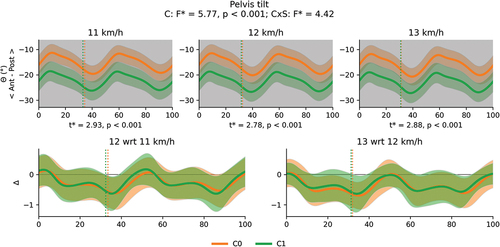
Figure 8. Cluster (C) and cluster x speed interaction effects (CxS) for the hip angle during the stride (foot-strike to foot-strike, 0–100%): Top row: Average hip angle (and standard deviation) cloud for each cluster. Areas of the gait cycle where significant differences were found in pot-hoc analysis following a significant cluster effect are highlighted in grey. Bottom row: Average change in hip angle (and standard deviation cloud) for each cluster. Areas of the gait cycle where significant differences were found in pot-hoc analysis following a significant cluster x speed interaction are highlighted in grey. Vertical dotted lines indicate the end of the average contact phase of the stride.
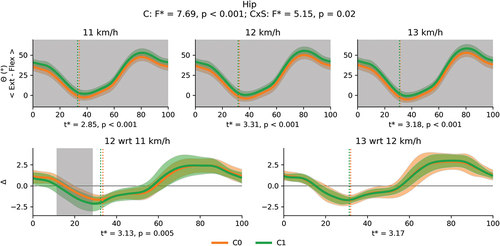
Figure 9. Cluster (C) and cluster x speed interaction effects (CxS) for the knee angle during the stride (foot-strike to foot-strike, 0–100%): Top row: Average knee angle (and standard deviation cloud) for each cluster. Bottom row: Average change in knee angle (and standard deviation cloud) for each cluster. Areas of the gait cycle where significant differences were found in pot-hoc analysis following a significant cluster x speed interaction are highlighted in grey. Vertical dotted lines indicate the end of the average contact phase of the stride.
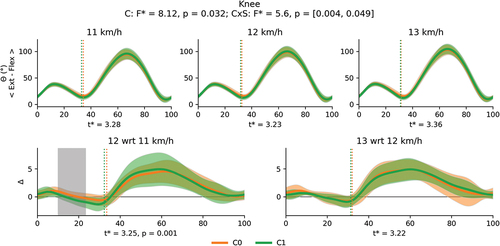
Figure 10. Cluster (C) and cluster x speed interaction effects (CxS) for the ankle angle during the stride (foot-strike to foot-strike, 0–100%): Top row: Average ankle angle (and standard deviation cloud) for each cluster. Bottom row: Average change in ankle angle (and standard deviation cloud) for each cluster. Areas of the gait cycle where significant differences were found in pot-hoc analysis following a significant cluster x speed interaction are highlighted in grey. Vertical dotted lines indicate the end of the average contact phase of the stride.
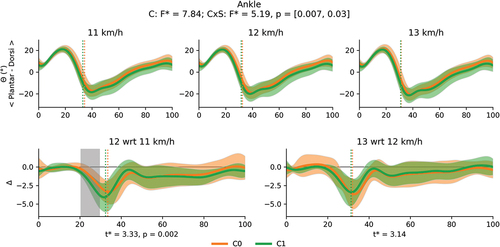
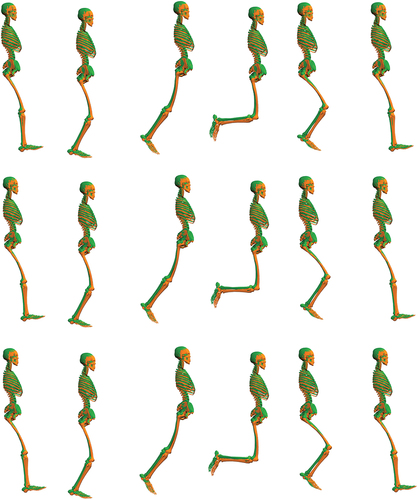
Figure 11. Time-synchronised visualisation of cluster average stride kinematics (C0 = neutral pelvis, in orange; C1 = tilted pelvis, in green) using a modified version of the 3DGaitModel2392 model (Delp et al., Citation2007) with just the right leg (only right leg data were considered in this study). The cluster average of each kinematic variable was prescribed to the model locking every other degree of freedom at 11 km/h (top), 12 km/h (middle) and 13 km/h (bottom). The segments of the model have been scaled to the average cluster segment length. The selected frames include foot-strike, mid-stance, toe-off, leg recovery, mid swing and foot strike.
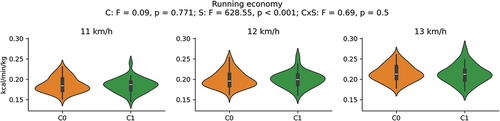
Despite the differences in their running technique, clusters did not exhibit significant differences in their running economy for each of the considered speeds ( and ).
Figure 12. Running economy by cluster for the three speeds considered. Main effects of cluster (C), speed (S) and interaction effect (CxS) are reported in the title.
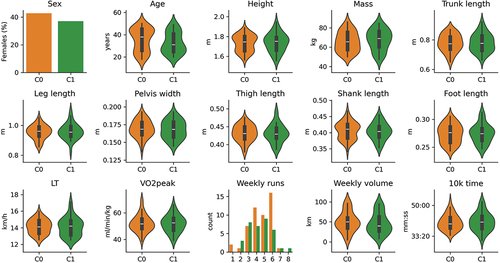
Similarly, clusters did not show differences in their demographics, anthropometrics, physiological capacity and training and performance ( and ).
Figure 13. Demographics, anthropometrics, physiological capacity, training and performance variables by cluster. No significant differences were found between clusters. Full statistics are reported in .
Discussion
This study aimed to cluster runners based on a comprehensive selection of kinematic variables describing running technique and then compare the resulting groups of runners for their kinematics, running economy, demographics, anthropometrics, physiological capacity, training and performance. The novelty of our work resides in the use of clustering to investigate the relationship between running technique and economy, and to provide an extensive pool of anatomical, physiological, training and performance characteristics to discuss their potential association with running technique-based clusters. We identified two clusters of runners who showed distinct kinematics: the ‘neutral pelvis’ cluster, whose runners showed less pelvic tilt, less trunk-to-pelvis extension and less hip flexion throughout the gait cycle and greater duty factor at every speed compared with the ‘tilted pelvis’ cluster. Athletes using these two running techniques did not show differences in their running economy in support of our hypothesis based on the self-optimisation and preferred movement path theories. Clusters did not show differences in their demographics, anthropometrics, physiological metrics, training and performance either suggesting each of these factors alone may not maximise kinematic differences in running technique. We also assessed whether clustering the same runners at different speeds independently would have led to consistent clustering partitions. Our results showed that this was not the case and therefore, clusters of runners found at one single speed may not generalise to a runner’s entire speed profile.
For this study, we aimed to recruit a sample of runners with a relatively consistent level of running capability, while acknowledging the diversity in sex and age typically present in the running population (Nesburg et al., Citation2023). Biomechanical differences in runners from different sexes (Xie et al., Citation2022) and ages (DeVita et al., Citation2016; Paquette et al., Citation2018) and interactions between age and sex (Boyer et al., Citation2017; Phinyomark et al., Citation2014), as well as athletic level (Clermont et al., Citation2017) are indeed typically used to justify runners’ subgrouping in biomechanics research. Despite the cluster differences in running kinematics and in agreement with previous clustering studies (Phinyomark et al., Citation2015; Senevirathna et al., Citation2023), there was a lack of evidence for any association between the two clusters and their underlaying demographics. It should be noted that although some studies have found differences in knee and hip flexion between males and females, sex differences may be primarily related to frontal and transverse plane kinematics (Phinyomark et al., Citation2014) which were not included in our analysis. Similarly, biomechanical changes associated with age within the considered age range (18–50) can be less apparent when training volume is matched (Paquette et al., Citation2018). Overall, it appears that sex and age may not be key determinants of maximal kinematic variance in running technique.
The observed differences in pelvic tilt, trunk-to-pelvis extension and hip angle between the neutral and the tilted pelvis cluster could be described as a near-constant offset throughout the entire gait cycle as opposed to gait phase specific. These could be two different strategies to keep the trunk upright depending on pelvic tilt: The more anterior pelvic tilt, the more trunk-to-pelvis extension is needed to keep the trunk up and the more flexed the hip is throughout the stride. Radiographic studies have shown pelvic tilt to be considerably variable in healthy individuals (standing pelvic tilt = −13 ± 6°, range [4.5, −27]) (Vialle et al., Citation2005). Indeed, in a retrospective analysis of the pelvic tilt during standing in the static calibration trial, we found that runners in the neutral pelvis cluster exhibited a more neutral pelvis compared to the tilted pelvis cluster (−12 ± 4° and −16 ± 3°, respectively; t = 4.75, p < 0.001, d = 1.06), which may contribute to explaining the observed differences during running. No other anthropometrics or anatomical differences were found between clusters. Insights into more complex anatomical aspects such as bony morphology, the multiple strong muscles actuating the pelvis and neuromuscular control strategies may be required to better understand the observed differences in pelvis orientation during standing and running. The large variability in features studied and methodological approaches taken in previous running clustering studies () prevent direct comparison with our current results. Considering the dual-axis framework (van Oeveren et al., Citation2021), the two found running techniques would fall somewhere in between the bounce (long flight time, closer to the tilted pelvis cluster) and stick (long contact time, closer to the neutral pelvis cluster) styles, also described as aerial and terrestrial runners in previous studies (Lussiana et al., Citation2017), since differences between clusters were found in duty factor but not in stride frequency. Nevertheless, the five running styles proposed in the dual-axis framework did not emerge in our dataset, in agreement with a recent running clustering study (Floría et al., Citation2024). Further research is warranted to elucidate how well the dual-axis framework can capture running styles and to integrate expert knowledge and data-driven approaches.
There were no significant differences in running economy at any speed between the two clusters suggesting the participants from this study were able to find two distinct running techniques at a similar energy cost, confirming our initial hypothesis. This finding aligns with the self-optimisation and preferred movement path theories, and reinforces the importance of running technique variability in research and training. Duty factor and pelvic tilt played a key role in defining the two kinematic patterns. It is believed that smaller duty factor can improve running economy (Nijs et al., Citation2022) and that pelvic tilt needs to be minimised to conserve energy and maintain efficiency (Novacheck, Citation1998; Schache et al., Citation1999; van Hooren, Lennartz, et al., Citation2024). Our results do not appear to support those statements like Lussiana et al. (Citation2017) and van Hooren, Jukic, et al. (Citation2024), who found no differences in running economy between aerial (small duty factor) and terrestrial (large duty factor) runners. It is also worth noting that the neutral pelvis cluster showed greater duty factor than the tilted pelvis cluster, which may be described as ‘the bitter with the sweet’. Running requires the coordinated action of the full body, and studies looking at one variable in isolation without considering or controlling the other components of the system may also contribute to the contrary findings about running technique and economy. Similarly, although greater pelvic tilt has been found in recreational runners compared to competitive runners (Clermont et al., Citation2017), the athletic level of the present sample can be defined as recreationally active to trained runners (McKay et al., Citation2022) with no differences in the physiological capacity ( and lactate threshold), training (running days a week, weekly distance run), and performance (10K times) between clusters. Ultimately, these results seem to build upon the idea that the search for one single most economical running technique model that every runner should strive for may be ill-posed, and that greater personalisation might be more appropriate (Moore, Citation2016; van Hooren et al., Citation2020).
The current results advocate for embracing inter-individual running technique variability in training too. ‘One size fits all’ training approaches may fail (or be suboptimal) to promote improvements to athletes’ running technique and economy. Coaches may choose to enhance a runner’s strengths while working on the weaknesses. For instance, despite the apparent lack of association of the tilted pelvis technique with worse economy and lower athletic-level in the present study, it is unclear whether this pattern may be detrimental compared to the neutral pelvis technique at faster speeds where greater hip extension may be required or as technique adapts to fatigue in a longer run. Under the assumption that a reduced duty factor and less anterior pelvic tilt can improve economy (Nijs et al., Citation2022; Schache et al., Citation1999; van Hooren, Lennartz, et al., Citation2024), neutral pelvis runners may benefit from maintenance strength work on the muscles stabilising the pelvis while trying to reduce duty factor since this may help at faster speeds (van Hooren, Jukic, et al., Citation2024). Runners in the tilted pelvis group on the other hand could increase core strength and hip mobility exercises in their training so their more anteriorly tilted pelvis position does not become a potential limitation at faster speeds or as fatigue develops. Nevertheless, it is important to stress that external validation and larger samples of runners are key to further establish the practical significance of these clusters. Working closely with coaches and running researchers is key in this sense to make the most of blending data-driven analysis and expert knowledge.
Comparing the multispeed and single speed clustering resulting partitions raised important considerations for the comprehensive representation of runners in clustering studies. The three single-speed clustering models and the multispeed model agreed in highlighting the distinct kinematic patterns between clusters previously discussed. However, the clustering solution at 11 km/h displayed a notable shift in cluster composition compared to the other speeds and members of the tilted pelvis cluster at this speed showed greater vCOM displacement and plantar flexion around foot contact (see Appendix). These results underscore the impact that clustering at a single speed may have on subsequent decision-making in training design and injury research. In this study, we proposed a simple alternative which was including data from several speeds in the clustering dataset. Due to the high correlations between data from different speeds, including three speeds in the multispeed dataset had a minimal impact in terms of the number of PCs required to capture 99% of the variance compared to single speed datasets (e.g., 24 PCs as opposed to 20 PCs) while still providing an appropriate representation of the data based on the reconstruction errors (Appendix). This approach circumvents the cluster agreement issues of single speed clustering, had minimal methodological considerations (e.g., small extra data collection and processing time) and provides a more comprehensive description of running technique. Furthermore, analysis across speeds allowed us to investigate whether runners with different kinematic patterns adapted to speed differently. There were general changes to running technique as speed increased () which were aligned with previous literature (Fukuchi et al., Citation2017; Orendurff et al., Citation2018). The tilted pelvis cluster also showed a greater increase in vCOM displacement () alongside greater hip () and knee () extension and ankle dorsiflexion () towards the end of the contact phase when changing from 11 to 12 km/h. Although the magnitude of these differences was marginal if we consider the reliability of marker-based motion capture (McGinley et al., Citation2009; Pohl et al., Citation2010), the question of whether these different cluster responses will accentuate at faster speeds remains.
It must be noted that the identified clusters may be sample and method dependent and other clustering algorithms may result in different clustering partitions. We chose agglomerative hierarchical clustering with Ward’s linkage, a popular algorithm in the data mining literature and in previous running biomechanics clustering studies (), but this approach is known to be sensitive to outliers and to favour spheroidal clusters regardless of the natural configuration of the data (Zimmerman et al., Citation1982). Density-based methods such as HDBSCAN (Campello et al., Citation2013) may help dealing with outliers and finding shape assumption free clusters, but they typically require larger datasets than what we had available. Larger samples and a thorough exploration of clustering algorithms may help reinforce the present clusters or to find more robust ones. The resulting clusters are variable dependent. We focused on sagittal plane variables because most body movements in running occur in this plane and energy expenditure during running is mostly determined by sagittal plane motion (Arellano & Kram, Citation2014; van Hooren, Lennartz, et al., Citation2024). As such, it is believed different running patterns should emerge in these variables (van Oeveren et al., Citation2021). The treadmill protocol using a 1% gradient was designed to replicate the energetic demands of overground running (Jones & Doust, Citation1996) but more recent work has indicated that a 0% gradient can be appropriate to replicate the oxygen cost of running at submaximal speeds (Miller et al., Citation2019). A 0% gradient can be more representative of overground running kinematics and may be considered in future studies investigating running technique and economy. We allowed participants to use their preferred footwear to capture their habitual running pattern. However, footwear can affect lower limb biomechanics (Nigg et al., Citation2012) and running economy (Hoogkamer et al., Citation2018), potentially acting as a confounding factor in the clustering process and running economy comparison. Information about the shoe-type used by the runners could have added to the discussion. Including kinematic variability, kinetic, and muscle activity variables could also help both enrich the definition of running technique and the discussion of the found clusters, representing an area to be explored in future studies. Finally, the identified clusters respond to a mathematical optimum (i.e., maximum Silhouette score) and close work with running coaches is key for the external validation of the present results and to maximise the usefulness and impact of the present results in running practice.
Conclusions
We have investigated running technique in healthy trained runners and identified two distinct running patterns characterised by a neutral pelvis and larger duty factor (neutral pelvis cluster) versus a more tilted pelvis and shorter duty factor (tilted pelvis cluster). These differences were close to constant throughout the stride and we suspect trunk-to-pelvis angle and hip flexion are adjustments to compensate for variability in pelvic tilt to keep the trunk upright. These patterns were identified at three different speeds so they may represent individual preferences for such patterns regardless of the speed athletes are running at. These two techniques seemed similarly economical and they were not associated with the demographics, anthropometrics, physiological capacity and athletic performance level of the cluster members. Coaches are advised to consider inter-individual differences in running technique to enhance runners’ strengths while working on their weaknesses when designing their training programmes to achieve greater response from their athletes as opposed to ‘one size fits all’ approaches. From a methodological perspective, clustering at different speeds independently led to different cluster memberships being formed and additional kinematic differences being found between clusters. We suggest researchers should consider including several speeds in their clustering studies to obtain a more comprehensive representation of runners’ technique, since single speed clustering of the same athletes at different speeds can lead to different cluster make-up and affect subsequent analysis and decision-making.
Supplemental Material
Download PDF (1.3 MB)Acknowledgments
The authors would like to thank Mr. Andrew Hammocks for his assistance in data collection for this study.
Disclosure statement
No potential conflict of interest was reported by the author(s).
Supplementary material
Supplemental data for this article can be accessed online at https://doi.org/10.1080/14763141.2024.2372608
Additional information
Funding
References
- Akhanli, S. E., & Hennig, C. (2020). Comparing clusterings and numbers of clusters by aggregation of calibrated clustering validity indexes. Statistics and Computing, 30(5), 1523–1544. https://doi.org/10.1007/s11222-020-09958-2
- Aljohani, M., & Kipp, K. (2020). Use of self-organizing maps to study sex-and speed-dependent changes in running biomechanics. Human Movement Science, 72, 102649. https://doi.org/10.1016/j.humov.2020.102649
- Andreacci, J. L., Lemura, L. M., Cohen, S. L., Ethan, A., Chelland, S. A., & von Duvillard, S. P. (2010). The effects of frequency of encouragement on performance during maximal exercise testing. Journal of Sports Sciences, 20(4), 345–352. https://doi.org/10.1080/026404102753576125
- Arbelaitz, O., Gurrutxaga, I., Muguerza, J., Pérez, J. M., & Perona, I. (2013). An extensive comparative study of cluster validity indices. Pattern recognition, 46(1), 243–256. https://doi.org/10.1016/j.patcog.2012.07.021
- Arellano, C. J., & Kram, R. (2014). Partitioning the metabolic cost of human running: A task-by-task approach. Integrative and Comparative Biology, 54(6), 1084–1098. https://doi.org/10.1093/icb/icu033
- Aroganam, G., Manivannan, N., & Harrison, D. (2019). Review on wearable technology sensors used in consumer sport applications. Sensors, 19(9). https://doi.org/10.3390/s19091983
- Barnes, K. R., & Kilding, A. E. (2015). Running economy: Measurement, norms, and determining factors. Sports Medicine - Open, 1(1), 1–15. https://doi.org/10.1186/s40798-015-0007-y
- Beck, O. N., Kipp, S., Byrnes, W. C., & Kram, R. (2018). Last word on viewpoint: Use aerobic energy expenditure instead of oxygen uptake to quantify exercise intensity and predict endurance performance. Journal of Applied Physiology, 125(2), 675. https://doi.org/10.1152/japplphysiol.00356.2018
- Bentley, D. J., Newell, J., & Bishop, D. (2007). Incremental exercise test design and analysis: Implications for performance diagnostics in endurance athletes. Sports Medicine, 37(7), 575–586. https://doi.org/10.2165/00007256-200737070-00002
- Boyer, K. A., Freedman Silvernail, J., & Hamill, J. (2017). Age and sex influences on running mechanics and coordination variability. Journal of Sports Sciences, 35(22), 2225–2231. https://doi.org/10.1080/02640414.2016.1265139
- Bramah, C., Preece, S. J., Gill, N., & Herrington, L. (2018). Is there a pathological gait associated with common soft tissue running injuries? The American Journal of Sports Medicine, 46(12), 3023–3031. https://doi.org/10.1177/0363546518793657
- Campello, R. J. G. B., Moulavi, D., & Sander, J. (2013). Density-based clustering based on hierarchical density estimates. In Pacific-Asia Conference on Knowledge Discovery and Data Mining (pp. 160–172). https://doi.org/10.1007/978-3-642-37456-2_14
- Cavanagh, P., & Williams, K. (1982). The effect of stride length variation on oxygen uptake during distance running. Medicine and Science in Sports and Exercise, 14(1), 30–35. https://doi.org/10.1249/00005768-198201000-00006
- Ceyssens, L., Vanelderen, R., Barton, C., Malliaras, P., & Dingenen, B. (2019). Biomechanical risk factors associated with running-related injuries: A systematic review. Sports Medicine, 49(7), 1095–1115. https://doi.org/10.1007/s40279-019-01110-z
- Cheng, B., Kuipers, H., Snyder, A. C., Keizer, H. A., Jeukendrup, A., & Hesselink, M. (1992). A new approach for the determination of ventilatory and lactate thresholds. International Journal of Sports Medicine, 13(7), 518–522. https://doi.org/10.1055/s-2007-1021309
- Clermont, C. A., Osis, S. T., Phinyomark, A., & Ferber, R. (2017). Kinematic gait patterns in competitive and recreational runners. Journal of Applied Biomechanics, 33(4), 268–276. https://doi.org/10.1123/jab.2016-0218
- Cohen, J. (1977). CHAPTER 2 – the t Test for Means. Statistical Power Analysis for the Behavioral Sciences, 19–74. https://doi.org/10.1016/B978-0-12-179060-8.50007-4
- Delp, S. L., Anderson, F. C., Arnold, A. S., Loan, P., Habib, A., John, C. T., & Thelen, D. G. (2007). OpenSim: Open-source software to create and analyze dynamic simulations of movement. IEEE Transactions on Biomedical Engineering, 54(11), 1940–1950. https://doi.org/10.1109/TBME.2007.901024
- DeVita, P., Fellin, R. E., Seay, J. F., Ip, E., Stavro, N., & Messier, S. P. (2016). The relationships between age and running biomechanics. Medicine and Science in Sports and Exercise, 48(1), 98–106. https://doi.org/10.1249/MSS.0000000000000744
- Faude, O., Meyer, T., & Kindermann, W. (2009). Lactate Threshold Concepts How Valid are They? Sports Medicine, 39(6), 469–490. https://www.researchgate.net/publication/24437984_Lactate_Threshold_Concepts_How_Valid_are_They
- Floría, P., Harrison, A. J., Rojo-Álvarez, J. L., Francisco, M., Sanchez-Sixto, A., Floría, P., Harrison, A. J., Rojo-Álvarez, J. L., Francisco, M., Floría, P., Harrison, A. J., & Melgarejo-Meseguer, F. M. (2024). Joint movement patterns differ among male recreational runners with different running style. Sports Biomechanics, 1–12. https://doi.org/10.1080/14763141.2023.2298947
- Folland, J. P., Allen, S. J., Black, M. I., Handsaker, J. C., & Forrester, S. E. (2017). Running technique is an important component of running economy and performance. Medicine and Science in Sports and Exercise, 49(7), 1412–1423. https://doi.org/10.1249/MSS.0000000000001245
- Forrester, S. E., & Townend, J. (2015). The effect of running velocity on footstrike angle - A curve-clustering approach. Gait and Posture, 41(1), 26–32. https://doi.org/10.1016/j.gaitpost.2014.08.004
- Fukuchi, R. K., Fukuchi, C. A., & Duarte, M. (2017). A public dataset of running biomechanics and the effects of running speed on lower extremity kinematics and kinetics. PeerJ, 5, 3298. https://doi.org/10.7717/peerj.3298
- García-Pinillos, F., Soto-Hermoso, V. M., & Latorre-Román, P. A. (2017). How does high-intensity intermittent training affect recreational endurance runners? Acute and chronic adaptations: A systematic review. Journal of Sport and Health Science, 6(1), 54–67. https://doi.org/10.1016/j.jshs.2016.08.010
- Guidetti, L., Meucci, M., Bolletta, F., Emerenziani, G. P., Gallotta, M. C., Baldari, C., & Zagatto, A. M. (2018). Validity, reliability and minimum detectable change of COSMED K5 portable gas exchange system in breath-by-breath mode. PLOS ONE, 13(12), 1–12. https://doi.org/10.1371/journal.pone.0209925
- Hoerzer, S., von Tscharner, V., Jacob, C., & Nigg, B. M. (2015). Defining functional groups based on running kinematics using self-organizing maps and support vector machines. Journal of Biomechanics, 48(10), 2072–2079. https://doi.org/10.1016/j.jbiomech.2015.03.017
- Hoogkamer, W., Kipp, S., Frank, J. H., Farina, E. M., Luo, G., & Kram, R. (2018). A comparison of the energetic cost of running in marathon racing shoes. Sports Medicine, 48(4), 1009–1019. https://doi.org/10.1007/s40279-017-0811-2
- Jauhiainen, S., Pohl, A. J., Äyrämö, S., Kauppi, J. P., & Ferber, R. (2020). A hierarchical cluster analysis to determine whether injured runners exhibit similar kinematic gait patterns. Scandinavian Journal of Medicine and Science in Sports, 30(4), 732–740. https://doi.org/10.1111/sms.13624
- Jeukendrup, A. E., & Wallis, G. A. (2005). Measurement of substrate oxidation during exercise by means of gas exchange measurements. International Journal of Sports Medicine, Supplement, 26, 528–537. https://doi.org/10.1055/s-2004-830512
- Jollife, I. T., & Cadima, J. (2016). Principal component analysis: A review and recent developments. Philosophical Transactions of the Royal Society A: Mathematical, Physical and Engineering Sciences, 374(2065). https://doi.org/10.1098/rsta.2015.0202
- Jones, A. M., & Doust, J. H. (1996). A 1% treadmill grade most accurately reflects the energetic cost of outdoor running. Journal of Sports Sciences, 14(4), 321–327. https://doi.org/10.1080/02640419608727717
- Kipp, S., Kram, R., & Hoogkamer, W. (2019). Extrapolating metabolic savings in running: Implications for performance predictions. Frontiers in Physiology, 10(February), 1–8. https://doi.org/10.3389/fphys.2019.00079
- Lussiana, T., Gindre, C., Hebert-Losier, K., Sagawa, Y., Gimenez, P., & Mourot, L. (2017). Similar running economy with different running patterns along the aerial-terrestrial continuum. International Journal of Sports Physiology and Performance, 12(4), 481–489. https://doi.org/10.1123/ijspp.2016-0107
- Martin, J. A., Stiffler-Joachim, M. R., Wille, C. M., & Heiderscheit, B. C. (2022). A hierarchical clustering approach for examining potential risk factors for bone stress injury in runners. Journal of Biomechanics, 141(5), 111136. https://doi.org/10.1016/j.jbiomech.2022.111136
- McGinley, J. L., Baker, R., Wolfe, R., & Morris, M. E. (2009). The reliability of three-dimensional kinematic gait measurements: A systematic review. Gait and Posture, 29(3), 360–369. https://doi.org/10.1016/j.gaitpost.2008.09.003
- McKay, A. K. A., Stellingwerff, T., Smith, E. S., Martin, D. T., Mujika, I., Goosey-Tolfrey, V. L., Sheppard, J., & Burke, L. M. (2022). Defining training and performance caliber: A participant classification framework. International Journal of Sports Physiology and Performance, 17(2), 317–331. https://doi.org/10.1123/ijspp.2021-0451
- Midgley, A. W., Earle, K., McNaughton, L. R., Siegler, J. C., Clough, P., & Earle, F. (2017). Exercise tolerance during VO2max testing is a multifactorial psychobiological phenomenon. Research in Sports Medicine, 25(4), 480–494. https://doi.org/10.1080/15438627.2017.1365294
- Miller, J. R., Van Hooren, B., Bishop, C., Buckley, J. D., Willy, R. W., & Fuller, J. T. (2019). A systematic review and meta-analysis of crossover studies comparing physiological, perceptual and performance measures between treadmill and overground running. Sports Medicine, 49(5), 763–782. https://doi.org/10.1007/s40279-019-01087-9
- Moore, I. S. (2016). Is there an economical running technique? A review of modifiable biomechanical factors affecting running economy. Sports Medicine, 46(6), 793–807. https://doi.org/10.1007/s40279-016-0474-4
- Moore, I. S., Ashford, K. J., Cross, C., Hope, J., Jones, H. S. R., & McCarthy-Ryan, M. (2019). Humans Optimize Ground Contact Time and leg stiffness to minimize the metabolic cost of running. Frontiers in Sports and Active Living, 1(November), 1–10. https://doi.org/10.3389/fspor.2019.00053
- Moran, M. F., & Wager, J. C. (2020). Influence of gait retraining on running economy: A review and potential applications. Strength and Conditioning Journal, 42(1), 12–23. https://doi.org/10.1519/SSC.0000000000000511
- Nesburg, R. A., Mason, A. P., Fitzsimmons, B., & Hunter, S. K. (2023). Sex Differences in Marathon Running: Physiology and Participation. Exercise, Sport and Movement, 1(3), 1–8. https://doi.org/10.1249/esm.0000000000000010
- Nigg. (2010). Biomechanics of Sport Shoes. Topline Printing.
- Nigg, B. M., Baltich, J., Maurer, C., & Federolf, P. (2012). Shoe midsole hardness, sex and age effects on lower extremity kinematics during running. Journal of Biomechanics, 45(9), 1692–1697. https://doi.org/10.1016/j.jbiomech.2012.03.027
- Nigg, B. M., Vienneau, J., Smith, A. C., Trudeau, M. B., Mohr, M., & Nigg, S. R. (2017). The preferred movement path paradigm: Influence of running shoes on joint movement. Medicine & Science in Sports & Exercise, 49(8), 1641–1648. https://doi.org/10.1249/MSS.0000000000001260
- Nijs, A., Roerdink, M., & Beek, P. J. (2022). Running-style modulation: Effects of stance-time and flight-time instructions on duty factor and cadence. Gait and Posture, 98(October), 283–288. https://doi.org/10.1016/j.gaitpost.2022.10.002
- Novacheck, T. F. (1998). The biomechanics of running. Gait and Posture, 7(1), 77–95. https://doi.org/10.1016/S0966-6362(97)00038-6
- Orendurff, M. S., Kobayashi, T., Tulchin-Francis, K., Tullock, A. M. H., Villarosa, C., Chan, C., Kraus, E., & Strike, S. (2018). A little bit faster: Lower extremity joint kinematics and kinetics as recreational runners achieve faster speeds. Journal of Biomechanics, 71, 167–175. https://doi.org/10.1016/j.jbiomech.2018.02.010
- Osis, S. T., Hettinga, B. A., Macdonald, S., Ferber, R., & Lucia, A. (2016). Effects of simulated marker placement deviations on running kinematics and evaluation of a morphometric-based placement feedback method. Public Library of Science One, 11(1), 1–13. https://doi.org/10.1371/journal.pone.0147111
- Paquette, M. R., Devita, P., & Williams, D. S. B. (2018). Biomechanical implications of training volume and intensity in aging runners. Medicine and Science in Sports and Exercise, 50(3), 510–515. https://doi.org/10.1249/MSS.0000000000001452
- Phinyomark, A., Hettinga, B. A., Osis, S. T., Ferber, R., & Zadpoor, A. A. (2014). Gender and age-related differences in bilateral lower extremity mechanics during treadmill running. PLOS ONE, 9(8), e105246. https://doi.org/10.1371/journal.pone.0105246
- Phinyomark, A., Osis, S., Hettinga, B. A., & Ferber, R. (2015). Kinematic gait patterns in healthy runners: A hierarchical cluster analysis. Journal of Biomechanics, 48(14), 3897–3904. https://doi.org/10.1016/j.jbiomech.2015.09.025
- Pohl, M. B., Lloyd, C., & Ferber, R. (2010). Can the reliability of three-dimensional running kinematics be improved using functional joint methodology? Gait and Posture, 32(4), 559–563. https://doi.org/10.1016/j.gaitpost.2010.07.020
- Reinschmidt, C., van den Bogert, A., Nigg, B., Lundberg, A., & Murphy, N. (1997). Effect of skin movement on the analysis of skeletal knee joint motion during running. Journal of Biomechanics, 30(7), 729–732. https://doi.org/10.1016/S0021-9290(97)00001-8
- Rivadulla, A., Chen, X., Weir, G., Cazzola, D., Trewartha, G., Hamill, J., Preatoni, E., & Mourot, L. (2021). Development and validation of FootNet; a new kinematic algorithm to improve foot-strike and toe-off detection in treadmill running. Public Library of Science One, 16(8), 1–16. https://doi.org/10.1371/journal.pone.0248608
- Robergs, R. A., Dwyer, D., & Astorino, T. (2010). Recommendations for improved data processing from expired gas analysis indirect calorimetry. Sports Medicine, 40(2), 95–111. https://doi.org/10.2165/11319670-000000000-00000
- Santos-Concejero, J., Tucker, R., Granados, C., Irazusta, J., Bidaurrazaga-Letona, I., Zabala-Lili, J., & Gil, S. M. (2014). Influence of regression model and initial intensity of an incremental test on the relationship between the lactate threshold estimated by the maximal-deviation method and running performance. Journal of Sports Sciences, 32(9), 853–859. https://doi.org/10.1080/02640414.2013.862844
- Schache, A. G., Bennell, K. L., Blanch, P. D., & Wrigley, T. V. (1999). The coordinated movement of the lumbo-pelvic-hip complex during running: A literature review. Gait and Posture, 10(1), 30–47. https://doi.org/10.1016/S0966-6362(99)00025-9
- Scheerder, J., Breedveld, K., & Borgers, J. (Eds.). (2015). Running across Europe: The rise and size of one of the largest sport markets. Palgrave Macmillan.
- Senevirathna, A. M., Pohl, A. J., Jordan, M. J., Edwards, W. B., & Ferber, R. (2023). Differences in kinetic variables between injured and uninjured rearfoot runners: A hierarchical cluster analysis. Scandinavian Journal of Medicine and Science in Sports, 33(2), 160–168. https://doi.org/10.1111/sms.14249
- Tartaruga, M. P., Tartaruga, M. P., Brisswalter, J., Peyré-Tartaruga, L. A., Alberton, C. L., Cadore, E. L., Tiggemann, C. L., Silva, E. M., Kruel, L. F. M., Ávila, A. O. V., & Coertjens, M. (2012). The relationship between running economy and biomechanical variables in distance runners. Research Quarterly for Exercise and Sport, 83(3), 367–375. https://doi.org/10.1080/02701367.2012.10599870
- USATF. (2020). Age-Grade Tables of the Masters Long Distance Running Council. http://howardgrubb.co.uk/athletics/mldrroad20.html
- van Hooren, B., Goudsmit, J., Restrepo, J., & Vos, S. (2020). Real-time feedback by wearables in running: Current approaches, challenges and suggestions for improvements. Journal of Sports Sciences, 38(2), 214–230. https://doi.org/10.1080/02640414.2019.1690960
- van Hooren, B., Jukic, I., Cox, M., Frenken, K. G., Bautista, I., & Moore, I. S. (2024). The Relationship Between Running Biomechanics and Running Economy: A Systematic Review and Meta-Analysis of Observational Studies. Sports Medicine, 54(5), 1269–1316. https://doi.org/10.1007/s40279-024-01997-3
- van Hooren, B., Lennartz, R., Cox, M., Hoitz, F., Plasqui, G., & Meijer, K. (2024). Differences in running technique between runners with better and poorer running economy and lower and higher milage: An artificial neural network approach. Scandinavian Journal of Medicine and Science in Sports, 34(3), 1–18. https://doi.org/10.1111/sms.14605
- van Hooren, B., van Der Lee, P., Plasqui, G., & Bongers, B. C. (2024). The effect of a standardized verbal encouragement protocol on peak oxygen uptake during incremental treadmill testing in healthy individuals: A randomized cross-over trial. European Journal of Sport Science, 24(1), 16–25. https://doi.org/10.1002/ejsc.12044
- Vannatta, C. N., Heinert, B. L., & Kernozek, T. W. (2020). Biomechanical risk factors for running-related injury differ by sample population: A systematic review and meta-analysis. Clinical Biomechanics, 75, 104991. https://doi.org/10.1016/j.clinbiomech.2020.104991
- van Oeveren, B. T., de Ruiter, C. J., Beek, P. J., & van Dieën, J. H. (2021). The biomechanics of running and running styles: A synthesis. Sports Biomechanics, 1–39. https://doi.org/10.1080/14763141.2021.1873411
- Vialle, R., Levassor, N., Rillardon, L., Templier, A., Skalli, W., & Guigui, P. (2005). Radiographic analysis of the sagittal alignment and balance of the spine in asymptomatic subjects. Journal of Bone and Joint Surgery, 87(2), 260–267. https://doi.org/10.2106/JBJS.D.02043
- Vinh, N. X., Epps, J., & Bailey, J. (2010). Information theoretic measures for clusterings comparison: Variants, properties, normalization and correction for chance. Journal of Machine Learning Research, 11, 2837–2854.
- Ward, J. H., Jr. (1963). Hierarchical grouping to optimize an objective function. Journal of the American Statistical Association, 58(301), 236–244.
- Watari, R., Osis, S. T., Phinyomark, A., & Ferber, R. (2018). Runners with patellofemoral pain demonstrate sub-groups of pelvic acceleration profiles using hierarchical cluster analysis: An exploratory cross- sectional study. BMC Musculoskeletal Disorders, 19(1), 1–10. https://doi.org/10.1186/s12891-018-2045-3
- Watari, R., Suda, E. Y., Santos, J. P. S., Matias, A. B., Taddei, U. T., & Sacco, I. C. N. (2021). Subgroups of foot-ankle movement patterns can influence the responsiveness to a foot-core exercise program: A hierarchical cluster analysis. Frontiers in Bioengineering and Biotechnology, 9(June), 1–13. https://doi.org/10.3389/fbioe.2021.645710
- Williams, K. R., & Cavanagh, P. R. (1987). Relationship between distance running mechanics, running economy, and performance. Journal of Applied Physiology, 63(3), 1236–1245. https://doi.org/10.1152/jappl.1987.63.3.1236
- Willy, R. W., & Paquette, M. R. (2019). The physiology and biomechanics of the master runner. Sports Medicine and Arthroscopy Review, 27(1), 15–21. https://doi.org/10.1097/JSA.0000000000000212
- Xie, P. P., István, B., & Liang, M. (2022). Sex-specific differences in biomechanics among runners: A systematic review with meta-analysis. Frontiers in Physiology, 13(September), 1–11. https://doi.org/10.3389/fphys.2022.994076
- Zimmerman, R., Jacobs, R., & Farr, J. (1982). A comparison of the accuracy of four methods for clustering jobs. Applied Psychological Measurement, 6(3), 353–366. https://doi.org/10.1177/014662168200600311