
 ?Mathematical formulae have been encoded as MathML and are displayed in this HTML version using MathJax in order to improve their display. Uncheck the box to turn MathJax off. This feature requires Javascript. Click on a formula to zoom.
ABSTRACT
This study examined the effects of three external verbal cues on countermovement rebound jump (CMRJ) performance. Twenty-five recreational athletes completed nine jumps with distinct height, velocity and combined cue focus. A general linear model analysis of variance was used to evaluate systematic bias between conditions (p < 0.05). The height and velocity cues significantly altered jump height and contact times in both jumps during the CMRJ, respectively (p ≤ 0.002). The combined cue significantly reduced contact time while increasing leg stiffness compared to the height cue (p ≤ 0.038). It also increased jump height compared to the velocity cue (p ≤ 0.005) in both jumps, resulting in the highest explosive power and reactive strength values among all conditions. Furthermore, the combined cue enhanced the positive ankle contribution compared to the height cue (p = 0.020) and increased positive hip and negative knee joint work compared to the velocity cue (p ≤ 0.040) in the second jump of the CMRJ. These findings advise practitioners to use the height cue to maximise jump height, the velocity cue to minimise contact times and the combined cue to maximise explosive power and reactive strength.
Introduction
Jump testing has become commonplace within the context of testing for strength and conditioning or sports science (L. Barker et al., Citation2021), with a variety of metrics often measured to monitor the efficacy of training programmes (Cormie et al., Citation2009). The countermovement jump (CMJ) and drop jump (DJ) are two well-recommended tests to evaluate slow and fast stretch-shortening cycle (SSC) mechanics, respectively (Kipp et al., Citation2016; Xu, Turner, et al., Citation2023). Related to these two tests, and largely under-investigated, is the countermovement rebound jump (CMRJ), which encompasses the movement characteristics of both CMJ and DJ. Specifically, the CMRJ involves two continuous vertical jumps where athletes perform the first CMJ (i.e., CMRJ1), followed by a rapid rebound jump (i.e., CMRJ2), immediately after landing from CMRJ1 (Xu et al., Citation2023a). To provide an understanding of both outcome measures and jump strategies utilised during jump testing, Bishop, Turner, et al. (Citation2021) suggested practitioners monitor metrics such as countermovement depth, time to take-off (TTTO), jump height and reactive strength index modified (i.e., RSImod, a ratio between jump height and TTTO) in the CMJ. For the DJ, metrics such as leg stiffness, ground contact time (GCT), jump height and reactive strength index (i.e., RSI, a ratio between jump height and GCT) have also been suggested, as they inter-link with one another, enabling a better chance for multiple data to be used concurrently in practice (Bishop, Turner, et al., Citation2021). In line with this, and to comprehensively monitor an athlete’s CMRJ performance, Xu et al. (Citation2023b) evaluated all the aforementioned metrics in the CMJ, DJ and CMRJ tests, which showed the CMRJ to be a viable alternative to the CMJ and DJ tests, owing to very little differences in comparable metrics over two testing sessions.
In the realm of jump testing, the role of verbal cues is paramount in order to optimise jump performance (Winkelman, Citation2018). The use of external verbal cues directs an athlete’s attention to focus on the movement outcomes, whereas internal cues typically focus on an athlete’s attention towards specific body segments (Barillas et al., Citation2021). These cues can be manipulated when aiming to positively or negatively impact metrics measured during the CMJ and DJ, therefore, should be used appropriately to ensure that practitioners gain an accurate reflection of an athlete’s jump capabilities (Barillas et al., Citation2023; L. Barker et al., Citation2021; Oliver et al., Citation2021; Sánchez-Sixto et al., Citation2021; Yokoyama et al., Citation2019). In CMJ studies, a larger RSImod value (indicating that the athlete can produce a higher jump height in a shorter amount of time) has been reported if athletes were instructed to jump quicker (RSImod: 0.57 ± 0.12) compared to instructions aiming to jump higher (RSImod: 0.49 ± 0.10, effect size [ES] = 0.79, p = 0.002) (Sánchez-Sixto et al., Citation2021). In line with the previous findings, Barillas et al. (Citation2023) revealed that the verbal cue that focused on the maximum jump height stimulated a significantly higher jump height compared to using the standard cue (i.e., ‘jump as fast as you can, getting as high as you can’; Hedges’ g = 0.43, p = 0.02) and velocity cue (i.e., ‘get off the ground as fast as you can’; g = 0.52, p = 0.01). In addition, the authors also observed that using the velocity cue significantly reduced TTTO (g = 1.12 to 1.52, p = 0.05) compared to the other two cues and significantly increased the RSImod value compared to the maximal jump height cue (g = 1.50, p = 0.01) (Barillas et al., Citation2023).
During the DJ test, L. Barker et al. (Citation2021) observed a large increase in RSI (mean difference: 0.36 ± 1.04, ES = 1.25) along with a small decrease in jump height (mean difference: −0.033 ± 0.007 m, ES = −0.41) when cueing athletes to minimise the GCT (e.g., ‘spending as little amount of time on the ground as possible’) compared to the verbal cues of maximising the jump height (e.g., ‘focusing on reaching as high as possible’). Similarly, a recent study reported a significantly higher jump height (33.33 ± 5.62 centimetres [cm]) and longer GCT (0.49 ± 0.11 second [s]) when instructing athletes to jump with maximal effort compared to instructing them to jump quickly with less time on the ground (jump height: 29.32 ± 6.04 cm, p < 0.05; GCT: 0.34 ± 0.72 s, p < 0.05) (Yokoyama et al., Citation2019). In addition, the angular displacements of three lower limb joints (i.e., hip, knee and ankle joints) were significantly smaller using velocity focused cues than using height focused cues and lower limb triple-extension cues, although the authors in this study did not provide any indication of practical differences (i.e., ES values) (Khuu et al., Citation2015). It has been shown consistently that in both the CMJ and DJ tests, higher JHs are achieved when verbal cues were focused on maximising jump height. In contrast, shorter TTTO/GCT along with the larger RSImod/RSI values have been observed when giving instructions to minimise the duration of ground contact prior to the instant of take-off (L. Barker et al., Citation2021; Winkelman, Citation2018; Yokoyama et al., Citation2019). Noting that, when cueing athletes to spend a minimal amount of time on the ground, their TTTO and GCT decreased significantly whilst the jump height decreased slightly, this disproportionate decrease between variables eventually resulted in a larger increase in the RSImod and RSI values (L. Barker et al., Citation2021; Sánchez-Sixto et al., Citation2021).
Existing research that has investigated CMRJ performance used the verbal cue ‘jump as fast and high as possible’ without providing additional cues to intentionally maximise displacement or quickness of jumps (Xu et al., Citation2023a, Citation2023b; Xu, Jordan, et al., Citation2023). Note that the RSImod/RSI values are comprised of two components and altering either the jump height or TTTO/GCT will affect the subsequent ratio values, which in turn, is likely to result in a somewhat inaccurate reflection of the true jump capacity (Bishop et al., Citation2022). However, there is a distinct lack of empirical research to explore whether using different verbal cues might change the jump strategies utilised in the CMRJ, resulting in different performance and kinetic metrics (i.e., individual joint work and contribution to the total work done). By investigating the effects of different verbal cues, practitioners could gain an appreciation into which methods maximise the performance of both jumps in the CMRJ simultaneously. Furthermore, the use of external cues only is aligned with the Optimizing Performance through Intrinsic Motivation and Attention for Learning (OPTIMAL) theory, which highlights that incorporating external verbal cues is believed to enhance motor skill learning by fostering positive expectancies, providing learner autonomy and promoting goal-action coupling (McNicholas & Comyns, Citation2020). The theory contends that an external focused cue, particularly on the intended movement outcomes, facilitates automatic and efficient movements, rendering external cues more favourable than internal for optimising jump performance (McNicholas & Comyns, Citation2020; Wulf & Lewthwaite, Citation2016).
Therefore, this study endeavoured to examine the effect of three external verbal cues on a battery of metrics measured during both jumps of the CMRJ test. The hypothesis was that i) using a height cue (HC) would result in a maximum jump height with the longest time spent on the ground; ii) using a velocity cue (VC) would result in a minimum time spent on the ground (but at the cost of reduced jump height); iii) using the combined cue (CC) would result in maximum RSImod/RSI values simultaneously in both jumps of the CMRJ. Of note, utilising appropriate verbal cues enables practitioners to obtain a real reflection of both slow and fast SSC mechanics, especially when aiming to use distinct CMRJ metrics for the detection of meaningful change (e.g., when using as a measure of athletic performance pre- and post-training interventions). Thus, results from the present study will allow for the optimisation of training and testing protocols by leveraging external verbal cues that enhance jump consistency and optimise jump outcome measures.
Materials and methods
Participants and study design
G power analysis (Version 3.1, University of Dusseldorf, Germany) using the analysis of variance (ANOVA): repeated measure, within factors, suggested a minimum of 21 subjects were required to have an 80% chance (power equals to 0.8) to find the statistically significant difference between groups with a moderate effect size (d = 0.5, p < 0.05) in every metric (International Committee of Medical Journal Editors, Citation1997). A sample of 25 male strength and conditioning postgraduate students (age: 24.9 ± 3.9 years; height: 1.8 ± 0.1 m; mass: 79.3 ± 13.5 kg) volunteered to participate. Noting that the initial pool of potential subjects was 40 and 29 volunteered for the data collection. Further to this, an additional four subjects whose performance was substantially lower than the rest of the group were removed to strategically minimise potential outliers that could skew the subsequent data analysis. The subjects provided informed written consent and indicated that they were free of any previous injury within six months. Subjects were required to have at least 1 year’s experience of strength and jump training (being able to perform the CMJ, DJ and CMRJ via correct and consistent techniques), which must have occurred during the year prior to their involvement in the study. At the time of data collection, all subjects were acting as recreational team sports athletes, participating in sports such as rugby (n = 5), basketball (n = 7), volleyball (n = 2) and soccer (n = 11), who typically engaged in at least two training sessions per week and participated in weekly competitive matches for their respective sports. This study was approved by the London Sport Institute research and ethics committee at Middlesex University.
This study employed a within-subjects repeated-measures research design, whereby the jump height, countermovement depth, TTTO and RSImod were determined during the first jump of CMRJ, and the jump height, GCT, leg stiffness and RSI were determined during the second jump of CMRJ. The individual joint work and contribution to the total negative and positive works were also determined during both jumps of CMRJ. Subjects performed three trials of CMRJ in each of three conditions: HC, VC and CC. The test order of the nine jumps was truly randomised across all three conditions to minimise any potential fatigue impacting one specific jump.
Experimental protocol and instrumentation
The subjects’ body height, body mass, age and sex were recorded first, and each subject was given a code for their name to comply with data protection policies at the university (L. A. Barker et al., Citation2018). The warm-up consisted of 5 minutes jogging and dynamic stretches (forward lunge rotations, the ‘world’s greatest stretch’ and forward and lateral hip swings) that helped to facilitate the subsequent jump actions (Xu et al., Citation2023a; Xu, Jordan, et al., Citation2023). Before moving to practical trials, subjects were provided with demonstrations of CMRJ to ensure they could complete the test with desired techniques (i.e., subjects could consistently jump twice in quick succession with the desired technique). Specifically, the familiarisation practices started by subjects completing the CMRJ twice with their maximum effort to reach for the ceiling, followed by them completing two CMRJ with their fastest speed. Finally, an extra two repetitions of CMRJ were completed by jumping with maximum effort and the fastest speed. Once the warm-up and familiarisation trials were completed, 42 reflective markers were placed on both sides of body landmarks, in accordance with previous motion capture study (Xu et al., Citation2023a). The cameras captured kinematic data at a sampling frequency of 200 Hz and was synchronised with twin embedded force platforms ([FP], Kistler Instruments Ltd., Hook, UK) that recorded ground reaction force (GRF) at 1000 Hz. The Qualisys Track Manager software (QTM; Qualisys AB) collects the force data from FP and the marker data from cameras simultaneously during each trial.
Ninety seconds of rest was given between each repetition to maximise jump performance and ensure adequate recovery (Xu et al., Citation2023a). A general instruction was given as ‘take-off and land on the same force plate with both feet, place hands over hips, keep the quiet standing for at least 1 s before the movement starts’. This general instruction only provides subjects with essential information on how to perform the CMRJ (L. Barker et al., Citation2021), which is the instruction used in previous studies (Xu et al., Citation2023a). For the subsequent cueing condition, the general instruction was given first, and then adding the specific cues in each condition as follows: the instruction ‘reach for the ceiling and jump as high as you can for both jumps’ was added in the HC condition (although it was explained to them that this was a figurative instruction and to keep their hands on their hips); this condition required subjects to focus on maximum jump height in both jumps without regard for the duration of ground contact (L. Barker et al., Citation2021; Oliver et al., Citation2021). The VC condition used the instruction ‘get off the ground and jump as fast as you can for both jumps’, where the emphasis was placed on minimising TTTO and GCT. Finally, the CC condition directed subjects’ attention on achieving both maximum jump height with a minimum amount of time on the ground and thereby generating larger RSImod and RSI values concurrently. The verbal instruction for the CC condition was ‘reach for the ceiling and jump as high as you can for both jumps whilst spending as little amount of time on the ground for both jumps’. The same investigator gave all verbal cues by reading from a script to guarantee that the verbal instructions given for each cueing condition were consistent between subjects, and no extra encouragements, guidelines or performance-related feedbacks were provided to subjects (L. Barker et al., Citation2021; Comyns et al., Citation2019; Oliver et al., Citation2021; Sánchez-Sixto et al., Citation2021; Yokoyama et al., Citation2019).
Data processing
The GRF and markers’ data were processed in Visual3D biomechanical software (C-Motion, Inc., Germantown, MD). An eight-segment body model was built to represent the trunk, pelvis, left- and right-side thigh, shank and foot segments. This model was then used to compute the motion of each segment and joint using a Cardan angle sequence x-y-z (J. R. Harry et al., Citation2019). The raw GRF and marker data were smoothed using a low-pass Butterworth filter with 50 Hz and 12 Hz cut-off frequencies, respectively (J. R. Harry et al., Citation2019). The inverse dynamics method via the pipeline function in Visual3D was used to calculate sagittal plane joint power, which is the product of the joint moment multiplied by the corresponding joint angular velocity (J. R. Harry et al., Citation2019; Lees et al., Citation2004). Finally, the GRF and joint power that had been processed in Visual3D were then exported to MATLAB (R2022a; The MathWorks, Inc., Natick, MA) for further calculation of performance and kinetic metrics.
An accurate calculation of the body weight was done by calculating the mean vertical GRF measured during the first second of data recording where subjects were standing quietly (Xu, Turner, et al., Citation2023). This body weight was used to calculate the vertical velocity and displacement that acted on the subjects’ centre of mass (COM) (Chavda et al., Citation2018). The movement initiation and instants of take-off and landing of two jumps in CMRJ were defined via methods described by Chavda et al. (Citation2018). The braking and propulsive phases of CMRJ1 and CMRJ2 were defined in line with the previous literature (Xu et al., Citation2023a). The jump height in the present study was calculated via the impulse-momentum method, representing the COM displacement from the COM height at the instant of take-off to the peak COM height during the flight phase (Xu, Turner, et al., Citation2023). All performance metrics were calculated in accordance with methods described by Bishop, Turner, et al. (Citation2021).
The filtered GRF was down-sampled five times to correspond to the camera data at 200 Hz (Lees et al., Citation2004); this GRF data was used to identify the braking and propulsive phases on the power–time curve. The mean negative and positive joint work was determined through the integration of negative and positive portions of the power–time curve during braking and propulsive phases of each jump in CMRJ (J. R. Harry et al., Citation2019). The energy attenuation was represented by negative works, while energy generation was represented by positive works (Decker & McCaw, Citation2012). The total negative and positive works were obtained by summating the individual negative and positive joint work, respectively (J. R. Harry et al., Citation2019). To determine the contribution of each joint to the total work of the lower extremities, the negative and positive work of each joint were divided by the total negative and positive work, respectively. All kinetic variables were normalised to subjects’ body mass to reduce its influence on statistical comparison.
Statistical analyses
Statistical analyses were conducted via SPSS (version 27; IBM, Armonk, NY), with statistical significance set at p < 0.05. The mean and standard deviation (SD) of the measured metrics were recorded and taken forward for statistical analysis. The assumption of normality for all data was confirmed by the Shapiro–Wilk statistic, and homogeneity of variance was confirmed by the Levene’s test (p > 0.05). Reliability of each metric measured during CMRJ was computed using a 2-way random effects model intraclass correlation coefficient (ICC) with absolute agreement and 95% confidence intervals (CI) and the standard error of the measurement (SEM) (Weir, Citation2005). According to the criteria reported by Koo and Li (Koo & Li, Citation2016), an ICC value >0.90 = excellent, 0.75–0.90 = good, 0.50–0.74 = moderate and <0.50 = poor. CV was calculated as (CV% = SD/mean × 100), with CV values considered good if <5%, moderate if between 5% and 10% and poor if >10% (Banyard et al., Citation2017). The calculation of the coefficient of variation (CV) was also completed for each participant, and was done to present some examples of how individual measurement error could be used in a case study format for practitioners wanting to determine true change for individual athletes (Bishop, Turner, et al., Citation2021; J. Harry et al., Citation2023). The SEM was calculated as (SD × √ (1 – ICC)), where the SD was calculated by using the mean value of each metric from the individual subject (Thomas et al., Citation2022). A general linear model ANOVA with one within-subject factor (condition) was used to compare all measured variables between three cueing conditions, with Tukey’s post-hoc comparisons when needed. Hedges’ g ES with 95% CI was used to describe the magnitude of differences between conditions, where these ES were computed using Microsoft Excel software, as ((Mean1 − Mean2)/SD pooled) (Xu et al., Citation2023a). These ES were interpreted as g < 0.35 = trivial; 0.35–0.80 = small; 0.81–1.50 = moderate; and >1.5 = large (Rhea, Citation2004).
Results
The mean ± SD values and ES for all measured metrics under each condition are displayed in . The reliability results of all performance and kinetic metrics for all three cueing conditions are shown in , with all metrics exhibiting good to excellent reliability (ICC = 0.76 to 0.98). The ANOVA revealed significant main effects of cueing condition for almost all dependent variables (F(2,72) = 3.41 to 27.79, p ≤ 0.03), excluding the negative and positive ankle work, positive knee contribution and negative hip, knee and ankle contribution in CMRJ1 (p > 0.05), and negative and positive ankle joint work and positive knee contribution in CMRJ2 (p > 0.05). For the performance metrics in CMRJ1, post-hoc analysis revealed that when using a VC, subjects utilised a significantly smaller countermovement depth than when using a CC (g = 0.76, p = 0.029) and HC (g = 1.26, p < 0.001), whilst they spent less TTTO when compared to CC (g = 0.70, p = 0.030) and HC (g = 1.92, p < 0.001). Although subjects in VC condition generated nonsignificant differences in RSImod values compared to the other two conditions (g = 0.33 to 0.51, p ≥ 0.163), they jumped significantly lower by 0.07 m and 0.09 m than those in CC (g = 0.95, p = 0.002) and HC (g = 1.20, p < 0.001) conditions, respectively. In addition, when using a CC, subjects spent less TTTO (g = 1.30, p < 0.001) but generated greater RSImod than HC (g = 0.82, p = 0.009). Regarding the performance metrics in CMRJ2, the analyses revealed that using a HC significantly extended the GCT (g = 1.85 to 2.60, p < 0.001) when compared with the other two cues, whilst also significantly decreasing the RSI (g = 1.33 to 1.58, p < 0.001) and leg stiffness (g = 0.77 to 1.28, p < 0.038). Using a VC significantly decreased jump height by around 0.07 m than using CC (g = 1.01, p = 0.005) and HC (g = 1.02, p = 0.002), respectively. No other significant differences were observed in the performance metrics across three conditions.
Table 1. Mean ± SD of performance and kinetic metrics for CC, HC and VC conditions.
Table 2. The reliability of performance and kinetic metrics under CC, HC and VC conditions.
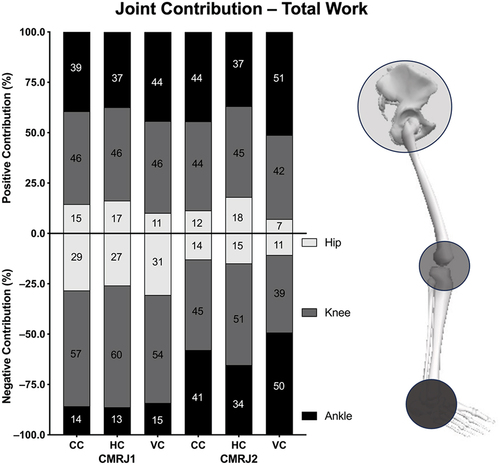
Results of kinetic metrics across three conditions are also shown in . When using a VC, subjects generated significantly smaller negative and positive hip joint work than CC (g = 0.78 to 0.84, p ≤ 0.040) and HC (g = 0.72 to 1.21, p ≤ 0.021) in CMRJ1, they also generated smaller negative and positive knee joint work but only when compared with an HC (g = 0.77 to 0.87, p ≤ 0.014). When investigating the contribution percentages in CMRJ1 (as shown in and ), using a VC significantly decreased the positive hip contribution by around 5% and 6% compared to when using a CC (g = 0.68, p = 0.032) and an HC (g = 1.02, p = 0.002), respectively. In addition, subjects utilised a larger amount of positive ankle contribution when they were cued for quickness (VC condition) compared to the other two conditions (g = 0.64 to 0.95, p ≤ 0.040). In CMRJ2, almost all kinetic metrics that were statistically analysed were significantly different between the HC and VC conditions (g = 0.72 to 1.89, p ≤ 0.030), with positive and negative ankle work and positive knee contribution showing no statistical significance between these two conditions (p ≥ 0.521). Furthermore, when using an HC, positive hip work and contribution were larger than when using a CC (g = 0.91 to 1.02, p = 0.001), but the positive ankle contribution was lower by 8% than when using a CC (g = 0.85, p = 0.020). Finally, when using a CC, subjects generated a greater amount of positive hip work and negative knee work (g = 0.72 to 0.84, p ≤ 0.040) along with a smaller amount of negative and positive ankle contribution (g = 0.63 to 0.65, p = 0.042) than using VC. No other significant differences were observed in the kinetic metrics across the three conditions.
Figure 1. Bar graph of individual joint contribution to the total positive and negative works during CMRJ test under three cueing conditions. The positive values indicate the contribution to the total positive work. The negative values indicated the contribution to the total negative work. The percentage numbers on the graph were rounded.
Further to the interpretation of group mean data, we undertook individual data analysis in line with recent studies which have recommended calculating the percentage change between conditions or test sessions, and relating the change back to the baseline variance score (i.e., CV) (Bishop, Turner, et al., Citation2021; J. Harry et al., Citation2023), noting that the CV can be calculated for each individual athlete. Results from the individual analysis identified two types of responders to the cueing conditions: i) partial changes in jump strategy (i.e., some metrics not showing true change [percentage difference < CV]), and ii) true changes in jump strategy (i.e., all metrics showing true change [percentage difference > CV]) between cueing conditions. In the CMRJ1, 3 of 25 subjects were classified as having partial changes in jump strategy, exhibiting unchanged CMRJ1 height (1 subject) and TTTO (2 subjects) between conditions, while 22 of 25 subjects were classified as having true changes in jump strategy. In the CMRJ2, all subjects were classified as having true changes in jump strategy across cueing conditions, and we elaborate on this further in the discussion.
Discussion and implications
This investigation aimed to examine the effect of three external verbal cues on a battery of metrics measured during both jumps of the CMRJ test. The results yielded statistically significant effects across cueing conditions, aligning with our initial hypothesis. Notably, utilising the HC and VC significantly increased or decreased a range of metrics, resulting in somewhat polarising jump strategies. Specifically, using the HC significantly increased the two jump height values in CMRJ and positive hip work and contribution in CMRJ2, with the compensation of increased contact times and decreased leg stiffness. In contrast, using the VC significantly reduced time-based metrics, countermovement depth and hip and knee joint work contributions at the cost of decreased jump height values in both jumps of the CMRJ. Using a CC typically decreased the contact times while concurrently increasing the leg stiffness compared to a HC and increasing the jump height compared to a VC, resulting in the highest RSI/RSImod values among all three conditions. Subjects in the CC condition also decreased positive hip work and contribution. However, they increased their positive ankle contribution compared to the HC condition while increasing their hip and knee work compared to the VC condition. Consequently, practitioners should be mindful that the measured performance and kinetic metrics in the CMRJ will vary depending on the cues utilised. Additionally, the individual analysis identified two types of responders to external cues, suggesting the importance of tailoring training and assessment protocols to account for individual differences in response to external cues.
The findings of the present study align with previous investigations on cueing effects in the CMJ and DJ tests, underscoring that different external verbal cues also elicit varied responses in the outcome measures of the CMRJ test (Barillas et al., Citation2023; L. Barker et al., Citation2021; Oliver et al., Citation2021; Sánchez-Sixto et al., Citation2021; Winkelman, Citation2018; Yokoyama et al., Citation2019). Nevertheless, given the variability in performance capability between our recreational sample and elite athletes, it is useful to compare our findings to those published in other cueing studies. For example, compared to Barillas et al. (Citation2023). who recruited male academy soccer players, the CMRJ1 height achieved in our study under the HC condition was notably higher (0.33 m vs. 0.27 m). Furthermore, the CMRJ2 height under the CC condition (0.34 m) exceeded that observed in studies involving professional male team sports athletes beyond the collegiate level (0.26 to 0.33 m) (Barillas et al., Citation2023; Comyns et al., Citation2019; Furuhashi et al., Citation2022). While our jump heights are comparable to previous studies, it is crucial to recognise that the CMRJ, CMJ and DJ are inherently different tests, with the CMRJ presenting unique challenges. This underscores the necessity of providing practitioners with detailed insights into how kinetic and kinematic metrics change during jump testing, for any type of acute or chronic intervention—noting that the purpose of manipulating verbal cues is to try and determine how performance can be optimised for the individual. In the HC condition, subjects executed both jumps at their preferred pace, facilitating deeper countermovement and generating larger impulses prior to take-off. Consequently, CMRJ1 exhibited prolonged times on the ground and CMRJ2 displayed slow SSC mechanics (GCT >250 ms) (Barillas et al., Citation2023; Comyns et al., Citation2019), yet both jumps achieved the highest jump height. In contrast, choosing the VC over the HC significantly reduced TTTO/GCT values (g = 1.92 to 2.60, p ≤0.001) and resulted in the lowest jump height values due to less time available for force production. In this context, subjects were likely to employ a stiffer jump strategy by reducing their downward COM displacement during the braking phase of both jumps, spending less time on the ground in CMRJ1 and maintaining fast SSC mechanics during the CMRJ2 (GCT <250 ms, as shown in ) (Barillas et al., Citation2023; Comyns et al., Citation2019; Young et al., Citation1995). However, when the goal is to maximise explosive power and reactive strength during the CMRJ, there are better options than HC or VC because neither cue in this study generated a significantly larger RSI/RSImod value than the CC (Barillas et al., Citation2023; Young et al., Citation1995). Although subjects in the CC condition did not exhibit fast SSC mechanics based on the GCT value (>250 ms), the CC seemed to promote a more balanced jump strategy. Specifically, the two jump height values in the CC condition demonstrated nonsignificant trivial differences compared to jump height values in the HC (g = 0.08 to 0.33, p ≥ 0.543), and only the TTTO in CMRJ1 was significantly longer compared to the VC condition with a small ES (g = 0.70, p = 0.030). It is crucial to note that although the RSImod and RSI values from the VC condition revealed non-significant trivial differences compared to those from the CC condition (g = 0.28 to 0.51, p ≥ 0.163), this does not imply that subjects adopted the same jump strategy between the two conditions (Bishop et al., Citation2022; Bishop, Turner, et al., Citation2021). shows that the two jump height values in the CC condition were significantly larger than in the VC condition with moderate ES (g = 0.95 to 1.01, p ≤ 0.005). Additionally, both time-based metrics were longer in the CC condition than in the VC condition with small ES (g ≤ 0.72), even though statistical significance in GCT was not achieved (p = 0.222). These discrepancies suggest that the verbal cues could disproportionately impact the component parts of ratio metrics (e.g., RSImod and RSI) (L. Barker et al., Citation2021; Sánchez-Sixto et al., Citation2021), and practitioners should be mindful of this when using verbal cues to adjust training or testing outcomes (Bishop, Turner, et al., Citation2021).
Investigating additional kinetic metrics like joint work and contribution helps practitioners decide whether subjects have interacted with the ground appropriately under various cueing conditions (Khuu et al., Citation2015; Yokoyama et al., Citation2019). To the author’s knowledge, no prior study has examined the external cueing effects on the measured joint work or contribution during the CMJ or CMRJ1, posing a challenge for directly comparing current findings with previous investigations. The results of previous research, albeit investigating the DJ, have revealed that using the VC condition resulted in a significantly lower degree of flexion in hip, knee and ankle joints at the lowest COM position during the ground contact phase (Yokoyama et al., Citation2019) or at the initial contact of the ground contact phase (Khuu et al., Citation2015; Young et al., Citation1995) compared to the HC condition. The present study reported similar findings, revealing that the VC condition led to significantly smaller negative hip joint work compared to both CC and HC conditions in CMRJ1 (g = 0.72 to 0.84, p ≤ 0.021), with similar differences observed in the positive and negative knee joint work, albeit only when compared with HC (g = 0.77 to 0.83, p ≤ 0.014). The reason could be attributed to a significantly large difference (ES = 1.26) in countermovement depth between HC and VC conditions, whereas this difference became small (ES = 0.58) between CC and VC conditions. Given that joint work is calculated by integrating joint power (i.e., net joint moment joint angular velocity) (Bishop, Brashill, et al., Citation2021), squatting down to a deeper depth in the HC condition generates larger hip and knee joint angular displacement, resulting in higher negative hip and knee joint work compared to the VC condition, along with higher subsequent positive hip and knee work. Moreover, as jump height decreased, using VC significantly decreased the positive hip contribution compared to both CC and HC (g = 0.68 to 1.02, p ≤ 0.032) while increasing the positive ankle contribution (g = 0.64 to 0.95, p ≤ 0.040). Thus, a shift in the positive joint contribution from proximal to distal lower limb joints appears when cueing for quickness and vice versa when cueing for height (Khuu et al., Citation2015; Yokoyama et al., Citation2019; Young et al., Citation1995). In the CMRJ2, the significant differences in most kinetic metrics between the HC and VC conditions underscore the potential of verbal cueing to polarise the CMRJ2 kinetic strategies (Barillas et al., Citation2023; Yokoyama et al., Citation2019). In addition, a significantly higher negative knee work (g = 0.72, p = 0.040) in the CC condition compared to the VC condition could be due to the increased knee flexion required to attenuate a larger braking momentum when landing from CMRJ1 (a higher CMRJ1 height in CC than VC). Lastly, the significantly greater negative and positive ankle joint contribution in the VC condition (g = 0.63 to 1.38, p ≤ 0.042), relative to the other conditions, again underscores the shifting of the contribution between joints. Put simply, a larger ankle contribution is associated with shorter GCT during rebound jumping (Yokoyama et al., Citation2019). As shown in , it appears that a hip-knee-ankle contribution could maximise CMRJ1 performance (negative: 14%–57%–29%, positive: 15%–46%–39%) and in CMRJ2 as well (negative: 14%–45%–41%, positive: 12%–44%–44%). Nevertheless, the joint contribution strategies employed in the CC condition failed to generate significantly higher RSImod and RSI values than in the VC condition, making it inconvincible to conclude the best joint contribution strategy to maximise CMRJ performance.
Different verbal cues have demonstrated the capacity to elicit distinct jump strategies during the CMRJ test, emphasising the importance of aligning cue selection with specific testing or training goals (L. Barker et al., Citation2021; Khuu et al., Citation2015; Oliver et al., Citation2021; Sánchez-Sixto et al., Citation2021). Considering the substantial effects these cues exert on measured jump metrics, practitioners should carefully tailor their cues to the desired outcomes. If the CMRJ test is used to examine changes in jump height from a training intervention, the HC should be used. Given that subjects under HC condition will likely utilise a double-countermovement strategy for both jumps in CMRJ (reflected by the longest contact times and deepest countermovement depth). This strategy aims to maximise the propulsive force and impulse, thereby achieving two maximum heights. Further, practitioners may consider using the HC towards the end of a rehabilitation programme before programming high-intensity fast SSC plyometrics (i.e., when applying the VC) (L. Barker et al., Citation2021). On the other hand, the VC should be applied to examine the quickness of generating a large magnitude of force. Subjects are prone to utilising a minimum joint angular displacement strategy by increasing their ankle joint contribution for both jumps (reflected by the lowest countermovement depth with high-level vertical stiffness). Finally, whenever the CC condition is employed, subjects typically utilise a relatively balanced strategy (reflected by the highest RSI/RSImod values). They strategically harnessed the strengths of both HC and VC cues whilst minimising their potential drawbacks, culminating in the simultaneous optimisation of RSImod and RSI. Thus, the CC condition comprehensively evaluates an athlete’s explosive power and reactive strength during the CMRJ, capturing the balance between maximum jump height and minimum contact times. Therefore, practitioners should consider using the CC when there is no specific goal to either maximise height or minimise time spent on the ground, which in turn, will also maximise RSImod and RSI values.
An additional area practitioners should be mindful of is the observed variability in subjects’ responses to each of the verbal cues. To illustrate this better, and provide some examples of individual data in more detail from this study. Considering the CC condition as a baseline (because the HC and VC conditions represent opposite ends of the cueing spectrum), it is notable that both subjects 1 and 2 have achieved the highest RSImod and RSI values under the CC condition, aligning with our initial hypothesis. Although subject 1 utilised a longer TTTO and greater countermovement depth during the HC condition, this strategy failed to induce a true change in the CMRJ1 height compared to the CC condition. This could be attributed to individual differences in the effective use of slow SSC mechanics, where the longer duration braking and propulsive phases could lead to energy dissipation as heat rather than being effectively used for vertical displacement (Wilson & Flanagan, Citation2008). In contrast, subject 2 showed a percentage change exceeding all associated CV values, demonstrating a more pronounced inclination to align their movement pattern with verbal cues, signifying more true changes than subject 1. These examples provide useful evidence of inter-subject variability in response to external cues, suggesting that a wide variety of jump strategies are likely to be evident between individuals, which in turn, may help to inform decisions around training. Overall, future cueing studies are advised to concentrate on subjects with similar levels of jump training. However, given this is not always possible, our data indicate that individual analysis is important to fully understand the inherent inter-subject variation when testing is applied to subjects from different sports backgrounds (Bishop et al., Citation2022; J. Harry et al., Citation2023; Khuu et al., Citation2015).
Figure 2. Individual subject’s jump height, TTTO/GCT and RSImod/RSI and their respective CV and percentage changes for countermovement rebound jump tests. These samples were chosen to represent partial changes in jump strategy (subject 1) and true changes in jump strategy (subject 2) between cueing conditions.
Table 3. Individual data, reliability and percentage change of the countermovement rebound jump performance metrics.
Some limitations exist in the present study which should be acknowledged. While our recreational participants have achieved comparable CMRJ heights with the previous CMJ study that have recruited male academy soccer players (Barillas et al., Citation2023), and DJ studies involving professional male team sports athletes (Barillas et al., Citation2023; Comyns et al., Citation2019; Furuhashi et al., Citation2022), the discrepancy in performance capability between our participants and professional athletes limits the direct applicability of our results to elite sporting populations. A possible explanation between our findings being similar to previous research (regarding the effects of cueing on jump performance), is the familiarity of our participants with the CMRJ protocol, acquired through their postgraduate studies. Given the more complex nature of the CMRJ test compared to the CMJ and DJ tests, it is plausible that athletes untrained in specific CMRJ techniques might not exhibit similar responsiveness to such verbal cues. Furthermore, the complexity of the CMRJ somewhat constrains practitioners to only gather comparable metrics with the CMJ and DJ tests, acknowledging that these tests, although having some similarities, are also independent motor skills. This statement helps to explain why the RSI values from CMRJ2 (1.21) were not superior to those reported in the aforementioned DJ studies (1.20 to 1.66) (Barillas et al., Citation2023; Comyns et al., Citation2019; Furuhashi et al., Citation2022), suggesting that our sample may require greater plyometric training experience to utilise fast SSC mechanics more efficiently. Secondly, the absence of female participants in our study prevents conclusions about whether females would respond to cueing in the same way as males. Therefore, future investigations aiming to explore CMRJ performance should consider recruiting elite athletes of both genders who regularly test with the CMRJ, as part of their routine monitoring processes. This approach could avoid the possible pre-conceived opinions held by our participants, minimise the large range of athletic abilities and guarantee a minimal level of proficiency in the sport. Additionally, and somewhat related, when assessing CMRJ performance across participants from varied sports backgrounds, baseline data should be collected to determine if different sporting history has a potential role in impacting CMRJ data.
Conclusion
Our findings have shown that cueing results in the CMRJ test are similar to cueing observations made when the jumps are performed individually (i.e., during the CMJ and DJ, separately), as reported in the literature (Barillas et al., Citation2023; L. Barker et al., Citation2021; Oliver et al., Citation2021; Sánchez-Sixto et al., Citation2021; Winkelman, Citation2018; Yokoyama et al., Citation2019). A proper external verbal cue provided to athletes could help them achieve greater jump performance with maximum force by utilising less muscular energy (Wulf & Dufek, Citation2009). Therefore, aligning the cues with the testing or training objectives and the characteristics of the sport are important. For practitioners who wish to maximise height, using the cue ‘reach for the ceiling and jump as high as you can for both jumps’ seems appropriate. This HC fosters a double-countermovement strategy, facilitating a deeper countermovement for heightened propulsive force and impulse. Conversely, for practitioners who wish to assess a stiffer jump strategy and assess fast SSC mechanics (e.g., sprinters), using the cue ‘get off the ground and jump as fast as you can for both jumps’ is likely to be more appropriate. This VC encourages a strategy with minimal joint angular displacement, emphasising ankle joint contribution, resulting in reduced countermovement depth and increased leg stiffness. Additionally, for practitioners who do not have one specific focus and ultimately wish to maximise subsequent RSImod or RSI values (e.g., team sport athletes), using the cue ‘jump as high as you can for both jumps and spend as little time on the ground as possible for both jumps’ seems to be more appropriate.
Acknowledgments
The authors warmly thank the participants of this study.
Disclosure statement
No potential conflict of interest was reported by the author(s).
References
- Banyard, H. G., Nosaka, K., & Haff, G. G. (2017). Reliability and validity of the load–velocity relationship to predict the 1RM back squat. The Journal of Strength & Conditioning Research, 31(7), 1897–1904. https://doi.org/10.1519/JSC.0000000000001657
- Barillas, S. R., Oliver, J. L., Lloyd, R. S., & Pedley, J. S. (2021). Cueing the youth athlete during strength and conditioning: A review and practical application. Strength & Conditioning Journal, 43(3), 29–42. https://doi.org/10.1519/SSC.0000000000000567
- Barillas, S. R., Oliver, J. L., Lloyd, R. S., & Pedley, J. S. (2022). Kinetic responses to external cues are specific to both the type of cue and type of exercise in adolescent athletes. The Journal of Strength & Conditioning Research, 37(3), 597–605. https://doi.org/10.1519/JSC.0000000000004307
- Barker, L., Bankers, S., Farmer, B., Siedlik, J., Harry, J., & Grindstaff, T. L. (2021). The influence of verbal cues on drop jump landing strategies in NCAA division I soccer players. American Journal of Sports Science, 9(2), 37–42. https://doi.org/10.11648/j.ajss.20210902.12
- Barker, L. A., Harry, J. R., & Mercer, J. A. (2018). Relationships between countermovement jump ground reaction forces and jump height, reactive strength index, and jump time. The Journal of Strength & Conditioning Research, 32(1), 248–254. https://doi.org/10.1519/JSC.0000000000002160
- Bishop, C., Brashill, C., Abbott, W., Read, P., Lake, J., & Turner, A. (2021). Jumping asymmetries are associated with speed, change of direction speed, and jump performance in elite academy soccer players. The Journal of Strength & Conditioning Research, 35(7), 1841–1847. https://doi.org/10.1519/JSC.0000000000003058
- Bishop, C., Jordan, M., Torres-Ronda, L., Loturco, I., Harry, J., Virgile, A., Mundy, P., Turner, A., & Comfort, P. (2022). Selecting metrics that matter: comparing the use of the countermovement jump for performance profiling, neuromuscular fatigue monitoring, and injury rehabilitation testing. Strength & Conditioning Journal, 45(5), 545–553. https://doi.org/10.1519/SSC.0000000000000772
- Bishop, C., Turner, A., Jordan, M., Harry, J., Loturco, I., Lake, J., & Comfort, P. (2021). A framework to guide practitioners for selecting metrics during the countermovement and drop jump tests. Strength & Conditioning Journal, 44(4), 95–103. https://doi.org/10.1519/SSC.0000000000000677
- Chavda, S., Bromley, T., Jarvis, P., Williams, S., Bishop, C., Turner, A. N., Lake, J. P., & Mundy, P. D. (2018). Force-time characteristics of the countermovement jump: Analyzing the curve in excel. Strength & Conditioning Journal, 40(2), 67–77. https://doi.org/10.1519/SSC.0000000000000353
- Comyns, T. M., Brady, C. J., & Molloy, J. (2019). Effect of attentional focus strategies on the biomechanical performance of the drop jump. The Journal of Strength & Conditioning Research, 33(3), 626–632. https://doi.org/10.1519/JSC.0000000000003009
- Cormie, P., McBride, J. M., & McCaulley, G. O. (2009). Power-time, force-time, and velocity-time curve analysis of the countermovement jump: Impact of training. The Journal of Strength & Conditioning Research, 23(1), 177–186. https://doi.org/10.1519/JSC.0b013e3181889324
- Decker, A. J., & McCaw, S. T. (2012). Target heights alter the energetics of drop jumps when drop height is held constant. The Journal of Strength & Conditioning Research, 26(12), 3237–3242. https://doi.org/10.1519/JSC.0b013e31824edcab
- Furuhashi, Y., Hioki, Y., Yoshimoto, S., & Hayashi, R. (2022). Effect of neutral, internal, and external focus on drop jump performance: Is drop jump performance affected by plyometric training experience? The Journal of Strength & Conditioning Research, 36(12), 3319–3323. https://doi.org/10.1519/JSC.0000000000004147
- Harry, J., Hurwitz, J., Agnew, C., & Bishop, C. (2023). Statistical tests for sports science practitioners: Identifying performance gains in individual athletes. The Journal of Strength & Conditioning Research, 38(5). https://doi.org/10.1519/JSC.0000000000004727
- Harry, J. R., Barker, L. A., & Paquette, M. R. (2019). Sex and acute weighted vest differences in force production and joint work during countermovement vertical jumping. Journal of Sports Sciences, 37(12), 1318–1326. https://doi.org/10.1080/02640414.2018.1557825
- International Committee of Medical Journal Editors. (1997). Uniform requirements for manuscripts submitted to biomedical journals. Pathology, 29(4), 441–447. https://doi.org/10.1080/00313029700169515
- Khuu, S., Musalem, L. L., & Beach, T. A. (2015). Verbal instructions acutely affect drop vertical jump biomechanics—implications for athletic performance and injury risk assessments. The Journal of Strength & Conditioning Research, 29(10), 2816–2826. https://doi.org/10.1519/JSC.0000000000000938
- Kipp, K., Kiely, M. T., & Geiser, C. F. (2016). Reactive strength index modified is a valid measure of explosiveness in collegiate female volleyball players. The Journal of Strength & Conditioning Research, 30(5), 1341–1347. https://doi.org/10.1519/JSC.0000000000001226
- Koo, T. K., & Li, M. Y. (2016). A guideline of selecting and reporting intraclass correlation coefficients for reliability research. Journal of Chiropractic Medicine, 15(2), 155–163. https://doi.org/10.1016/j.jcm.2016.02.012
- Lees, A., Vanrenterghem, J., & De Clercq, D. (2004). The maximal and submaximal vertical jump: Implications for strength and conditioning. The Journal of Strength & Conditioning Research, 18(4), 787–791. https://doi.org/10.1519/00124278-200411000-00018
- McNicholas, K., & Comyns, T. M. (2020). Attentional focus and the effect on change-of-direction and acceleration performance. The Journal of Strength & Conditioning Research, 34(7), 1860–1866. https://doi.org/10.1519/JSC.0000000000003610
- Oliver, J. L., Barillas, S. R., Lloyd, R. S., Moore, I., & Pedley, J. (2021). External cueing influences drop jump performance in trained young soccer players. The Journal of Strength & Conditioning Research, 35(6), 1700–1706. https://doi.org/10.1519/JSC.0000000000002935
- Rhea, M. R. (2004). Determining the magnitude of treatment effects in strength training research through the use of the effect size. The Journal of Strength & Conditioning Research, 18(4), 918–920. https://doi.org/10.1519/00124278-200411000-00040
- Sánchez-Sixto, A., McMahon, J. J., & Floría, P. (2021). Verbal instructions affect reactive strength index modified and time-series waveforms in basketball players. Sports Biomechanics, 23(2), 1–11. https://doi.org/10.1080/14763141.2020.1836252
- Thomas, J. R., Martin, P., Etnier, J., & Silverman, S. J. (2022). Research methods in physical activity. Human kinetics.
- Weir, J. P. (2005). Quantifying test-retest reliability using the intraclass correlation coefficient and the SEM. The Journal of Strength & Conditioning Research, 19(1), 231–240. https://doi.org/10.1519/00124278-200502000-00038
- Wilson, J. M., & Flanagan, E. P. (2008). The role of elastic energy in activities with high force and power requirements: A brief review. The Journal of Strength & Conditioning Research, 22(5), 1705–1715. https://doi.org/10.1519/JSC.0b013e31817ae4a7
- Winkelman, N. C. (2018). Attentional focus and cueing for speed development. Strength & Conditioning Journal, 40(1), 13–25. https://doi.org/10.1519/SSC.0000000000000266
- Wulf, G., & Dufek, J. S. (2009). Increased jump height with an external focus due to enhanced lower extremity joint kinetics. Journal of Motor Behavior, 41(5), 401–409. https://doi.org/10.1080/00222890903228421
- Wulf, G., & Lewthwaite, R. (2016). Optimizing performance through intrinsic motivation and attention for learning: The OPTIMAL theory of motor learning. Psychonomic Bulletin & Review, 23(5), 1382–1414. https://doi.org/10.3758/s13423-015-0999-9
- Xu, J., Jordan, M. J., Chavda, S., Turner, A., & Bishop, C. (2023). Test–Retest Reliability of the Magnitude and Direction of Asymmetry in the Countermovement Jump, Drop Jump, and Countermovement Rebound Jump. Symmetry, 15(10), 1960. https://doi.org/10.3390/sym15101960
- Xu, J., Turner, A., Comfort, P., Harry, J. R., McMahon, J. J., Chavda, S., & Bishop, C. (2023). A systematic review of the different calculation methods for measuring jump height during the countermovement and drop jump tests. Sports Medicine, 53(5), 1–18. https://doi.org/10.1007/s40279-023-01828-x
- Xu, J., Turner, A., Comyns, T. M., Harry, J. R., Chavda, S., & Bishop, C. (2023a). Countermovement rebound jump: A comparison of joint work and joint contribution to the countermovement and drop jump tests. Applied Sciences, 13(19), 10680. https://doi.org/10.3390/app131910680
- Xu, J., Turner, A., Comyns, T. M., Harry, J. R., Chavda, S., & Bishop, C. (2023b). The Countermovement Rebound Jump: Between-session reliability and a comparison with the countermovement and drop Jump Tests. The Journal of Strength & Conditioning Research, 13(19), 10.1519. https://doi.org/10.3390/app131910680
- Yokoyama, H., Oda, A., Makino, M., Ishikawa, T., Shikanai, K., Tsukamoto, T., & Tsuda, E. (2019). Effects of different oral instructions on kinematic and kinetic parameters during drop vertical jump. Journal of Physical Therapy Science, 31(8), 670–674. https://doi.org/10.1589/jpts.31.670
- Young, W. B., Pryor, J. F., & Wilson, G. J. (1995). Effect of instructions on characteristics of countermovement and drop jump performance. The Journal of Strength & Conditioning Research, 9(4), 232–236. https://doi.org/10.1519/00124278-199511000-00005