
 ?Mathematical formulae have been encoded as MathML and are displayed in this HTML version using MathJax in order to improve their display. Uncheck the box to turn MathJax off. This feature requires Javascript. Click on a formula to zoom.
ABSTRACT
This study discusses the stock market reaction to the firm’s carbon neutrality commitments. By hand-collecting firm-level news and stock data, we conduct event studies as well as regression modelling studies. The results show that firms experience losses in market value from committing to being carbon neutral, and the decline in cumulative abnormal returns ranges from −2.09% to −1.21% across different event windows. However, we find better previous ESG performance and a higher level of carbon disclosure could mitigate adverse market reactions. This study innovatively links the ‘trade-off theory’ and ‘resource-based view’ to the discussion of CSR/ESG on firm value from the lens of carbon neutrality commitments.
KEYWORDS:
1. Introduction
Climate change has become one of the most pressing challenges for the natural environment and human society. The global average temperature has increased by 1.18°C since the late 19th century, and climate degradation is estimated to trigger $140 to $300 billion in yearly economic losses by 2030 (United Nations Environment Programme Citation2020). Carbon emissions from human activities are a primary driver of climate change (Field & Barros Citation2014). The concept of ‘Carbon Neutrality’ has received increasing attention.Footnote1 It has been acknowledged that firms’ commitment to carbon neutrality contributes to building a sustainable economy at the macro level (Dhanda and Hartman Citation2011), and such an action manifests their social responsibility from the lens of Environmental, Social, and Governance (ESG) (Liang and Renneboog Citation2017; Garel and Petit-Romec Citation2021). However, how does such a carbon-zero pledge affect firm value at the micro level? In other words, how may the stock market react to the firms that conduct carbon neutrality commitments?
By hand-collecting data from public information in Factiva and Google news, we obtain 166 firms with the carbon neutrality commitment from indices of S&P 500, Russel 2000, and FTSE100 from 2017 to 2021. We first implement an event study and observe the cumulative average abnormal returns (CAARs) are significantly negative across all short-term event windows. Further study by countries and different carbon neutrality goals indicates the degree of political enforcement and the manifested determinants for the commitment also play roles in the market reaction. We next conduct a quantitative modelling study and construct an ESG combined score to find that it has a positive relationship with the company’s cumulative abnormal returns. Then, we use a proxy of carbon disclosure ratings released by Carbon Disclosure Project to find firms disclosing sufficient carbon information would mitigate the adverse market reaction after the commitment.
This study contributes to different strands of research. First, we provide evidence that links the ‘trade-off theory’ (Friedman Citation1970) and ‘Resource-based view’ (Wernerfelt Citation1984) to the discussion of CSR/ESG on firm value. On the one hand, our findings consist of the trade-off theory, which indicates that socially responsible commitment would decrease firm value as it requires increasing expenses (Krüger Citation2015; El Ghoul et al. Citation2018). On the other hand, our findings are in line with the resource-based view. We argue that commitment to carbon neutrality help firms gain competitive advantages in the market and achieve positive images and better public reputations (Herremans, Akathaporn, and McInnes Citation1993; Schnietz and Epstein Citation2005). Though firms would experience short-run drops in stock returns, managers should develop CSR/ESG performance and enhance carbon disclosure for long-term benefits.
Second, we provide an innovative study that analyses the impact of carbon zero pledges on firm value. Existing literature analyses the market reaction to environmental issues from different perspectives, such as pollution data release (Hamilton Citation1995), ecological awards (Klassen and McLaughlin Citation1996; Garel and Petit-Romec Citation2021), ESG news (Capelle-Blancard and Petit Citation2019), and environmental enforcement regimes (Sam and Zhang Citation2020). However, underdeveloped research takes commitments to carbon neutrality or ‘Net Zero’ (United Nations Citation2020) as the window to observe the market response to firms’ socially responsible actions. This study is intended to fill the gap in the relation between carbon neutrality commitment and firm value.
Third, this study further discusses whether firms’ previous ESG performance or carbon disclosure level determines the market reaction to carbon neutrality commitment. Carbon disclosure is a key element likely to affect market reaction to environmental news. Previous studies indicate that better carbon disclosure helps firms mitigate information asymmetry problems (Matsumura, Prakash, and Vera-Munoz Citation2014) and improve the management of natural risks related to climate change; such firms tend to outperform competitors in stock returns (McLaughlin Citation2011). Based on previous evidence, this study hypothesises that ESG performance and carbon disclosure are positively associated with market reaction to the carbon neutrality commitment (McLaughlin Citation2011; Matsumura, Prakash, and Vera-Munoz Citation2014; Friede, Busch, and Bassen Citation2015).
The reminder of the paper is organised as follows. The next section reviews relevant literature and hypotheses development. The data collection process and model design are introduced in the third section. The fourth and fifth sections present the empirical results of the event study and regression modelling study, followed by the conclusion.
2. Literature review and hypothesis development
2.1. Carbon neutrality goal and commitment
With global efforts to deal with climate change challenges by reducing carbon emissions to zero around mid-century, the concept of ‘Carbon Neutrality’ has gotten increasing attention. There have been 137 countries that announced carbon neutrality commitments and released supporting policies, in which Bhutan and Suriname are the two countries that have achieved carbon neutrality (National Public Utilities Council Citation2021). At the firm level, companies speed up paces to align themselves with this agenda, and the number of companies with net-zero pledges doubled in less than one year, from 500 in 2019 to more than 1,000 in 2020 (United Nations Citation2020). It is observed that there is an upward trend of firms making the carbon neutrality commitment.
Corporate participation in carbon neutrality is primarily seen as a commercially voluntary practice since there is no mandatory legitimacy to force firms to keep pace with the national goal of reaching zero-carbon emissions. This also represents that such a carbon neutrality commitment reveals corporations’ social and environmental concerns. Firms take responsibility for dealing with public issues beyond simple compliance with government regulations (Neville et al. Citation2005). Based on the essence of carbon neutrality, this study incorporates it into ESG and CSR to explore its impact on firm value.
2.2. Carbon neutrality for firms: trade-off or resource?
The debate over corporate social responsibility (CSR) and what goals the firms should pursue are not settled. The impact of taking environmental activities on the firms are still mixed (Liang and Renneboog Citation2017; El Ghoul et al. Citation2018; Garel and Petit-Romec Citation2021; Pástor, Stambaugh, and Taylor Citation2021). This kind of mixed research argument not only exists between different literature but also appears in the same research (i.e. Wang, Wu, and Zhang Citation2022; Chen et al. Citation2022). Whatever the answer, the evidence suggests that environmental, social or corporate governance (ESG) may have a positive (negative) impact on firm value, and managers can no longer ignore this. Two vital theories are both broadly employed to explain it: the ‘trade-off theory’ and the ‘resource-based view’. The former implies that engaging in social-responsible activities is an exchange of firms’ profits, while the latter is the opposite.
The trade-off theory is proposed by Friedman (Citation1970), who states that the most important objective of a firm is to maximise profits; expected costs of ethical engagements are likely to outweigh benefits, consequently leading to a loss in firm value. The cost of environmental activities includes operating costs, resources mismatch costs, implementation costs, certification and audit costs, maintenance costs, and even agency costs (Jensen Citation1986; Klassen and Whybark Citation1994; Palmer, Oates, and Portney Citation1995; Alberti et al. Citation2000). Subsequent studies specify corporate social responsibilities against the interests of the firm. Chen and Metcalf (Citation1980) indicate that the input in environmental issues is likely to occupy capital which could have been invested in other profitable projects. Better environmental performance is at the sacrifice of financial performance. Likewise, Gray and Shadbegian (Citation1995) suggest that environmental regulation would affect firms’ productivity since it occupies resources in non-productive activities such as waste treatment and environmental auditing. As a result, Jaggi and Freedman (Citation1992) claimed that firms’ environmental commitment would not be rewarded by higher market value. Krüger (Citation2015) employs a short-run event study to explore the impact of CSR events on stock price performance and finds an overall negative reaction to CSR events (environmental events are included). This indicates that the stock price decline mainly results from agency costs.
Following the trade-off theory and considering the features of carbon neutrality, this study regards the potential costs of carbon neutrality commitment as: expenditures on making carbon strategies, developing sustainable technologies to reduce carbon emissions, purchasing clean materials and equipment for the decarbonised production process, and disclosing carbon information regularly for the environmental assessment by external audits and stakeholders. Based on the underlying premise of the trade-off theory that a firm’s responsibility is to enhance its profitability, allocating resources to improve environmental responsibilities would cause agency problems between managers and shareholders. Therefore, committing to be carbon neutral requires extra expenditures to reduce their carbon footprint, which conflicts with stakeholders’ wealth, and investors would respond negatively to such pledges.
As an opponent of trade-off theory, the resource-based view illustrates the motivation for firms to take environmental responsibilities. The resource-based view was introduced by Wernerfelt (Citation1984), stressing that resources rather than products determine the firm’ competitive position in the market. To be more specific, Grant (Citation1991) emphasises the importance of intangible resources and personnel-based resources, which are difficult to be evaluated and tend to be neglected by traditional balance sheets, these resources correspond to social responsibilities. Russo and Fouts (Citation1997) incorporate capabilities that promote environmental activities into the competitive advantages of firms, with the expectation that environmental care would distinguish firms in the market. Furthermore, Peteraf (Citation1993) proposes that identifying valuable environmental resources helps companies erect impediments to imitation among competitors, thus capturing distinctive competencies.
The theory of resource-based view, cutting production expenses, improving productivity, shrinking expenditures on pollution insurance, and regional policies and taxes advantages are obvious benefits related to environmental engagements (Hoshino, Yura, and Hitomi Citation1995; Alberti et al. Citation2000; Lanis and Richardson; Citation2015). Besides, firms with environmental responsibilities have advantages in winning support from stakeholders, which contribute to sales promotion, rich financing channels, and the stability of labor force (Dutton and Dukerich Citation1991; Herremans, Akathaporn, and McInnes Citation1993; Schnietz and Epstein Citation2005). Specifically, the public’s increasing concerns about environmental problems drive consumers to purchase green goods, which is beneficial to improving environmentally oriented firms’ sales (Arora and Gangopadhyay Citation1995). Baron (Citation2009) states that firm value is not only assessed by financial return but also by social performance, and firms with higher environmental responsibilities tend to be highly valued by investors. Such advantages in attracting investment appear more obvious during the crisis period (Garel and Petit-Romec Citation2021). Moreover, firms engaging in environmental practices are more likely to gain support and trust from employees (Bhattacharya, Korschun, and Sen Citation2009), thus promoting employees’ job satisfaction and identification (Tziner et al. Citation2011; Bauman and Skitka Citation2012; Kehoe and Wright Citation2013), which lead to employees’ higher commitment to firms and decrease the employee turnover ratio.
In sum, taking environmental responsibility brings quantifiable benefits such as savings in production and supporting policies and preferential taxes and non-quantifiable benefits, such as recognition from stakeholders. This intangible reputation helps firms promote sales, attract investment, and retain employees. All these tangible and intangible benefits contribute to equipping firms with positive images and enhancing firms’ financial performance. In the spirit of the resource-based view, since only a small percentage of companies declare to be carbon neutral in the market, the scarcity of carbon neutrality commitment can transfer into unique resources for firms, and such potential competitive advantages motivate firms to develop environmental responsibilities.
2.3. Hypotheses development
2.3.1. Commitment as a benefit or loss?
Following the discussion above, the trade-off theory provides a negative perspective that corporates’ responsibility is to ‘make money’. At the same time, environmental activities would trigger excessive costs, leading to a firm value decline. Spicer (Citation1978) provides evidence that pollution expenditures would reduce the firm’s earnings, which conflicts with investors’ primary concern on the return on their investment. Walley and Whitehead (Citation1994) stress that firms have to bear extra costs of installing recycling equipment to address pollution or waste. The increasing operating costs hurt firms’ financial performance in the long run. More recently, Krüger (Citation2015) supposes that agency costs mainly contribute to the decrease in market value when ESG news is announced. Bhandari and Javakhadze (Citation2017) reveal that environmental engagements would occupy capital and lead to inefficient resource allocation, which brings disadvantages in their value compared with other norms.
Besides, some scholars doubt the consistency of environmental commitment and firms’ actual efforts. For example, Ramus and Montiel (Citation2005) argue that some firms take environmental commitment as a tool to advertise instead of taking actual to distinguish themselves from competitors, which is called ‘greenwashing’, this trap may betray investors’ trust and harm firm value at the end (Delmas and Burbano Citation2011). Empirically, Hassel, Nilsson, and Nyquist (Citation2005) investigate 337 Swedish firms in 9 quarters of observation. They perceive that implementing environmental strategies may be recognised as a green-washing or window-dressing action by stakeholders, thus endangering firms’ value. Du (Citation2015) employs an event study to research market reaction to greenwashing in China, finding a significantly negative association between greenwashing publications and firms’ stock returns.
Given that carbon neutrality commitment reflects corporates environmental responsibilities, excessive costs generated from environmental responsibilities and the risk of being confirmed as greenwashing by stakeholders are likely to cause losses in firms’ profits. Therefore, we construct the following hypothesis:
Hypothesis 1a:
Carbon neutrality commitment has a negative impact on firm value.
However, opponents argued that environmental commitment would enhance firm value. Based on the resource-based view, environmental engagement could equip the firm with competitive advantages over rivals (Barney Citation1991). Firms are motivated to take environmental responsibilities, such as reducing carbon emissions, to gain ground in the market. Bragdon and Marlin (Citation1972) link the pollution control indexes with the profitability indexes of 17 companies in the pulp and paper industry, and find lower pollution firms tend to have better financial performance. Similarly, King and Lenox (Citation2001) ‘analyse 652 public manufacturing firms in the U.S., providing evidence that cleaner firms have higher Tobin’s Q, and pollution reduction contribute to firms’ financial gains. Furthermore, some research focuses on the market reaction to environmental commitment. Klassen and McLaughlin (Citation1996) imply that public announcements about winning environmental awards could increase firms’ valuation by approximately $80.5 million. Griffin and Sun (Citation2013) researched the US companies’ voluntary statements of greenhouse gas emissions through CSR newswire service. They find that green information publication would bring positive abnormal returns to stocks.
Carbon neutrality commitment establishes an organisational promise to reduce green gas emissions to zero, demonstrating firms’ dedication to improving environmental responsibility. Making a carbon zero commitment would help firms achieve positive images and higher recognition in the market; since a better reputation makes firms easier to get support from stakeholders (Branco and Rodrigues Citation2006), it is reasonable to hypothesise:
Hypothesis 1b:
Carbon neutrality commitment has a positive impact on firm value.
2.3.2. ESG, carbon disclosure and market reaction
According to Feldman, Soyka, and Ameer (Citation1997), improvements in environmental performance would lead to an approximately 5% increase in shareholder wealth. Besides, social factors benefit additional shareholders, such as employees and the local community (Godfrey Citation2005). Lee, Park, and Lee (Citation2013) state that better social concerns for employees would decrease the employee turnover ratio, saving labour replacement costs for firms. Moreover, corporate governance is crucial to the firm’s business operation and regulation. Good corporate governance is associated with a lower cost of capital, higher returns on equity, greater efficiency, and more favourable treatment of all stakeholders (Shleifer and Vishny Citation1997; Amba Citation2014; Faysal, Salehi, and Moradi Citation2021). Effective corporate governance is an important tool to mitigate agency problems between managers and shareholders, thus reducing agency costs and enhancing firm value.
Since ESG is closely related to carbon neutrality, meanwhile affecting the firm’s financial performance, it is expected that market reaction to carbon neutrality commitment would be affected by the firm’s formal ESG performance (Pástor, Stambaugh, and Taylor Citation2021). Therefore, we construct the following hypothesis:
Hypothesis 2:
Better ESG performance improves the market reaction to the carbon neutrality commitment.
Apart from ESG performance, carbon disclosure level is another critical factor contributing to the different reactions to environmental commitment. Carbon disclosure can inform the market of firms’ efforts to improve environmental performance, which helps reduce information asymmetry problems between insiders and outsiders (Matsumura, Prakash, and Vera-Munoz Citation2014). As capital markets consider environmental disclosure when assessing firms’ environmental risk control (Barth and McNichols Citation1994), firms with transparent carbon information can position themselves as attractive options for climate-conscious investors (Lewis and Juravle, Citation2010).
Carbon disclosure improves firms’ management of natural risks such as climate change. McLaughlin (Citation2011) argues that carbon disclosure reveals corporates’ environmental risk control awareness. Firms with a higher level of environmental disclosure tend to perform better in diversifying natural risks. Likewise, Lemma et al. (Citation2020) assert that carbon disclosure signals to the market that firms care about carbon risks exposure and regulations. More transparent disclosure would be rewarded with market recognition for environmental contribution. These stocks tend to outperform in stock returns counterparts (Dhaliwal et al. Citation2011). Conversely, if firms do not disclose carbon information, investors are more likely to regard non-disclosure as a negative signal and lose interest in investing in these stocks.
Carbon disclosure delivers internal carbon information to the public and reveals corporates’ concerns for carbon risks, therefore mitigating information asymmetry problems. Hence, firms would benefit from voluntary environmental disclosure in financial performance. Based upon the above discussion, our third hypothesis that concerns carbon disclosure is constructed as follows:
Hypothesis 3:
Higher carbon disclosure level improve the market reaction to the carbon neutrality commitment.
3. Data collection and methodology development
3.1. Data collection
This study focuses on 166 publicly traded firms that made carbon neutrality pledges from 2017 to 2021 on the Standard and Poor’s 500 (S&P 500), Russell 2000, and Financial Times Stock Exchange 100 (FTSE 100). These three indices contain both small-cap and large-cap enterprises, which make firm size comparable. Additionally, this sample includes both the U.S. and the U.K. firms, which makes it possible to compare the market reaction to the carbon neutrality commitment across countries.
Since no database directly provides companies’ carbon neutrality information, firms that committed carbon neutrality need to be hand-collected. The initial search started from a company list of all firms in three indices (2605 firms in total). To determine which company have committed to realising carbon neutrality, we enter keywords such as ‘company name + carbon zero’, ‘company name + carbon neutrality’, or ‘company name + carbon neutral target’ on Google news website and Factiva database. By surfing the related news before 6th July 2021, we filtered out 202 firms. They all have clear announcements to reach carbon neutrality by a specific year. Notably, firms have realised carbon zero targets are not included in the sample.
Regarding independent variables, daily close prices are from CRSP, ESG performance proxy- ESG combined score is from Refinitiv, carbon disclosure proxy- carbon disclosure rating is from Carbon Disclosure Project (CDP), and firms’ financial indicators are from Compustat. Due to missing values, some firms are omitted from the initial sample (36 firms dropped). Overall, the final working sample in this paper contains 166 public firms with a carbon neutrality commitment, 108 firms from S&P 500, 21 from Russell 2000, and 37 from FTSE 100. Detailed information for the firms in our working sample is presented in Appendix 1.
ESG relevant scores are widely used in academic papers to represent organisational social, environmental, and governance performance (Gillan et al. Citation2021). However, ESG scoring standards vary in different databases. This study employs ESG Combined scores released by Refinitiv to measure firms’ ESG performance. Refinitiv is regarded as one of the most comprehensive ESG databases in the industry. It scores approximately 9,000 companies globally, covering over 70% of the global market cap, across more than 500 different ESG metrics, dating back to 2002. Moreover, compared to a single ESG Score, ESG Combined Score considers ESG Controversies overlay. Since ESG controversies category measures a company’s exposure to environmental, social and governance controversies and negative events reflected in global media, ESG Combined Score can reflect ESG performance more comprehensively.
According to previous studies concerning carbon disclosure analysis (Luo, Lan, and Tang Citation2012; Matisoff, Noonan, and O’Brien Citation2013), Carbon Disclosure Project (CDP) is a valid and reliable channel that provides information about firms’ carbon disclosure levels. Much research adopts CDP scoring to judge corporates’ carbon transparency (Luo, Lan, and Tang Citation2012; Depoers, Jeanjean, and Jérôme Citation2016; Li et al. Citation2018). CDP is an international non-profit organisation that runs the global environmental disclosure system for investors, companies, and governments to manage their environmental impacts. CDP was established in 2000, and the number of carbon-disclosing companies surged rapidly over the past two decades. By 2021, there will be 131 states and regions, 812 cities and over 9600 companies disclosing their environmental data through CDP, thus, CDP is one of the most comprehensive and wealthiest databases of carbon disclosure. The global economy regards CDP scoring on environmental disclosure as the gold standard to judge the corporation’s environmental transparency and action. As for the scoring mechanism, CDP evaluates corporations’ environmental action to reduce carbon emissions from four dimensions: climate change, supply chain, water, and forests annually.
This study employs scores regarding climate change as the carbon disclosure proxy. According to the scoring criterion, A and A- represent leadership level, B and B- represent management level, C and C- represent awareness level, D and D- represent disclosure level, F represents insufficient information to evaluate the carbon disclosure level. The dummy variable disclosure is constructed based on CDP scoring. If the score is above F, this study believes that the company have disclosed carbon information sufficiently. Thus, disclosure is equal to 1; if the scoring is F or missing value, disclosure is equal to 0.
The summary statistics of the full sample are shown in . All variables have been winsorised at the 1st and 99th percentiles to account for outliers, except for the dummy variable disclosure. There are 166 companies committing to reaching carbon neutrality in total. The average ESG combined score of these firms is 57.13. reports the correlation matrix of variables, all correlations between two variables are less than 0.5, which implies that there is no strong association among these variables.
Table 1. Definitions of variables.
Table 2. Summary statistics of the full sample.
Table 3. Correlation matrix of the full sample.
3.2. Methodology
This study firstly uses the event study methodology to assess the market reaction to carbon neutral pledges (hypothesis 1) and further examines the different responses by different groups using between-group analysis by country and carbon neutrality goal. Second, we utilize a regression model approach to examine whether ESG performance and carbon disclosure level would affect market reaction to the carbon neutrality commitment (hypotheses 2 and 3).
3.2.1. Event study
The event study methodology was arguably first introduced by Fama et al. (Citation1969), and has been widely used to assess the market reaction to economic and financial events. The essence of the event study is to examine the abnormal returns (AR) around the event day, and cumulative abnormal return (CAR) in the event window (Boehmer et al., Citation1991). The event study methodology is commonly used to investigate the relationship between environmental CSR events and market responses, such as pollution data release (Hamilton Citation1995), environmental awards (Klassen and McLaughlin Citation1996), ESG news (Capelle-Blancard and Petit Citation2019), and environmental enforcement regimes (Sam and Zhang Citation2020). However, little research is exploring how the market reacts to carbon neutrality commitments. This study is motivated to fill the gap.
We define the date when the firm announces the carbon neutrality target as the event day. As for the length of the event window, according to the efficient market hypothesis, stock prices would reflect all publicly available information in the semi-strong form market (Fama Citation1970). It is expected to observe the market reaction around the announcement date, while it cannot be excluded that the news would leak before the publication or get lagged reaction (Senchack and Starks Citation1993). Therefore, to observe the stock reaction to the publication of carbon neutrality news as comprehensively as possible, various lengths of event windows are included in the study. To be specific, we select [−3, +3], [−5, +5], [−7, +7], [−9, +9], [−11, +11] and [−13, +13] as event windows.
Furthermore, the estimation period is another key factor in the event study model. Since the announcement dates of firms are quite different, it is important to set a period before the carbon neutrality announcement for each firm to confirm its normal return, which acts as a benchmark to measure the deviation of stock returns caused by the event (Cowan and Sergeant Citation1996). In this study, we select [−155, −31] as the estimation window. Since the average number of trading days in a calendar year is around 250, a duration of 125 trading days covers the stock performance the half year before the carbon neutrality commitment, which is a standard estimation window in empirical studies (Barber and Loeffler Citation1993). If the estimation period is too long, the event of carbon neutrality commitment is more likely to overlap with other important events that affect the stock returns, thus leading to biases in predicting firms’ normal stock price performance. Similarly, if the estimation period is too short, it may not contain enough information on the stock prices, thus decreasing the statistical significance between abnormal returns and normal returns.
In terms of stock returns, we compute the abnormal return (AR), the cumulative abnormal return (CAR), and the cumulative average abnormal return (CAAR). Details of calculations can be found in Appendix 2.
3.2.2. Regression specification
Then, we use OLS regression to test hypothesis 2 and hypothesis 3, the market reaction to carbon neutrality commitment affected by carbon disclosure and ESG performance of firms. The dependent variable is the cumulative abnormal returns (CAR) from the event study, and the independent variables are Carbon disclosure (disclosure), ESG Combined score (ESGC), respectively. Several control variables are also considered in these regressions, including firm size (firmsize), financial leverage (leverage), total revenue per share (revenue), Price to Book ratio per share (PBratio), assets growth rate (growth), and returns on assets (ROA). Definitions of these variables are in .
Following the argument in the seminal research of Miah, Hasan, and Usman (2021) and Bolton and Kacperczyk (Citation2021) that industry could be a potential factor that causes bias in empirical results as
Firms from different industries respond differently to the announcement of green policies, we include industry fixed effect in all regressions.
To explore the separate effect and joint effect of carbon disclosure and ESG performance on market reaction respectively, this study employs a battery of regression models (see detailed explanation in Appendix 2). The first regression model explores the relation between ESG performance and cumulative abnormal returns (EquationEq. (1)(1)
(1) ).
The second model aims to test whether the carbon disclosure level would affect the market reaction to the carbon neutrality commitment (EquationEq. (2)(2)
(2) ).
Moreover, to test the joint impact of carbon disclosure and ESG performance, we construct the following model as EquationEq. (3)(3)
(3)
The fourth model explores whether there is an interaction effect between ESG performance and carbon disclosure on the market reaction EquationEq. (4)(4)
(4) .
Where ESG performance is measured by ESG combined score (ESGC). disclosure is a dummy variable, which equals one if firms reveal sufficient carbon relative information in CDP, otherwise, it is equal to 0. denotes firm controls, which include firm size, leverage, revenue, PB ratio, growth rate, and ROA.
is industry fixed effect.
4. Empirical results
4.1. Summary statistics
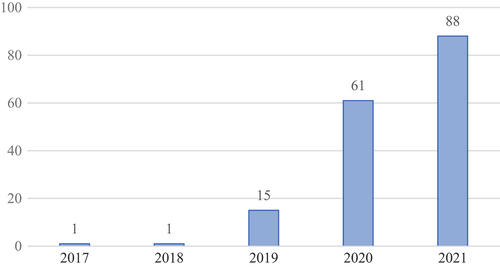
shows the distribution of companies by the time of carbon neutrality commitments from 2017 to 6 July 2021. It was observed that almost all companies in this sample made carbon-neutral commitments in 2020 and 2021, with only two companies making carbon-neutral commitments in the first two years. Overall, there has been an upward trend in companies announcing carbon neutrality plans over the past five years.
Figure 1. The distribution of the year when firms (in this study) made carbon neutrality commitments.
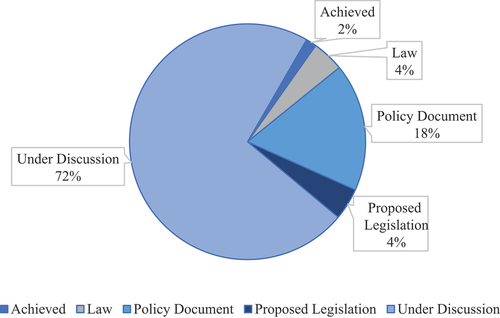
Based on full sample analysis, this study employs the between-group analysis to explore further the market reaction to the carbon neutrality commitment at the country level. According to the report released by National Public Utilities Council (NPUC, Citation2021), by 8 June 2021, over 137 countries have made carbon zero pledges, and two (Bhutan and Suriname) have realised the carbon neutrality target. Following the Paris Agreement’s goal to achieve a carbon peak as soon as possible and reach net zero in the second half of the 21st century, over 90% of these commitments plan to reach carbon neutrality around 2050 (shown in ). Setting a goal is an easy way toward carbon neutrality; the biggest challenge is to realise the progress. Hence, it is important to investigate the policies of each country to learn about this ambitious target. The most solid commitment is guaranteed by laws to realise, followed by official government policy, which governments may adjust dynamically. Likewise, proposed legislation shows forward momentum in making pledges a reality, but proposals can take a long time to become enacted. As shows, carbon neutral targets promised in law only account for 4% among 137 countries. The majority of pledges are only under discussion at this time.
Figure 2. The distribution of the target year when countries plan to reach carbon neutrality (by 8th June 2021).
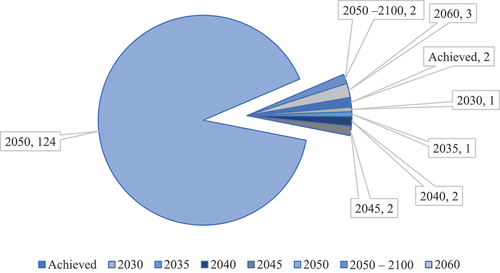
Figure 3. The distribution of national measures to realise carbon commitment (by 8th June 2021).
Given differences in carbon commitment targets and implementation measures among countries, we focus on US and UK firms in our full sample. Both the US and the UK target to reach carbon neutrality by 2050, the UK passes its carbon neutral target into law, while the US has this commitment set as official policy, which reflects that the UK has a stronger determination to achieve this goal. Besides the difference in supporting policies for carbon neutrality commitment, these two countries also differ in regulations, democracy, social preference, and environmental laws (Liang and Renneboog Citation2017), which may lead to unusual market reactions. Considering these differences, we conduct the between-group analysis to examine whether market reactions to carbon neutrality commitments vary in countries. shows between-group summary statistics categorised by country, specifically 129 companies from the US and 37 from the UK. We can see within each country, ESGC, Disclosure, Firm size, Leverage, Revenue, PB ratio, Growth, and ROA significantly increase after carbon neutrality commitment. Besides, the value of each variable is higher in UK firms compared to US firms, and the differences are also significant.
Table 4. Between-group summary statistics by country.
displays the distribution of the target year when firms plan to reach carbon neutrality. In this sample, 70 companies commit to reducing carbon emissions to zero by 2050. This target year is in line with the regional goal of these two countries, and other companies make earlier pledges. We divide the sample into long-term and short-term groups according to the target carbon-neutral year. The long-term group contains companies that target to realise the commitment by 2050, and the short-term group includes companies that plan to reach carbon neutrality ahead of 2050. shows between-group summary statistics categorised by goal type. There are 96 firms making pledges to be carbon neutral before 2050, and the other 70 companies keep pace with the national 2050’s carbon neutrality target. There are significant differences between short-term-goal firms and Long-term-goal firms from the perspectives of ESGC, Disclosure, Firm size, Leverage, Revenue, PB ratio, Growth, and ROA before and after the carbon neutrality commitment.
Figure 4. The distribution of the target year when firms (in this study) plan to reach carbon neutrality.
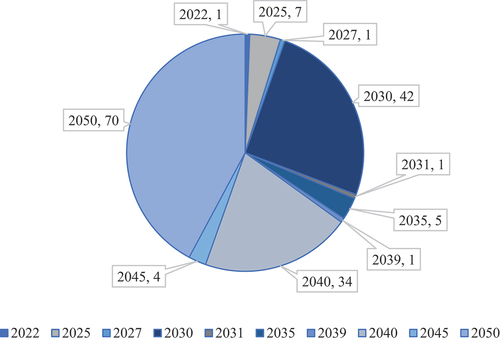
Table 5. Between-group summary statistics of variables by goal.
4.2. Event study
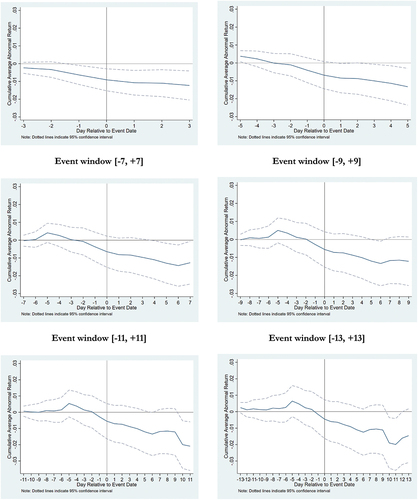
indicates the market reaction to the carbon neutrality commitment with different event windows. The average abnormal returns (AAR) are generally negative except for the event window of [−7, +7] and [−13, +13], while all these AAR are not statistically significant. Cumulative average abnormal returns (CAAR) span from −2.09% to −1.21%, all statistically significant during the event window period.
Table 6. Market reaction to carbon neutrality commitments (full sample).
intuitively displays the trend of cumulative changes in stock returns across different event windows. It is observable that on the fifth day before the carbon neutrality commitment experiences an unexpected increase in CAAR. After then, CAAR decrease continuously. The dramatic decline occurs around the tenth day after the event, and CAAR starts rebounding. Overall, this downward trend of CAAR generally reflects that the market shows negative attitudes towards such carbon zero pledges, therefore causing losses in firms’ market value in the short run. This negative market reaction is consistent with hypothesis 1a, which assumes that carbon neutrality commitment would harm firm value. Given hypothesis 1b is the opposite of hypothesis 1a, hypothesis 1b would be rejected accordingly. We conjecture these adverse reactions result from the investors’ worries about the potential costs of reaching carbon neutrality, such as installing recycling equipment, purchasing green raw materials, and raising the standards for waste disposal. Resources allocated to reducing carbon emissions would be viewed as an exchange for the future profits of firms. This view is in line with the trade-off theory (Friedman Citation1970).
Figure 5. Market reactions to carbon neutrality commitments in different event windows.
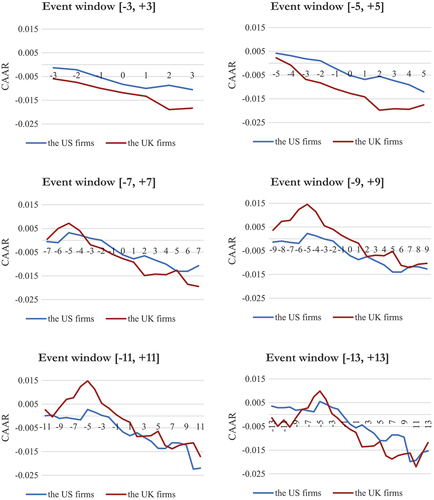
To explore the negative market reaction in detail, we conduct the between-group analysis at the country and goal-setting levels. shows market reactions to US and UK firms, respectively. CAAR of the US firms is statistically significant in three event windows: [−3, +3], [−5, +5] and [−11, +11]. Cumulative average abnormal returns are between −2.20% and −1.05%. The significance of CAAR in UK firms varies in different tests. We focus on the event window that passes both two types of tests, that is [−3, +3], [−5, +5], and [−7, +7]. The cumulative average abnormal returns range from -1.95% to -1.76%.
Table 7. Market reaction to carbon neutrality commitments (by country).
displays the CAAR trends of the two countries, CAAR of the UK firms is lower than that of the US firms during the event window of [−3, +3] and [−5, +5], which indicates that the market reacts more adversely to the carbon neutrality commitment by the UK firms in the shorter term. This evidence suggests that because the UK has stricter legitimacy about national carbon neutrality, firms are expected to take more pressure to realise the goal. The parallel trend becomes mixed with the increase of the event window length, but the overall impacts stayed negative across all event-window periods. Empirically, the US and the UK firms all suffer a loss in stock returns after committing to being carbon neutral. The UK market reacts more negatively during the shorter periods, while the difference in market reactions gradually narrows over time.
Figure 6. Market reactions to carbon neutrality commitments in different event windows by country.
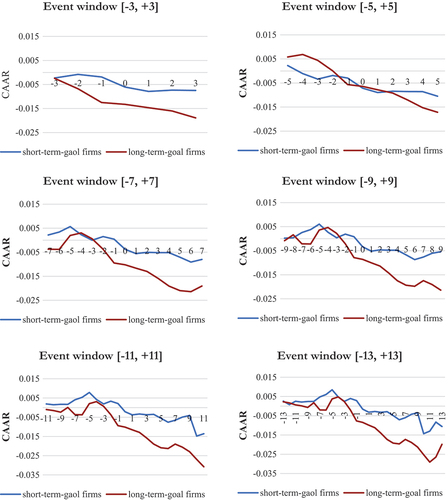
presents market reactions to the short-term-goal firms and long-term-goals respectively, CAARs of short-term-goal firms are between −1.36% to −0.54%, but their t statistics are not significant across these event windows. It is probably because the magnitude of CAARs is close to zero, which means that the market responds less to pledges that realise the carbon zero target earlier than 2050. In contrast, long-term-goal firms experience more aggregate losses in stock returns. Their CAARs range from −3.08% to −1.71% and are statistically significant except for the window of [−13, +13].
Table 8. Market reaction to carbon neutrality commitments (by goal).
As shown in , all event windows witness obvious drops in the market value of long-term-goal firms but not for short-term-goal firms. The gap in CAARs fluctuation between these two groups grows as the length of the event window increases. Results indicate that investors react more negatively to the firms committing to reach carbon neutrality by 2050. Long-term-goal firms are expected to make such pledges to correspond with the national target, or they acknowledge that their present environmental foundation is not good enough to reach carbon neutrality in the short term. Under these circumstances, the commitment to be carbon neutral would increase firms’ expenditures on environmental facilities and trigger losses in their future financial profits, which leads to more adverse market reactions to this group.
Figure 7. Market reactions to carbon neutrality commitments in different event windows by goal.
Overall, empirical evidence from the event study implies that the carbon neutrality commitment harms market value, CAARs of the whole sample range from −2.09% to −1.21%. This result supports hypothesis 1a whilst rejecting hypothesis 1b. Moreover, the between-group analysis by country indicates that both the UK and the US firms experienced losses in aggregate stock returns after making the carbon neutrality commitment, CAARs of the UK firms declined more sharply than that of the US firms during the 7-day and 11-day event periods. In addition, the between-group analysis by goal presents that firms planning to be carbon neutral by 2050 receive more negative reactions in market value, for which their CARRs decrease by −3.08% to −1.71% across different event windows. On the contrary, CAARs of firms with carbon neutrality target earlier than 2050 fluctuate slightly around zero, and the gap between firms with other goals grow gradually over time. In sum, between-group analyses show that negative market reactions vary in different groups.
4.3. Regression analysis
To further explore the influences of ESG performance and carbon disclosure on the market reaction to the carbon neutrality commitment, this study uses OLS regressions to examine hypotheses 2 and 3. The dependent variable is the cumulative abnormal return (CAR) in the event window [−5, +5]. Regression models are constructed as EquationEq. (1)(1)
(1) , EquationEq. (2)
(2)
(2) and EquationEq. (3)
(3)
(3) .
reports the regression results of CAR. Column (1) examines how ESG performance affects the market reaction to the carbon neutrality commitment. ESG performance is measured by ESG combined score (ESGC). The coefficient of ESGC is 0.0010 and statistically significant at a 1% level, which implies the positive relation between ESG performance and CAR. Specifically, firms with better ESG performance would receive a less negative market reaction to the carbon zero pledges. If firms improve the ESG combined score by one point, the negative cumulative abnormal return would be mitigated by 0.1%. This empirical result supports Hypothesis 2, namely ESG performance is positively associated with the market reaction to the carbon neutrality commitment.
Table 9. Regression analysis of CAR.
Column (2) in examines the impact of carbon disclosure level on market reaction. disclosure is a dummy variable, which equals one if firms reveal sufficient carbon relative information in CDP and 0 otherwise. The coefficient of disclosure is 0.069 and statistically significant at the 1% level, which implies that firms performing better in disclosing their carbon information would be rewarded with higher cumulative abnormal returns. Specifically, disclosing sufficient carbon information would decrease firms’ losses in aggregate stock returns by 7%. The effect of carbon disclosure on market reaction is economically significant since the average CAR of the full sample is −1.33%. This positive relation between carbon disclosure and market reaction to carbon neutrality commitment is consistent with Hypothesis 3.
Column (3) in further investigates the combined effect of carbon disclosure and ESG performance on market reaction. After including both proxies in the model, the coefficient of ESGC remains the same at 0.001, while the coefficient of disclosure decreases by 0.050. Both coefficients stay positive and are statistically significant 1% level. Therefore model (3) approves both Hypothesis 2 and Hypothesis 3. Furthermore, to explore whether there is an interaction effect between ESG performance and carbon disclosure on market reaction, column (4) includes the interaction term. The coefficient of is still statistically significant, which means that the effect of one variable on CAR does rely on another.
The empirical evidence above indicates that better ESG performance and a higher level of carbon disclosure could mitigate negative market reactions to the carbon neutrality commitment. These results could be explained by the trade-off theory (Friedman Citation1970) and consist with a certain stream of recent research (i.e. Garel and Petit-Romec Citation2021; Pástor, Stambaugh, and Taylor Citation2021). As for firms with higher ESG Combined scores, they already have better environmental, social, and governance foundations and would spend less on environmental strategies and facilities to reduce carbon footprints. As for firms with sufficient carbon disclosure, transparency of carbon information is likely to mitigate information asymmetry costs. Therefore, these firms are expected to reach carbon neutrality with lower costs. The estimated fewer exchanges in profits could mitigate negative responses to their carbon-zero pledges.
4.4. Robustness checks
Robust checks in this study contain two parts. First, based on the between-group analysis in the event study, carbon neutrality goal types are likely to influence the market reaction, so we incorporate these factors into models to examine whether they could cause bias in the results. Secondly, market reactions to carbon neutrality commitments vary in different event windows. To examine whether the impacts of carbon disclosure level and ESG performance on market reaction stay effective, we conduct research in other event windows.
We construct the dummy variable goal to check the potential omitted variable bias. If the carbon neutrality goal is planned to be achieved earlier than 2050, goal = 1, otherwise goal = 0. After adding the dummy variable, the results of these models remain stable, as shown in . Though we find some differences in market reaction between short-term and long-term firms through the event study, these differences are not significant enough to cause bias in the regression model.
Table 10. Robust checks with carbon neutrality goal types.
Since different event windows contain separate cumulative abnormal returns, we employ the other two event windows ([−3, +3]; [−7, +7]) to test whether the positive effects of ESGC and disclosure on market reaction are stable. Panel A reports the empirical results in the event window [−3, +3]. There is no apparent change in coefficients. The results are consistent with that in the event window [−5, +5]. Panel B reports the empirical results in the event window [−7, +7]. The significance and magnitude of coefficients only changed slightly, which verifies the robustness of our results.
Table 11. Robust checks in the event window [−3, +3] and [−7,+7].
5. Conclusion
This paper analyses the market reaction to firms’ carbon neutrality commitments through a case study and an empirical modelling study. We hand-collect data from Factiva and Google news and obtained 166 firms with the carbon neutrality commitment from indices of S&P 500, Russel 2000, and FTSE100 from 2017 to 2021.
Our event study argues an overall negative market reaction to firms’ pledges to be carbon neutral. The cumulative average abnormal returns (CAARs) are significantly negative across all short-term event windows. This evidence consists of the trade-off theory (Friedman Citation1970) and our hypothesis 1a. Engaging in environmental practices would cause extra costs to business operations, and improving environmental concerns conflicts with the organisational goal to maximise shareholders’ profits, therefore triggering a loss in firms’ market value (Aupperle, Carroll, and Hatfield Citation1985; Gray and Shadbegian Citation1995). Further research by between-group analysis provides more detailed evidence of the negative market reaction.
By categorising the full sample into US and UK firms, we further examine the market reaction at the country level and find that US firms experience less loss in market value in these shorter event windows. These different market reactions in countries are likely to result from the variation in environmental policies and laws regulations (Stewart Citation1993). Since the UK makes laws to guarantee the national carbon neutrality goal while the US only makes policies, the looser regulatory environment could mitigate the loss if firms fail to reach carbon neutrality. Therefore, the market is likely to regard carbon neutrality commitments made by the US firms are not so strict and react less negatively. Parallelly, by categorising the full sample into different carbon neutrality goals, we find the firms commit to reaching carbon neutrality earlier than 2050 perform better in CAAR than those planning to be carbon neutral by the year 2050. Setting the short-term carbon neutrality target reveals firms’ strong confidence to realise it. These firms tend to have better environmental foundations, which decrease additional expenditures on reducing green gas emissions. Based on the trade-off theory, these firms could reach carbon neutrality with less sacrifice in future profits, suffering less market value loss. These pieces of evidence have broad and timely policy implications.
In the regression modelling study, we use ESG combined score as the proxy for ESG performance and find that one point increase in the firm’s ESG combined score predicts a 0.1% increase in cumulative abnormal returns. This positive relation is consistent with our Hypothesis 2 as better ESG performance indicates the firm has better environmental, social and governance grounds in reducing carbon emissions, which decreases the costs to be carbon neutral. For the carbon disclosure proxy, we use disclosure ratings released by Carbon Disclosure Project. Empirical evidence shows that firms disclosing sufficient carbon information would mitigate the negative market reaction by 4.32% compared with counterparts. The average cumulative abnormal return is around −1.33% during the 11-day window, so carbon disclosure significantly influences the market reaction, which is consistent with Hypothesis 3. The positive relation between ESG performance and cumulative abnormal returns indicates that previous engagements in environmental and social practices finally bring benefits to firms.
The cumulative abnormal returns in this study are in the short term as it could only capture the market reaction closely to the event. However, although engaging in environmental practices would add firms’ inputs in environmental infrastructure in the short term, reducing greenhouse gas emissions corresponds to the sustainable development of the whole society (Baumgartner and Zielowski Citation2007). Firms are likely to be rewarded in other channels, such as tax preferences and easier access to bank loans (Quan et al., 2017), which could benefit corporates in the long term. Since the intangible benefits, such as better brand images and higher social recognitions are hard to evaluate, the overall impact is likely to be positive after incorporating other interest groups’ effects. There is a widespread consensus to develop a sustainable economy, and the common concerns for climate change provoke stakeholders’ preference for such environmentally responsible corporates (Bushee Citation2001), as making carbon zero pledges is consistent with stakeholders’ environmental care.
This study also brings insights for future studies. With the growing trend of firms making such carbon zero pledges, subsequent studies could conduct research on more companies, making the sample more multiple. Meanwhile, since this study concentrates on the short-term impacts, further research could track the long-term financial performance of these firms to enrich this conclusion from the time dimension.
Disclosure statement
No potential conflict of interest was reported by the author(s).
Additional information
Notes on contributors
Xinyi Xie
Xinyi Xie got the master’s degree in Finance from the Business School of the University of Edinburgh; she obtained her bachelor’s degree in Finance and Banking from the School of Economics & Management of Southeast University.
Jianan Lu
Jianan Lu is currently a Research Fellow at the School of Accounting, Finance & Economics, University of Portsmouth. Jianan received his Ph.D. from the University of Edinburgh and recently finished a Post-Doc in the University of Oxford.
Mao Li
Mao Li is a doctoral researcher and teaching assistant in the Accounting and Finance Group at the University of Edinburgh Business School. She studied for a Bachelor’s degree in Finance at the Southwestern University of Finance and Economics in China. She obtained her MSc in Accounting, Finance, and Management at the University of Bristol in the UK.
Jiang Dai
Jiang Dai is a doctoral researcher and teaching assistant in the Accounting and Finance Group at the University of Edinburgh Business School. He studied for a Bachelor’s degree in Financial Engineering at the Beijing Technology and Business University in China. He obtained his MSc in International Banking and Finance at the University of Glasgow in the UK.
Notes
1. To achieve the carbon neutral goal, 137 countries have made carbon neutrality commitments and released supporting policies (National Public Utilities Council Citation2021). 68% of the global economy and 21% of the world’s 2,000 largest public companies have committed to be carbon neutral by March 2021 (Oxford Net Zero and the Energy and Climate Intelligence Unit, 2021).
References
- Affleck-Graves, J., C. M. Callahan, and R. Ramanan. 2000. “Detecting Abnormal Bid-Ask Spread: A Comparison of Event Study Methods.” Review of Quantitative Finance and Accounting 14 (1): 45–65. doi:10.1023/A:1008328107489.
- Alberti, M., L. Caini, A. Calabrese, and D. Rossi. 2000. “Evaluation of the Costs and Benefits of an Environmental Management System.” International Journal of Production Research 38 (17): 4455–4466. doi:10.1080/00207540050205226.
- Amba, S. M. 2014. “Corporate Governance and Firms’ Financial Performance.” Journal of Academic and Business Ethics 8 (1): 1.
- Arora, S., and S. Gangopadhyay. 1995. “Toward a Theoretical Model of Voluntary Overcompliance.” Journal of Economic Behavior & Organization 28 (3): 289–309. doi:10.1016/0167-2681(95)00037-2.
- Aupperle, K. E., A. B. Carroll, and J. D. Hatfield. 1985. “An Empirical Examination of the Relationship Between Corporate Social Responsibility and Profitability.” Academy of Management Journal 28 (2): 446–463. doi:10.2307/256210.
- Barber, B. M., and D. Loeffler. 1993. “The “Dartboard” Column: Second-Hand Information and Price Pressure.” The Journal of Financial and Quantitative Analysis 28 (2): 273–284. doi:10.2307/2331290.
- Barney, J. 1991. “Firm Resources and Sustained Competitive Advantage.” Journal of Management 17 (1): 99–120. doi:10.1177/014920639101700108.
- Baron, D. P. 2009. “A Positive Theory of Moral Management, Social Pressure, and Corporate Social Performance.” Journal of Economics & Management Strategy 18 (1): 7–43. doi:10.1111/j.1530-9134.2009.00206.x.
- Barth, M. E., and M. F. McNichols. 1994. “Estimation and Market Valuation of Environmental Liabilities Relating to Superfund Sites.” Journal of Accounting Research 32: 177–209. doi:10.2307/2491446.
- Bauman, C. W., and L. J. Skitka. 2012. “Corporate Social Responsibility as a Source of Employee Satisfaction.” Research in Organisational Behavior 32: 63–86. doi:10.1016/j.riob.2012.11.002.
- Baumgartner, R. J., and C. Zielowski. 2007. “Analysing Zero Emission Strategies Regarding Impact on Organisational Culture and Contribution to Sustainable Development.” Journal of Cleaner Production 15 (13–14): 1321–1327. doi:10.1016/j.jclepro.2006.07.016.
- Bhandari, A., and D. Javakhadze. 2017. “Corporate Social Responsibility and Capital Allocation Efficiency.” Journal of Corporate Finance 43: 354–377. doi:10.1016/j.jcorpfin.2017.01.012.
- Bhattacharya, C. B., D. Korschun, and S. Sen. 2009. “Strengthening Stakeholder–Company Relationships Through Mutually Beneficial Corporate Social Responsibility Initiatives.” Journal of Business Ethics 85 (2): 257–272. doi:10.1007/s10551-008-9730-3.
- Boehmer, E., J. Masumeci, and A. B. Poulsen. 1991. “Event-Study Methodology Under Conditions of Event-Induced Variance.” Journal of Financial Economics 30 (2): 253–272.
- Bolton, P., and M. Kacperczyk. 2021. “Do Investors Care About Carbon Risk?” Journal of Financial Economics 142 (2): 517–549. doi:10.1016/j.jfineco.2021.05.008.
- Bragdon, J. H., and J. Marlin. 1972. “Is Pollution Profitable.” Risk Management 19 (4): 9–18.
- Branco, M. C., and L. L. Rodrigues. 2006. “Corporate Social Responsibility and Trade-Based Perspectives.” Journal of Business Ethics 69 (2): 111–132. doi:10.1007/s10551-006-9071-z.
- Brown, S. J., and J. B. Warner. 1985. “Using Daily Stock Returns: The Case of Event Studies.” Journal of Financial Economics 14 (1): 3–31. doi:10.1016/0304-405X(85)90042-X.
- Bushee, B. J. 2001. “Do Institutional Investors Prefer Near‐term Earnings Over Long‐run Value?” Contemporary Accounting Research 18 (2): 207–246. doi:10.1506/J4GU-BHWH-8HME-LE0X.
- Capelle-Blancard, G., and A. Petit. 2019. “Every Little Helps? ESG News and Stock Market Reaction.” Journal of Business Ethics 157 (2): 543–565. doi:10.1007/s10551-017-3667-3.
- Chen, K. H., and R. W. Metcalf. 1980. “The Relationship Between Pollution Control Record and Financial Indicators Revisited.” The Accounting Review 55 (1): 168–177.
- Chen, L., G. Msigwa, M. Yang, A. I. Osman, S. Fawzy, D. W. Rooney, and P. -S. Yap. 2022. “Strategies to Achieve a Carbon Neutral Society: A Review.” Environmental Chemistry Letters 20 (4): 1–34. doi:10.1007/s10311-022-01435-8.
- Cowan, A. R., and A. M. Sergeant. 1996. “Trading Frequency and Event Study Test Specification.” Journal of Banking & Finance 20 (10): 1731–1757. doi:10.1016/S0378-4266(96)00021-0.
- Delmas, M. A., and V. C. Burbano. 2011. “The Drivers of Greenwashing.” California Management Review 54 (1): 64–87. doi:10.1525/cmr.2011.54.1.64.
- Depoers, F., T. Jeanjean, and T. Jérôme. 2016. “Voluntary Disclosure of Greenhouse Gas Emissions: Contrasting the Carbon Disclosure Project and Corporate Reports.” Journal of Business Ethics 134 (3): 445–461. doi:10.1007/s10551-014-2432-0.
- Dhaliwal, D. S., O. Z. Li, A. Tsang, and Y. G. Yang. 2011. “Voluntary Nonfinancial Disclosure and the Cost of Equity Capital: The Initiation of Corporate Social Responsibility Reporting.” The Accounting Review 86 (1): 59–100. doi:10.2308/accr.00000005.
- Dhanda, K. K., and L. P. Hartman. 2011. “The Ethics of Carbon Neutrality: A Critical Examination of Voluntary Carbon Offset Providers.” Journal of Business Ethics 100 (1): 119–149. doi:10.1007/s10551-011-0766-4.
- Du, X. 2015. “How the Market Values Greenwashing? Evidence from China.” Journal of Business Ethics 128 (3): 547–574. doi:10.1007/s10551-014-2122-y.
- Dutton, J. E., and J. M. Dukerich. 1991. “Keeping an Eye on the Mirror: Image and Identity in Organisational Adaptation.” Academy of Management Journal 34 (3): 517–554. doi:10.2307/256405.
- El Ghoul, S., O. Guedhami, H. Kim, and K. Park. 2018. “Corporate Environmental Responsibility and the Cost of Capital: International Evidence.” Journal of Business Ethics 149 (2): 335–361. doi:10.1007/s10551-015-3005-6.
- Fama, E. F. 1970. “Session Topic: Stock Market Price Behavior.” The Journal of Finance 25 (2): 383–417. doi:10.2307/2325486.
- Fama, E. F., L. Fisher, M. Jensen, and R. Roll. 1969. “The Adjustment of Stock Prices to New Information.” International economic review 10 (1): 1. doi:10.2307/2525569.
- Faysal, S., M. Salehi, and M. Moradi. 2021. “Impact of Corporate Governance Mechanisms on the Cost of Equity Capital in Emerging Markets.” Journal of Public Affairs 21 (2): e2166. doi:10.1002/pa.2166.
- Feldman, S. J., P. A. Soyka, and P. G. Ameer. 1997. “Does Improving a Firm’s Environmental Management System and Environmental Performance Result in a Higher Stock Price?” The Journal of Investing 6 (4): 87–97. doi:10.3905/joi.1997.87.
- Field, C.B. and Barros, V.R. ., 2014. Climate change 2014–Impacts, adaptation and vulnerability: Regional aspects. Cambridge University Press.
- Friede, G., T. Busch, and A. Bassen. 2015. “ESG and Financial Performance: Aggregated Evidence from More Than 2000 Empirical Studies.” Journal of Sustainable Finance & Investment 5 (4): 210–233. doi:10.1080/20430795.2015.1118917.
- Friedman, M. 1970. “Comment on Tobin.” The Quarterly Journal of Economics 84 (2): 318–327. doi:10.2307/1883017.
- Garel, A., and A. Petit-Romec. 2021. “Investor Rewards to Environmental Responsibility: Evidence from the COVID-19 Crisis.” Journal of Corporate Finance 68: 101948. doi:10.1016/j.jcorpfin.2021.101948.
- Gillan, S. L., A. Koch, and L. T. Starks. 2021. “Firms and Social Responsibility: A Review of ESG and CSR Research in Corporate Finance.” Journal of Corporate Finance 66: 101889.
- Godfrey, P. C. 2005. “The Relationship Between Corporate Philanthropy and Shareholder Wealth: A Risk Management Perspective.” Academy of Management Review 30 (4): 777–798. doi:10.5465/amr.2005.18378878.
- Grant, R. M. 1991. “The Resource-Based Theory of Competitive Advantage: Implications for Strategy Formulation.” California Management Review 33 (3): 114–135. doi:10.2307/41166664.
- Gray, W. B., and R. J. Shadbegian. 1995. “Pollution Abatement Costs, Regulation, and Plant-Level Productivity.“ NBER Working Paper (January 1995): 4994. doi:10.3386/w4994.
- Griffin, P. A., and Y. Sun. 2013. “Going Green: Market Reaction to CSRwire News Releases.” Journal of Accounting and Public Policy 32 (2): 93–113. doi:10.1016/j.jaccpubpol.2013.02.002.
- Hamilton, J. T. 1995. “Pollution as News: Media and Stock Market Reactions to the Toxics Release Inventory Data.” Journal of Environmental Economics and Management 28 (1): 98–113. doi:10.1006/jeem.1995.1007.
- Hassel, L., H. Nilsson, and S. Nyquist. 2005. “The Value Relevance of Environmental Performance.” European Accounting Review 14 (1): 41–61. doi:10.1080/0963818042000279722.
- Herremans, I. M., P. Akathaporn, and M. McInnes. 1993. “An Investigation of Corporate Social Responsibility Reputation and Economic Performance.” Accounting, Organisations and Society 18 (7–8): 587–604. doi:10.1016/0361-3682(93)90044-7.
- Hoshino, T., K. Yura, and K. Hitomi. 1995. “Optimisation Analysis for Recycle-Oriented Manufacturing Systems.” International Journal of Production Research 33 (8): 2069–2078. doi:10.1080/00207549508904802.
- Jaggi, B., and M. Freedman. 1992. “An Examination of the Impact of Pollution Performance on Economic and Market Performance: Pulp and Paper Firms.” Journal of Business Finance & Accounting 19 (5): 697–713. doi:10.1111/j.1468-5957.1992.tb00652.x.
- Jensen, M. C. 1986. “Agency Costs of Free Cash Flow, Corporate Finance, and Takeovers.” The American Economic Review 76 (2): 323–329.
- Kehoe, R. R., and P. M. Wright. 2013. “The Impact of High-Performance Human Resource Practices on Employees’ Attitudes and Behaviors.” Journal of Management 39 (2): 366–391. doi:10.1177/0149206310365901.
- King, A. A., and M. J. Lenox. 2001. “Does It Really Pay to Be Green? An Empirical Study of Firm Environmental and Financial Performance: An Empirical Study of Firm Environmental and Financial Performance.” Journal of Industrial Ecology 5 (1): 105–116. doi:10.1162/108819801753358526.
- Klassen, R. D., and C. P. McLaughlin. 1996. “The Impact of Environmental Management on Firm Performance.” Management science 42 (8): 1199–1214. doi:10.1287/mnsc.42.8.1199.
- Klassen, R. D., and D. C. Whybark. 1994. “Barriers to the Management of International Operations.” Journal of Operations Management 11 (4): 385–396. doi:10.1016/S0272-6963(97)90006-1.
- Krüger, P. 2015. “Corporate Goodness and Shareholder Wealth.” Journal of Financial Economics 115 (2): 304–329. doi:10.1016/j.jfineco.2014.09.008.
- Lanis, R., and G. Richardson. 2015. “Is Corporate Social Responsibility Performance Associated with Tax Avoidance?” Journal of Business Ethics 127 (2): 439–457. doi:10.1007/s10551-014-2052-8.
- Lee, E. M., S. Y. Park, and H. J. Lee. 2013. “Employee Perception of CSR Activities: Its Antecedents and Consequences.” Journal of Business Research 66 (10): 1716–1724. doi:10.1016/j.jbusres.2012.11.008.
- Lemma, T. T., M. A. Shabestari, M. Freedman, and M. Mlilo. 2020. “Corporate Carbon Risk Exposure, Voluntary Disclosure, and Financial Reporting Quality.” Business Strategy and the Environment 29 (5): 2130–2143. doi:10.1002/bse.2499.
- Lewis, A., and C. Juravle. 2010. “Morals, Markets and Sustainable Investments: A Qualitative Study of ‘Champions’.” Journal of Business Ethics 93 (3): 483–494. doi:10.1007/s10551-009-0235-5.
- Liang, H., and L. Renneboog. 2017. “On the Foundations of Corporate Social Responsibility.” The Journal of Finance 72 (2): 853–910. doi:10.1111/jofi.12487.
- Li, D., M. Huang, S. Ren, X. Chen, and L. Ning. 2018. “Environmental Legitimacy, Green Innovation, and Corporate Carbon Disclosure: Evidence from CDP China 100.” Journal of Business Ethics 150 (4): 1089–1104. doi:10.1007/s10551-016-3187-6.
- Luo, L., Y. C. Lan, and Q. Tang. 2012. “Corporate Incentives to Disclose Carbon Information: Evidence from the CDP Global 500 Report.” Journal of International Financial Management & Accounting 23 (2): 93–120. doi:10.1111/j.1467-646X.2012.01055.x.
- Matisoff, D. C., D. S. Noonan, and J. J. O’Brien. 2013. “Convergence in Environmental Reporting: Assessing the Carbon Disclosure Project.” Business Strategy and the Environment 22 (5): 285–305. doi:10.1002/bse.1741.
- Matsumura, E. M., R. Prakash, and S. C. Vera-Munoz. 2014. “Firm-Value Effects of Carbon Emissions and Carbon Disclosures.” The Accounting Review 89 (2): 695–724. doi:10.2308/accr-50629.
- McLaughlin, P. 2011. “Climate Change, Adaptation, and Vulnerability: Reconceptualising Societal–Environment Interaction Within a Socially Constructed Adaptive Landscape.” Organization & Environment 24 (3): 269–291. doi:10.1177/1086026611419862.
- National Public Utilities Council 2021, National Public Utilities Council website, https://www.motive-power.com/national-public-utilities-council/ 25 12 2022
- National Public Utilities Council. (2021). Race to Net Zero: Carbon Neutral Goals by Country. Available at: https://www.visualcapitalist.com/race-to-net-zero-carbon-neutral-goals-by-country/
- Neville, B. A., S. J. Bell, B. Mengüç, and M. J. Polonsky. 2005. “Corporate Reputation, Stakeholders and the Social Performance‐financial Performance Relationship.” European Journal of Marketing 39 (9/10): 1184–1198. doi:10.1108/03090560510610798.
- Palmer, K., W. E. Oates, and P. R. Portney. 1995. “Tightening Environmental Standards: The Benefit-Cost or the No-Cost Paradigm?” Journal of Economic Perspectives 9 (4): 119–132. doi:10.1257/jep.9.4.119.
- Pástor, Ľ., R. F. Stambaugh, and L. A. Taylor. 2021. “Sustainable Investing in Equilibrium.” Journal of Financial Economics 142 (2): 550–571. doi:10.1016/j.jfineco.2020.12.011.
- Patell, J. M. 1976. “Corporate Forecasts of Earnings per Share and Stock Price Behavior: Empirical Test.” Journal of Accounting Research 14 (2): 246–276. doi:10.2307/2490543.
- Peteraf, M. A. 1993. “The Cornerstones of Competitive Advantage: A Resource‐based View.” Strategic Management Journal 14 (3): 179–191. doi:10.1002/smj.4250140303.
- Ramus, C. A., and I. Montiel. 2005. “When are Corporate Environmental Policies a Form of Greenwashing?” Business & Society 44 (4): 377–414. doi:10.1177/0007650305278120.
- Russo, M. V., and P. A. Fouts. 1997. “A Resource-Based Perspective on Corporate Environmental Performance and Profitability.” Academy of Management Journal 40 (3): 534–559. doi:10.2307/257052.
- Sam, A. G., and X. Zhang. 2020. “Value Relevance of the New Environmental Enforcement Regime in China.” Journal of Corporate Finance 62: 101573. doi:10.1016/j.jcorpfin.2020.101573.
- Schnietz, K. E., and M. J. Epstein. 2005. “Exploring the Financial Value of a Reputation for Corporate Social Responsibility During a Crisis.” Corporate Reputation Review 7 (4): 327–345. doi:10.1057/palgrave.crr.1540230.
- Senchack, A. J., and L. T. Starks. 1993. “Short-Sale Restrictions and Market Reaction to Short-Interest Announcements.” The Journal of Financial and Quantitative Analysis 28 (2): 177–194. doi:10.2307/2331285.
- Shleifer, A., and R. W. Vishny. 1997. “A Survey of Corporate Governance.” The Journal of Finance 52 (2): 737–783. doi:10.1111/j.1540-6261.1997.tb04820.x.
- Spicer, B. H. 1978. “Investors, Corporate Social Performance and Information Disclosure: An Empirical Study.” The Accounting Review 53 (1): 94–111.
- Stewart, R. B. 1993. “Environmental Regulation and International Competitiveness.” The Yale Law Journal 102 (8): 2039. doi:10.2307/796859.
- Tziner, A., L. Oren, Y. Bar, and G. Kadosh. 2011. “Corporate Social Responsibility, Organisational Justice and Job Satisfaction: How Do They Interrelate, if at All?” Journal of Work and Organizational Psychology 27 (1): 67–72. doi:10.5093/tr2011v27n1a7.
- United Nations. (2020). Commitments to Net Zero Double in Less Than a Year. Available at: https://unfccc.int/news/commitments-to-net-zero-double-in-less-than-a-year
- United Nations Environment Programme. (2020). Adaptation Gap Report 2020. Available at: https://www.unep.org/resources/adaptation-gap-report-2020
- Walley, N., and B. Whitehead. 1994. “It’s Not Easy Being Green.” Reader in Business and the Environment 36 (81): 4.
- Wang, Y., Z. Wu, and G. Zhang. 2022. “Firms and Climate Change: A Review of Carbon Risk in Corporate Finance.” Carbon Neutrality 1 (1): 1–10. doi:10.1007/s43979-022-00005-9.
- Wernerfelt, B. 1984. “A Resource‐based View of the Firm.” Strategic Management Journal 5 (2): 171–180. doi:10.1002/smj.4250050207.
Appendix
Table A1: Sample of 166 companies that made the carbon neutrality commitment
Event Day: The date the firm makes the carbon neutrality commitment
Target Year: The year the firm plans to reach the carbon neutrality
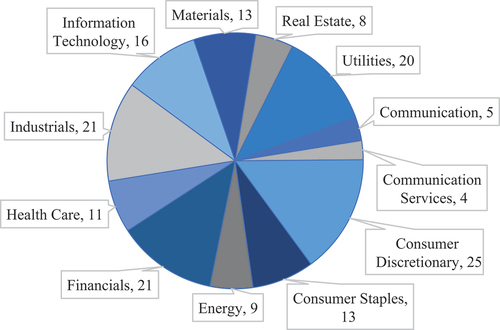
Figure A1. The industry distribution of firms (in this study).
Appendix 2
First, we use daily close prices to calculate the stock return of firms (EquationEq. (1))(1)
(1) and market return of indices (EquationEq. (2))
(2)
(2)
: the stock return on date t for company i
: the market return on date t for index m
: Daily Close Price for company i
: Daily Close Price for index m
Second, I use the market model to estimate the correlation between stock returns and market returns (EquationEq. (3)(3)
(3) ), then computing the estimated normal return as EquationEq. (4)
(4)
(4) .
: the estimated normal return on date t for company i
: the random noise term,
Next, the abnormal return on date t for company i () can be computed as the difference between the actual stock return and the estimated stock return (EquationEq. (5)
(A5)
(A5) ).
Then I calculate the cumulative abnormal return on date t for company i during the whole event window, which is equal to the sum of abnormal returns (EquationEq. (6)(A6)
(A6) ).
Furthermore, I calculate the average abnormal return () in the event window, which is equal to the mean value of abnormal returns for all stocks in the sample (EquationEq. (7)
(A7)
(A7) ).
N: the number of companies
Finally, is an important indicator to analyse the overall market reaction to the news during the event window, which contains the aggregate effect of abnormal returns. I compute the cumulative average abnormal return (
) by summing the average abnormal returns during the period T (EquationEq. (8)
(A8)
(A8) ).
T: the length (total days) of the whole event window
After capturing the cumulative average abnormal return (), I use both Student’s t test and Patell test to examine the statistical significance. Patell test was first introduced by Patell (Citation1976), compared to other test statistics, Patell test statistic is more powerful because it considers cross-sectional independence of prediction errors (Brown & Warner, Citation1985; Affleck-Graves et al., Citation2000). Patell test assumes that the prediction errors are normally distributed and cross-sectionally independent, under these assumptions, it standardises the prediction error firm each stock by its standard deviation. The test statistic Z (patell) is computed as EquationEq. (9)
(A9)
(A9) and EquationEq. (10)
(A10)
(A10) , the null hypothesis for the test is that the cumulative average abnormal return (CAAR) equals zero.
: the standardised cumulative abnormal return for company i
: variance of the cumulative abnormal return for company i