
Abstract
Purpose: The purpose of this study is to investigate placental ghrelin and leptin expression as well as cord blood ghrelin and adiponectin levels in maternal obesity and associations between placental ghrelin expression, cord blood ghrelin levels and maternal and infant variables.
Materials and methods: Placental ghrelin and leptin expression were analyzed by RT-PCR in 32 severely obese and 32 matched normal-weight women. Cord blood ghrelin, adiponectin, leptin, and C-peptide concentrations were analyzed by ELISA.
Results: Neither ghrelin nor leptin expression and neither cord blood ghrelin nor adiponectin levels differed between the groups. Placental ghrelin expression was associated with BMI at delivery in the obese women (r = 0.424, p = .016) and in the infants born to normal-weight women with their weight z-scores at six (r = −0.642, p = .010), nine (r = −0.441, p = .015), and 12 months of age (r = −0.402, p = .028).
Conclusions: Placental ghrelin and leptin expression as well as cord blood ghrelin and adiponectin levels do not seem to be altered in severe maternal obesity. Placenta-derived ghrelin may influence the infants’ postnatal weight gain, but possibly only when the mother has normal weight.
Introduction
Obesity is associated with changes in the circulating levels of the appetite-regulating hormones ghrelin and leptin [Citation1] as well as with decreased levels of the insulin-sensitizing adipocytokine adiponectin [Citation2]. Approximately 30% of all women of reproductive age in the USA are obese [Citation3]. Maternal obesity in pregnancy influences fetal development and growth, and also the child’s postnatal growth and long-term risk of diseases [Citation4]. These effects may be mediated at least partly by changes in the placenta [Citation4]. The full-term placenta expresses both ghrelin and leptin mRNA but not adiponectin mRNA [Citation5]. Similar to obesity, gestational diabetes mellitus (GDM) is characterized by increased insulin resistance. In GDM, both ghrelin and leptin expressions in the placenta have been shown to be increased [Citation6,Citation7]. However, to our knowledge, the placental expression of ghrelin in maternal obesity has not been described yet. We and others have found that placental leptin expression is not altered in maternal obesity [Citation8,Citation9]. However, the results of gene expression studies are influenced by the choice of reference genes used for normalization [Citation10].
In this study, we aimed to investigate placental ghrelin and leptin expression in severely obese women using the combined results of reference genes shown to be stable in our samples for normalization. We also aimed to characterize placental ghrelin expression using maternal and infant variables since knowledge of the physiological role of placenta-derived ghrelin is sparse.
Ghrelin, adiponectin, and leptin have been proposed to have important physiological roles in fetal development and growth, but these roles are not yet fully understood [Citation9,Citation11,Citation12]. Several studies [Citation12–14] but not all [Citation15,Citation16] have found a negative correlation between cord blood ghrelin levels and birth weight. Cord blood ghrelin levels have also been found to be associated with postnatal weight gain [Citation15,Citation17]. Recently, Karakulak et al. [Citation14] found that cord blood ghrelin levels were decreased in infants born to mothers with GDM even after adjustment for birth weight. In children older than newborn babies, ghrelin levels are found to be associated with leptin, adiponectin, and insulin levels [Citation18]. Whether these associations already exist in fetal life is not known.
Several studies have shown that cord blood leptin and adiponectin levels correlate positively with birth weight [Citation9,Citation19]. However, conflicting results have been obtained regarding the possible association between adiponectin and insulin levels in cord blood [Citation20,Citation21]. Furthermore, leptin levels in cord blood have been shown to be increased in maternal obesity [Citation9]. However, to the best of our knowledge, whether fetal ghrelin or adiponectin levels are altered in maternal obesity is not known.
The second aim of this study was to investigate cord blood ghrelin and adiponectin levels in infants born to severely obese mothers and to investigate associations between cord blood ghrelin levels and birth size, postnatal weight gain, cord blood leptin, adiponectin, and C-peptide levels, as well as between cord blood adiponectin levels and C-peptide levels.
Materials and methods
Cases and controls
Placental tissue and cord blood samples were collected from a biobank at Örebro University Hospital, Örebro, Sweden. The sample collection in the biobank contains samples from almost 10,000 women who gave birth at the Delivery Department of Örebro University Hospital, Örebro, from 2004 to 2012. Due to insufficient background information on births during 2004–2007, all cases and controls in this study gave birth during 2008–2012. Inclusion criteria for the cases were: BMI ≥35 kg/m2 in early pregnancy (gestational weeks 6–10), uncomplicated singleton pregnancy, and vaginal delivery at full term (gestational age: 37–42 weeks). Exclusion criteria were the presence of any chronic disease; GDM; hypertensive disorders, such as pregnancy-induced hypertension (systolic blood pressure ≥140 mm Hg or diastolic blood pressure ≥90 mm Hg) or preeclampsia; smoking; known infection during the pregnancy; caesarean section; and asphyxia of the newborn (defined as Apgar score <7 at 5 min of age). Caesarean section was excluded since it may influence variables examined in this study. Cord blood adiponectin levels have been found to be decreased in infants born by elective caesarean section [Citation22]. GDM was excluded by measuring random plasma glucose values during the pregnancy according to the Swedish prenatal screening program.
We found 32 women in the biobank fulfilling all of the inclusion and none of the exclusion criteria, and they constituted the cases in this study. Their characteristics have been described previously [Citation8]. For each case, we identified one normal-weight (BMI 18.8–24.9 kg/m2 in early pregnancy) control, matched for age (±1 year), parity (nulliparous or multiparous), and gestational age (±3 d). The controls fulfilled the same inclusion criteria as the cases, except for BMI, and none of the exclusion criteria. Furthermore, the controls were also required to have a gestational weight gain (GWG) within current recommendations (11 − 16 kg) [Citation23]. The GWG of the obese women was not restricted due to the limited number of eligible cases. The BMI at delivery was calculated for all women.
Written informed consent was obtained from all participating women, and the study was approved by the Ethical Review Board in Uppsala, Sweden (2010/189).
Sample collection
Placental tissue samples were collected immediately after delivery. The decidual layer at the basal plate was removed. Two pieces from the interior of the placenta were collected and rinsed in 30 mL of cold phosphate buffered saline (Gibco, Life Technologies, Stockholm, Sweden) to remove any blood, as previously described [Citation8]. The marginal portion and the area near the cord were avoided. The tissues were then frozen in 3 mL of RNAlater (Ambion, Stockholm, Sweden) at −80 °C.
Cord venous blood samples were taken at the time of delivery using 10-mL clot activator tubes (BD Vacutainer, Plymouth, United Kingdom) and centrifuged at 2000 × g for 7 min. The serum was stored frozen in separate aliquots at −80 °C.
RNA extraction and cDNA synthesis
Total RNA was isolated using the RNeasy Midi Kit (Qiagen, Nordic, Sollentuna, Sweden) following the instructions from the manufacturer, as described previously in detail [Citation8]. The sample purity (260/280) as measured with a Thermo Scientific Nanodrop 2000 (Fisher Scientific, Göteborg, Sweden) was >1.0 in all samples. The RNA integrity measured by an Agilent Bioanalyzer 2100 (Agilent Technology, Kista, Sweden) was between 6.2 and 8.8 in all samples.
To produce cDNA, the High Capacity cDNA Reverse Transcription Kit (Applied Biosystems, Foster City, CA) was used according to the protocol by the manufacturer, and 1 µg of the total RNA per sample served as the template.
RT-PCR and reference genes
To measure the levels of ghrelin and leptin transcripts, the real-time polymerase chain reaction (RT-PCR) was performed using a 7900 Fast Real-Time PCR System (Applied Biosystems, Foster City, CA) with fluorescent probes from the same company (Taq-Man Gene Expression Assays). The primers used were Hs01074053_m1 and Hs00174877_m1 for ghrelin and leptin, respectively.
As possible reference genes, we measured the expression of tyrosine 3-monooxygenase/tryptophan 5-monooxygenase activation protein, zeta polypeptide (YWHAZ), cytochrome c-1 (CYC1), topoisomerase 1 (TOP1), and TATA-box-binding protein (TBP). Their respective primers were Hs03044281_g1, Hs00357718_g1, Hs00243257_m1, and Hs00427620_m1. Their stability values were calculated according to NormFinder [Citation24]. The best stability value (0.013) was obtained using a combination of CYC1 and TOP1. Thus, both ghrelin and leptin expression were normalized to the mean expression of CYC1 and TOP1.
Crossing threshold (Ct) values were calculated by the 7900 Fast Real-Time PCR System software (Applied Biosystems, Foster City, CA) provided by the manufacturer. All Ct values >35 or “not detected” were considered negative. Quantification of the gene expression was calculated by the 2-delta delta method [Citation25]. All samples were run in duplicate.
Immunoassays
All hormone concentrations were measured by enzyme-linked immunosorbent assays using commercially available kits in accordance with the manufacturers’ instructions. Ghrelin was measured with the EZGRT-89K human ghrelin (total) ELISA kit (Merck Millipore, Darmstadt, Germany). The range of the standard curve was 181.25–5800 pg/mL. No dilution factor was used. Leptin, adiponectin, and C-peptide were measured by Quantikine ELISA Kits (R&D System, Minneapolis, MN). The range of the standard curve of the leptin assay was 15.6–1000 pg/mL, that of the adiponectin assay was 3.9–250 ng/mL, and that of the C-peptide assay was 28.9–1850 pmol/L. The dilution factor for leptin was 1/100, for adiponectin 1/400, and for C-peptide ½. The plates were read in a Multiskan Ascent reader (Thermo, Fisher Scientific, Göteborg, Sweden). All samples were run in duplicate.
Collection of postnatal growth data
The growth of all Swedish children is monitored at local Child Health Care Units. A copy of the growth chart of each child in this study was collected from the respective Child Health Care Unit for data on postnatal growth. The oldest children were 5 years of age (n = 18) at the time of the study. The weight, length, and height z-scores were calculated using Swedish reference populations [Citation26,Citation27].
Sample size and statistical analyses
For estimation of the sample size needed for this study, we reviewed previous publications on placental ghrelin expression. Significantly higher ghrelin expression was found in 20 subjects with GDM compared with 16 women with normal glucose tolerance [Citation6]. Therefore, we assumed that 32 cases and 32 controls would be sufficient for detecting a difference in ghrelin expression in severe maternal obesity.
Data are given as the mean ± SD, SEM, median and range, or proportions. Differences between groups (obese versus normal-weight) were assessed by the Wilcoxon signed-rank test, paired Student’s t-test, or Fisher’s exact test, where appropriate. Pearson’s correlation test was used to assess associations. ANOVA for repeated measurements was used for analyses of differences in postnatal growth between the groups. Variables lacking a normal distribution were log transformed in analyses requiring normal distribution. Statistical analyses were performed using the IBM SPSS software package (Statistics 22, STATA Inc., College Station, TX), and the level of statistical significance was set at p < .05.
Results
Clinical characteristics
Clinical characteristics of obese and normal-weight women and their newborns are summarized in . Two obese women reduced their weight during the pregnancy, six obese women gained 5–9 kg in weight during the pregnancy, which is in accordance with the recommendations for obese women [Citation23], and 24 obese women had excessive GWG (10 − 33 kg). However, the mean GWG did not differ between the groups.
Table 1. Clinical characteristics of obese and normal-weight women and their offspring.
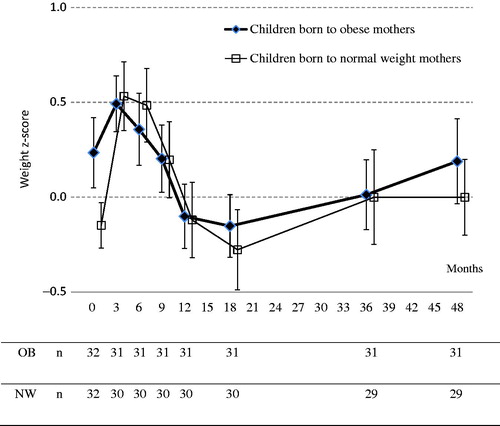
Weight z-scores from birth through 4 years of age are shown in . Infants born to obese mothers gained less weight in z-scores compared to infants born to normal-weight mothers during the first six postnatal months (0.116 ± 0.96 versus 0.643 ± 1.02, p = .042). However, no significant differences in postnatal weight z-scores were found between the groups at any age. Postnatal length or height gain did not differ between the groups (data not shown). A difference in head circumference between the groups was only found at birth.
Figure 1. Mean weight z-scores ± SEM from birth until 48 months of age in children born to obese (OB) and normal-weight (NW) mothers.
Placental ghrelin and leptin expression
Neither placental ghrelin nor leptin expression was significantly altered in the obese group. The median (range) fold changes (obese versus normal-weight group) were 1.0 (0.1–4.5) for ghrelin and 1.2 (0.0–139.9) for leptin. The expression of ghrelin in the placenta was low, with a mean Ct value of 29. The expression of leptin was higher, with a mean Ct value of 23.
Associations between placental ghrelin expression and maternal and infant variables
To investigate the possible physiological role of placental ghrelin, we analyzed associations between ghrelin mRNA values and maternal and infant parameters. We found a weak, positive association between placental ghrelin mRNA and GWG in all women, analyzing the whole group together (r = 0.267, p = .033), but analyzing the groups separately, we found that the association was lost in the normal-weight group (r = 0.016, p = .929), but tended to persist in the obese group (r = 0.334, p = .062). BMI in early pregnancy tended to be and BMI at delivery was associated with placental ghrelin expression in the obese group (r = 0.327, p = .067 and r = 0.424, p = .016, respectively), but not in the normal-weight group or in the whole group of women.
Placental ghrelin expression did not differ between male and female newborns and was not associated with birth weight or birth length. However, in infants born to normal-weight mothers, the placental ghrelin expression was inversely associated with weight z-scores at six (r = −0.642, p = .010), nine (r = −0.441, p = .015), and 12 months of age (r = −0.402, p = .028).
Cord blood ghrelin, adiponectin, leptin, and C-peptide Levels
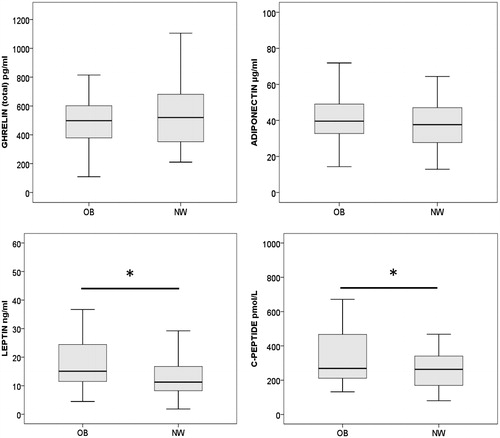
Cord blood concentrations of ghrelin, adiponectin, leptin, and C-peptide in infants born to obese versus normal-weight women are shown in . Neither ghrelin nor adiponectin levels were altered in the obese group, but both leptin and C-peptide values were increased (p = .016 and p = .027, respectively).
Figure 2. Box plots of ghrelin, adiponectin, leptin, and C-peptide concentrations in cord blood from children born to obese and normal-weight women. The boxes represent the interquartile range, the horizontal bars are the median, and whiskers are the range. *The leptin and the C-peptide concentrations were significantly higher in infants born to obese mothers (p = .016 and p = .027, respectively). OB: obese mother; NW: normal-weight mother.
Associations between cord blood ghrelin and adiponectin levels and other variables
Cord blood ghrelin concentrations did not correlate with placental ghrelin expression, with birth weight or with birth length. However, infants with birth weight z-scores ≤−0.67 had higher cord blood ghrelin levels than heavier infants (p = .042).
Eighteen children (10 with an obese mother and eight with a normal-weight mother) reduced their weight z-scores during their first 3 postnatal months. Their cord blood ghrelin levels were lower (419.3 pg/mL ±173.9 versus 556.3 pg/mL ±223.8, p = .026) and their birth weight z-scores were higher (0.60 ± 1.0 versus −0.19 ± 0.78, p = .002) than those of the other children. Cord blood ghrelin levels did not correlate with cord blood leptin, adiponectin, or C-peptide levels. Cord blood adiponectin levels did not correlate with C-peptide levels.
Discussion
To the best of our knowledge, we show for the first time in the present study that neither placental ghrelin expression nor cord blood ghrelin or cord blood adiponectin levels are altered in severe maternal obesity. However, we cannot exclude the possibility that a larger sample size would have yielded different results. A smaller sample size than the one used in this study was large enough to detect a significant difference in placental ghrelin expression in women with GDM [Citation6], indicating that maternal hyperglycemia may affect placental ghrelin expression more than maternal obesity seems to do. Furthermore, the sample size in this study is large enough to detect differences in birth weight and cord blood leptin and C-peptide levels in infants born to obese mothers, in accordance with findings in previous studies [Citation9,Citation28]. By confirming previous results, our study cohort is validated.
The result concerning placental leptin expression in this study also confirms our previous result in obese women [Citation8], which shows that a change of reference genes does not affect this finding.
We find that associations between placental ghrelin expression and early and late BMI and GWG exist, or tend to exist, in the obese women, but not at all in the normal-weight women. This difference needs further attention. Both early BMI and GWG influence BMI at delivery. Whether early BMI or GWG has greater impact on the association found between BMI at delivery and placental ghrelin in obesity also needs further investigations.
In contrast, the associations between placental ghrelin expression and infants’ postnatal weight z-scores are only found in the normal-weight women. If placenta-derived ghrelin influences the infant’s postnatal growth, that influence seems to be lost in severe maternal obesity. However, this needs to be investigated further in future studies.
The lack of changes in cord blood ghrelin and adiponectin levels in infants born to severely obese women indicates that those parts of fetal development and growth that are dependent on fetal ghrelin and adiponectin may not be markedly negatively affected by maternal obesity. The finding of decreased cord blood ghrelin levels in infants born to mothers with GDM [Citation14] together with our finding indicates that maternal hyperglycemia or hyperinsulinemia may affect fetal ghrelin levels more than maternal obesity seems to do.
The lack of correlation between cord blood ghrelin and birth weight in the present study is in agreement with the results of several previous studies [Citation15,Citation16] but in opposition to other results [Citation12–14]. However, we did find that infants with the lowest birth weight z-scores had higher ghrelin levels than infants with higher birth weight z-scores, indicating that fetal ghrelin may signal a lack of adequate energy supply, which is similar to findings in studies of adults [Citation29].
Our finding of lower cord blood ghrelin values in infants with decreasing early postnatal weight z-scores are in accordance with findings of others [Citation15,Citation17]. However, these infants also had higher birth weights than the other infants. Thus, a direct effect of cord blood ghrelin levels independent of birth weight on postnatal weight gain cannot be postulated from the findings in this study.
The lack of correlation between placental ghrelin expression and cord blood ghrelin levels indicates that placental and fetal ghrelin production do not seem to profoundly influence each other. Ghrelin found in the cord blood is probably mainly produced by the fetus, as previously proposed [Citation12].
The lack of correlation between cord blood ghrelin and cord blood leptin, adiponectin, and C-peptide levels indicates that fetal ghrelin production may be regulated differently than in childhood, where circulating ghrelin levels have been shown to be associated with leptin, adiponectin, and insulin both before and during puberty [Citation18].
A deviation in weight z-scores between the obese and normal-weight groups in our study seems to start at the age of 3 years (see ). However, the difference at the age of 4 years did not reach statistical significance, probably due to the small sample size and large interindividual variation.
A significant limitation of the present study is the lack of measurements of concentrations of the hormones in the pregnant women’s circulation. This lack makes it impossible to investigate associations between maternal levels and placental and fetal levels. Another limitation is the small sample size.
We conclude that placental ghrelin and leptin expression as well as cord blood ghrelin and adiponectin levels do not seem to be altered in severe maternal obesity. We confirm previous results that have shown increased birth weight as well as cord blood leptin and C-peptide levels with maternal obesity. Placenta-derived ghrelin seems to be associated with BMI at delivery only in obese, and not in normal-weight, women, and with infants’ postnatal weight only in normal-weight women. These associations as well as the divergent results between obese and normal-weight women need further investigations.
Acknowledgements
The authors thank Anders Magnuson at the Epidemiological and Statistical Department at Örebro University Hospital for statistical advice and Elisabet Tina and Lena Jansson at the Clinical Research Laboratory at Örebro University Hospital for their long-term support. This work received grants from the Research Committee of Region Örebro County and from Nyckelfonden, Örebro University Hospital.
Disclosure statement
The authors report no conflicts of interest.
Additional information
Funding
References
- Klok MD, Jakobsdottir S, Drent ML. The role of leptin and ghrelin in the regulation of food intake and body weight in humans: a review. Obes Rev. 2007;8(1):21–34.
- Nigro E, Scudiero O, Monaco ML, et al. New insight into adiponectin role in obesity and obesity-related diseases. BioMed Res Int. 2014;2014:658913.
- Flegal KM, Carroll MD, Kit BK, et al. Prevalence of obesity and trends in the distribution of body mass index among US adults, 1999–2010. JAMA. 2012;307(5):491–497.
- Howell KR, Powell TL. Effects of maternal obesity on placental function and fetal development. Reproduction. 2017;153(3):R97–R108.
- Haghiac M, Basu S, Presley L, et al. Patterns of adiponectin expression in term pregnancy: impact of obesity. J Clin Endocrinol Metab. 2014;99(9):3427–3434.
- Telejko B, Kuzmicki M, Zonenberg A, et al. Ghrelin in gestational diabetes: serum level and mRNA expression in fat and placental tissue. Exp Clin Endocrinol Diabetes. 2010;118(2):87–92.
- Radaelli T, Varastehpour A, Catalano P, et al. Gestational diabetes induces placental genes for chronic stress and inflammatory pathways. Diabetes. 2003;52(12):2951–2958.
- Allbrand M, Bjorkqvist M, Nilsson K, et al. Placental gene expression of inflammatory markers and growth factors – a case control study of obese and normal weight women. J Perinat Med. 2015;43(2):159–164
- Tsai PJ, Davis J, Bryant-Greenwood G. Systemic and placental leptin and its receptors in pregnancies associated with obesity. Reprod Sci. 2015;22(2):189–197.
- Drewlo S, Levytska K, Kingdom J. Revisiting the housekeeping genes of human placental development and insufficiency syndromes. Placenta. 2012;33(11):952–954.
- Aye IL, Powell TL, Jansson T. Review: adiponectin – the missing link between maternal adiposity, placental transport and fetal growth? Placenta. 2013;34(Suppl):S40–S45.
- Cortelazzi D, Cappiello V, Morpurgo PS, et al. Circulating levels of ghrelin in human fetuses. Eur J Endocrinol. 2003;149(2):111–116.
- Soriano-Guillén L, Barrios V, Chowen JA, et al. Ghrelin levels from fetal life through early adulthood: relationship with endocrine and metabolic and anthropometric measures. J Pediatr. 2004;144(1):30–35.
- Wu H, Sui C, Xia F, et al. Effects of exenatide therapy on insulin resistance in the skeletal muscles of high-fat diet and low-dose streptozotocin-induced diabetic rats. Endocr Res. 2016;41(1):1–7.
- James RJ, Drewett RF, Cheetham TD. Low cord ghrelin levels in term infants are associated with slow weight gain over the first 3 months of life. J Clin Endocrinol Metab. 2004;89(8):3847–3850.
- Bellone S, Rapa A, Vivenza D, et al. Circulating ghrelin levels in the newborn are positively associated with gestational age. Clin Endocrinol (Oxf). 2004;60(5):613–617.
- Gohlke BC, Huber A, Hecher K, et al. Fetal insulin-like growth factor (IGF)-I, IGF-II, and ghrelin in association with birth weight and postnatal growth in monozygotic twins with discordant growth. J Clin Endocrinol Metab. 2005;90(4):2270–2274.
- Bellone S, Prodam F, Savastio S, et al. Acylated and unacylated ghrelin levels in normal weight and obese children: influence of puberty and relationship with insulin, leptin and adiponectin levels. J Endocrinol Invest. 2012;35(2):191–197.
- Mantzoros CS, Rifas-Shiman SL, Williams CJ, et al. Cord blood leptin and adiponectin as predictors of adiposity in children at 3 years of age: a prospective cohort study. Pediatrics. 2009;123(2):682–689.
- Basu S, Laffineuse L, Presley L, et al. In utero gender dimorphism of adiponectin reflects insulin sensitivity and adiposity of the fetus. Obesity (Silver Spring). 2009;17(6):1144–1149.
- Pinar H, Basu S, Hotmire K, et al. High molecular mass multimer complexes and vascular expression contribute to high adiponectin in the fetus. J Clin Endocrinol Metab. 2008;93(7):2885–2890.
- Hermansson H, Hoppu U, Isolauri E. Elective caesarean section is associated with low adiponectin levels in cord blood. Neonatology. 2014;105(3):172–174.
- Rasmussen KM, Catalano PM, Yaktine AL. New guidelines for weight gain during pregnancy: what obstetrician/gynecologists should know. Curr Opin Obstet Gynecol. 2009;21(6):521–526.
- Andersen CL, Jensen JL, Ørntoft TF. Normalization of real-time quantitative reverse transcription-PCR data: a model-based variance estimation approach to identify genes suited for normalization, applied to bladder and colon cancer data sets. Cancer Res. 2004;64(15):5245–5250.
- Livak KJ, Schmittgen TD. Analysis of relative gene expression data using real-time quantitative PCR and the 2(-Delta Delta C(t)) Method. Methods. 2001;25(4):402–408.
- Niklasson A, Albertsson-Wikland K. Continuous growth reference from 24th week of gestation to 24 months by gender. BMC Pediatr. 2008;8:8.
- Wikland KA, Luo ZC, Niklasson A, et al. Swedish population-based longitudinal reference values from birth to 18 years of age for height, weight and head circumference. Acta Paediatr. 2002;91(7):739–754.
- Catalano PM, McIntyre HD, Cruickshank JK, et al. The hyperglycemia and adverse pregnancy outcome study: associations of GDM and obesity with pregnancy outcomes. Diabetes Care. 2012;35(4):780–786.
- Solomou S, Korbonits M. The role of ghrelin in weight-regulation disorders: implications in clinical practice. Hormones (Athens). 2014;13(4):458–475.