
Abstract
Background
The rates of SMM have been steadily increasing in Arkansas, a southern rural state, which has the 5th highest maternal death rate among the US states. The aims of the study were to test the functionality of the Bateman index in association to SMM, in clustering the risks of pregnancies to SMM, and to study the predictability of SMM using the Bateman index.
Study design
From the ANGELS database, 72,183 pregnancies covered by Medicaid in Arkansas between 2013 and 2016 were included in this study. The expanded CDC ICD-9/ICD-10 criteria were used to identify SMM. The Bateman comorbidity index was applied in quantifying the comorbidity burden for a pregnancy. Multivariable logistic regressions, KMeans method, and five widely used predictive models were applied respectively for each of the study aims.
Results
SMM prevalence remained persistently high among Arkansas women covered by Medicaid (195 per 10,000 deliveries) during the study period. Using the Bateman comorbidity index score, the study population was divided into four groups, with a monotonically increasing odds of SMM from a lower score group to a higher score group. The association between the index score and the occurrence of SMM is confirmed with statistical significance: relative to Bateman score falling in 0–1, adjusted Odds Ratios and 95% CIs are: 2.1 (1.78, 2.46) for score in 2–5; 5.08 (3.81, 6.79) for score in 6–9; and 8.53 (4.57, 15.92) for score ≥10. Noticeably, more than one-third of SMM cases were detected from the studied pregnancies that did not have any of the comorbid conditions identified. In the prediction analyses, we observed minimal predictability of SMM using the comorbidity index: the calculated c-statistics ranged between 62% and 67%; the Precision-Recall AUC values are <7% for internal validation and <9% for external validation procedures.
Conclusions
The comorbidity index can be used in quantifying the risk of SMM and can help cluster the study population into risk tiers of SMM, especially in rural states where there are disproportionately higher rates of SMM; however, the predictive value of the comorbidity index for SMM is inappreciable.
Introduction
Severe maternal morbidity (SMM) is defined as an unexpected outcome of labor and delivery that results in significant short- or long-term consequences to a woman’s health [Citation1]. SMM is a direct risk factor for maternal death and refers to a life-threatening diagnosis or the need to undergo a potentially lifesaving procedure in close proximity to birth [Citation2]. Besides its effects on maternal and infant health, SMM also results in longer hospital stays and increased medical costs [Citation3]. It is concerning that the SMM rate continues to increase in the United States. Compared to the 1998–1999 time period, Callaghan et al. reported that the SMM rate increased by 75% for delivery and 114% for postpartum hospitalizations during the 2008–2009 time period [Citation3]. Similarly, the overall rate of SMM increased by almost 200% over a two-decade period, from 49.5/10,000 deliveries in 1993 to 144.0/10,000 deliveries in 2014, affecting more than 50,000 women in the United States in 2014 [Citation4]. This growing trend in SMM is predicted to continue due to many maternal risk factors that continue to increase, such as average maternal age, pre-pregnancy obesity, preexisting chronic medical conditions, and cesarean delivery [Citation5–9].
The Centers for Disease Control and Prevention (CDC) lists 21 indicators that include the International Classification of Diseases (ICD) codes of diagnoses and procedures to identify delivery hospitalizations with SMM [Citation10]. A scoping review by Korst et al. found that the patient-level risk factors for SMM can be broadly categorized as patient demographics, preexisting clinical conditions, obstetrical conditions, and intrapartum and postpartum conditions [Citation11]. Preexisting chronic medical conditions such as chronic heart disease and chronic renal disease have been found to increase the risk for the development of SMM [Citation12]. Some other preexisting conditions (e.g. malignancy) and obstetric complications (e.g. placenta previa) have been shown to be significantly associated with delivery-related near-miss morbidity/death [Citation13]. Additionally, pregnancy and delivery history related variables (nulliparity and a prior cesarean delivery) were found to have an impact on the likelihood of developing SMM [Citation14,Citation15]. A relationship appeared to exist between the number of co-morbidities identified and the severity of the maternal morbidity as women with no morbidities having a rate of 48.5 per 10,000, one comorbidity having 238.6 per 10,000, two comorbidities having 379.9 per 10,000 and three comorbidities having 560 per 10,000 [Citation16]. Bateman and colleagues developed a maternal comorbidity index to quantify the risk level of a pregnancy for SMM using a national sample of Medicaid covered birth hospitalizations for years 2000–2007. They applied a logistic regression having the stepwise selection algorithm and identified 21 medical or obstetric conditions that were significantly associated with the SMM outcome, along with maternal age categories. Based on the coefficient values estimated from the final model, each of the predictors is assigned a weight; the Bateman index is a weighted sum of the burden of the identified medical (chronic and behavioural) and obstetric (pregnancy-induced) conditions [Citation17]. Efforts to refine scoring systems and models continues with a recent study using over 900,000 births from California between 2016 and 2017. This study developed a new obstetric comorbidity index for SMM (referred to as Leonard index hereinafter), which can be applied to a range of patient discharge datasets [Citation18]. However, due to the more frequent applications of Bateman index in literature, and considering our study population is Medicaid covered pregnant women, we used Batmen index to score the maternal comorbidity.
SMM has been reported to disproportionately affect women from racial/ethnic minority groups and from rural areas [Citation16,Citation19–22]. Racial and ethnic disparities between non-Hispanic white women and all other racial and ethnic minorities, between women with perinatal mood and anxiety disorders and those without, have been linked to SMM [Citation20,Citation22]. Arkansas was ranked as having the fifth highest maternal death rate among the states in America’s Health Rankings’ Health of Women and Children Report 2019 [Citation23]. Arkansas is a rural state with 37% population living in rural areas compared to the national average of 14% [Citation24]. The estimated poverty rate in Arkansas is 16.8% which is the sixth highest in the nation (2019 data). Using the Arkansas ANGELS dataset, we focused on Medicaid-covered pregnancies in 2013–2016. Medicaid programs help pay for necessary medical services for eligible individuals based on income levels and adjusted for family size. In Arkansas, the Medicaid program covers adults with income at or below 138% of the federal poverty level (FPL), for children in households the income eligibility is up to 147% of FPL, and for pregnant women the income eligibility is up to 214% of FPL. Using the poverty guidelines for year 2015 and adjusting for a family size of 3, these income thresholds translate into households with annual incomes of $27,724, $29,532 and $42,993 to qualify for Medicaid coverage for adults, children and pregnant women respectively. For each of the years from 2013 to 2016, approximately 65%, 66.5%, 49% and 59.5% of all births in Arkansas were covered by Medicaid [Citation25–28].
The purpose of this study was threefold. First, we wanted to see whether the association between maternal comorbidity index and SMM, which has been confirmed in other populations, also holds for Medicaid-covered pregnant women in Arkansas. Secondly, we set the goal of examining the functionality of the Bateman index in clustering the risks of pregnancies for SMM. This data-driven clustering approach would find the risk tiers based on particular pattern of the distribution of maternal comorbidity in a study population. Finally, we were also interested in building predictive models that aimed to utilize the comorbidity index to identify pregnancies that likely develop SMM.
Materials and methods
ANGELS database
The High-Risk Pregnancy Program (HRPP) is a statewide telemedicine program initiated by the University of Arkansas for Medical Sciences (UAMS) and the Arkansas Department of Human Services (ADHS) that provides remote pregnancy-related services. As part of the HRRP, the ANGELS database was developed that includes data from the ADHS, the Arkansas Department of Health (ADH) and UAMS. The ADHS identifies women with evidence of pregnancy that are enrolled in the state Medicaid program and shares a copy of their Medicaid claims data to be saved in the ANGELS database. The claims data allow the assessment of delivery dates, procedures performed, and diagnoses recorded during the beneficiary’s health care encounters. Deliveries identified through the maternal Medicaid claims data from the ADHS are subsequently linked to vital statistics records (birth/death certificate data) from the ADH to enrich the data with demographic information that are otherwise not available in the claims data. However, a perfect link for all records across the two data sources is not seen [Citation29]. The missing information on a few key demographic variables in this study (i.e. race/ethnicity, education, or marital status, see ) were essentially due to the deliveries on the claims dataset not linked to the vital statistic records where those variables were sourced.
Table 1. Distribution of maternal demographic characteristics of Medicaid covered pregnancies overall and by SMM status in Arkansas, 2013–2016, and marginal SMM rate for each category of the variables.
For this study, all deliveries from the Medicaid claims data within 2013–2016 were obtained. Women with Medicaid coverage that never utilized health care services were not part of the sample. We then applied the exclusion criterion not to use the records of women younger than 10 or greater than 55 years old at the time of delivery. ICD-CM diagnosis codes and CPT procedure codes for delivery services are listed in Supplementary Table 1. The delivery date was used as the index date for each pregnancy to set the timeframe for identifying SMM and maternal comorbid conditions. Only de-identified data were used in the analyses. This study was determined to be exempt from human subject research by the University of Arkansas for Medical Sciences (UAMS) Institutional Review Board.
SMM case identification
The CDC provides ICD-9/ICD-10 diagnosis and procedure codes to define the indicators of SMM during delivery hospitalization [Citation10]. We defined SMM for this study as a delivery with at least one SMM indicator present in the claims data on the delivery index date or within 42 days following the index date. The SMM outcome was coded as a binary variable (Yes or No). Although in below modeling approaches we did not further divide SMM into different types, we produced descriptive statistics for SMM with blood transfusion only vs. with nontransfusion, and SMM at delivery vs. SMM post delivery. The SMM excluding blood transfusion-only cases are called nontransfusion SMM hereafter.
Comorbidity index
The medical and obstetric conditions included in the Bateman maternal comorbidity index were originally identified using the ICD-9 codes [Citation17], and were converted to the ICD-10 codes in a validation study of the comorbidity index [Citation30]. Supplementary Table 2 lists the ICD-9 and ICD-10 diagnosis codes that were used to compute the index score. To maximize the accuracy of the pregnancy-related health history, we looked at the Medicaid claims for each pregnancy starting chronologically from the earliest claim but remained within 300 days of the index delivery date. If the diagnosis code(s) of an included comorbidity was recorded in the claims within the lookback period, the associated pregnancy was identified having that comorbid condition.
Demographics and other considerations
The maternal demographic variables evaluated were maternal race/ethnicity, level of education, marital status, residential area characteristics, and multiparity. If a woman had ≥2 deliveries in previous pregnancies of ≥28 weeks of gestation, she was determined with a multiparity. These variables can lead to disparities in the SMM rate and might need to be adjusted for a SMM study [Citation11]. Of note, maternal age was treated as a demographic variable in general, but as a risk factor when computing a Bateman score.
For the residential area characteristics, we first mapped our data to the Rural-Urban Continuum Codes (RUCC) developed by U.S. Department of Agriculture [Citation31] that are available at the county level as a nine-category classification scheme with three metropolitan (values 1–3) and six non-metropolitan categories (values 4–9). The Area Health Resources File (AHRF) 2020–2021 version from the Health Resources and Services Administration provided the information about the percentage of families lower than the federal poverty level in a county [Citation32]. The multiparity was identified by ICD-9 codes (V61.5, V23.3, 659.4) or ICD-10 codes (O09.4, Z64.1) from the claims data.
Statistical analyses
Demographic characteristics were presented as frequencies and percentages for the overall sample and stratified by the SMM outcome. Differences in the variables between the SMM and non-SMM groups were tested for statistical significance using Chi-square tests.
Bateman index score clustering
In the original study that developed the comorbidity index [Citation17], the scores were manually divided into seven categories: 0, 1–2, 3–4, 5–6, 7–8, 9–10, and >10. However, this simple partition may not reflect how the index scores clustered in their real distribution, which could be related to particular pattern of the maternal comorbidity of a study population. Unsupervised clustering approaches were examined to divide the Bateman index scores of the studied pregnancies into a number of groups, such that the index score values are similar within the same group and dissimilar to the scores from other groups. Among different clustering approaches the KMeans method was selected in this study (see details in Supplementary File). The KMeans algorithm assigns data points to the cluster with the nearest cluster mean (also called the cluster centroid), such that the sum of the squared distances between the data points and the centroid of the assigned cluster is minimized. Accordingly, the total within-cluster sum of squares was employed in determining the optimal number of clusters.
Association study
Multivariable logistic regressions served as the analytical approach for the association study. A backward variable selection was performed for a parsimonious model having independent variables. As a treatment of the rare event of the SMM outcome, a bias-reducing penalized likelihood optimization was applied for logistic regression fitting [Citation33]. SMM was either modeled using continuous Bateman index scores or using categorical clusters of the Bateman scores. The Odds Ratios (ORs) and 95% confidence intervals (CIs) were reported for the evaluation of the associations.
Prediction study
All the records for the years 2013 and 2014 were randomly split into 12 equally sized subsets. The first 11 subsets were combined as the training set on which a predictive model was fitted, and the remaining subset served as the test set that was used to estimate the prediction ability of the fitted model. This procedure is called the K-fold cross validation, and for this study, we had K = 12. Due to the extremely unbalanced distribution of the SMM outcome (about 2% event vs. 98% nonevent), instead of taking all the records in a training set, we did a random under-sampling of the nonevent records in a training set to fit a predictive model [Citation34–36]. The distribution of SMM in the training set was adjusted to approximately 50% of event records and 50% nonevent records. Five widely applied predictive approaches were employed to fit the resampled training dataset: Logistic regression, Decision Tree, K-Nearest Neighbors (KNN), Random Forest, and Support Vector Machine. The aforementioned procedure consists of internal validation steps, where each record in the dataset has the same probability of being included in either the training subset or the test subset. Additionally, we also fitted the models using the entire data for the years 2013 and 2014, and the predictive ability was quantified by using data for the years 2015 and 2016. This approach is referred to as the external validation, in which the training dataset is independent of the test dataset.
One primary interest was to study the performance of Bateman index in SMM prediction. The predictive models used Bateman score alone, or with other covariates adjusted including race/ethnicity, education, marital status, RUCC value, category of county with certain % families below FPL, multiparity, and gestational week.
A receiver operating characteristic (ROC) curve plots a true positive rate (TPR) versus a false positive rate (FPR) at different classification thresholds. ROC curve and the quantity of the area under curve (AUC), also called c-statistic, have been widely used in SMM research to evaluate the classification performance of a developed model. For classification of a rare event (e.g. SMM), however, the ROC approach is not recommended. The precision recall (PR) curve with its AUC was used to visually and quantitatively present the predictive ability of an approach [Citation37]. A section about appropriately conducting predictive analyses for SMM studies are provided in the Supplementary File.
Results
SMM prevalence and demographics of the studied pregnant women
Using the ANGELS database, a total of 72,184 pregnancies were identified during the 2013 to 2016 timeframe. After one pregnancy being excluded due to age at delivery >55 years old, there were 72,183 pregnancies included. The maternal age in our analytic dataset ranged from 13 to 48 years old. The overall SMM prevalence across the four years was 195 per 10,000 deliveries (95% CI: 185–206). Prevalence rates for each year were persistently higher than the national average, with 181 (95% CI: 163–200) in 2013, 180 (95% CI: 162–199) in 2014, 224 (95% CI: 202–248) in 2015, and 204 (95% CI: 183–228) in 2016, compared to the CDC estimated US SMM rate of 144 per 10,000 deliveries in 2014 [Citation4].
shows the distribution of demographic characteristics of our study sample, overall, and by SMM outcome status. The nontransfusion SMM cases accounted for 40.7% of the total cases, and more than 83% SMMs were seen at delivery. Barplots were drawn to display the estimated SMM per 10,000 deliveries for each of the studied variables stratified by SMM with blood transfusion and without (Supplementary Figure 1), by SMM at delivery and post delivery (Supplementary Figure 2). SMM with blood transfusion or SMM at delivery showed the similar distribution pattern of total SMM over the categories for each variable.
The maternal ages prevailed in the 20–34 years age range, accounting for nearly 80% of the deliveries. The majority of pregnant women that had available race/ethnicity information were Non-Hispanic Whites (57%), followed by Non-Hispanic Black (23.9%), Hispanic (15.6%), and other race/ethnicity groups (3.5%). The majority of our sample were from the RUCC metro counties (RUCC 1–3: 58.6%), had high school or lower than high school education (69%), and were unmarried (63.7%). Since the SMM rate uses deliveries as the unit of measurement, the maternal characteristics in are also presented for all the individual deliveries during the study timeframe. If a woman had multiple deliveries within the study timeframe, her demographic characteristics at the time of each delivery was taken. There were 63,332 unique women that delivered during the study timeframe from our dataset. Supplementary Table 3 shows the summary of the maternal demographic characteristics of total women as opposed to total deliveries. The observed univariable distributions remain similar.
shows, compared to the 25–29 age group, both younger and older groups had higher estimated risks for SMM. Among women with available race/ethnicity, the Non-Hispanic Black group had the highest SMM rate (255, 95% CI: 228–284). Among women with known marital status, unmarried women had higher SMM rates compared to married women (185, 95% CI: 171–200 vs. 147, 95% CI: 130–165). The RUCC categories 3 and 6 had significant higher SMM rates: 228, 95% CI: 199–259 and 227, 95% CI: 199–256 respectively. Counties that had lower % families below poverty level had lower rates of SMM rate; for the counties with <10% of families below poverty level, the estimated SMM rate was 134 with 95% CI: 111-161, and it monotonically increased to be 300, 95% CI: 221–397 for the counties having ≥25% families below poverty level.
Comorbidity index based risk clustering
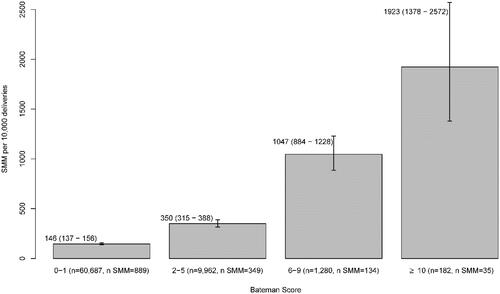
Among 72,183 pregnancies, there were 72,111 pregnancies for which the Bateman index scores were able to be calculated since 72 pregnancies had missing ages. The prevalence of each condition included in the Bateman index for ANGELS dataset is shown in Supplementary Table 2 (last column). The range of the Bateman score is observed 0–17 from our study cohort, with Mean (SD) equal to 0.75 (1.42). As the comorbidity score increased, the frequency and percentage of the score over the total available Bateman scores decreased gradually (Supplementary Figure 3). Compared to all the index scores being clustered together, the total within-cluster sum of squares was reduced by 85.2% when four clusters were selected (Supplementary Figure 4). The comorbidity index scores were accordingly divided into four groups: 0–1, 2–5, 6–9, and 10–17. The estimated SMM rates over the pregnancies falling into those ranges were consistently higher with increasing Bateman scores ().
Figure 1. SMM rate (95% CI) per 10,000 Medicaid covered pregnancies by the Bateman score cluster of ANGELS data 2013–2016, total N = 72,111.
Associations between SMM and maternal comorbidity index
reports the adjusted effects of the Bateman index score and the retained maternal characteristics on the risk of SMM from a multivariable logistic regression model after the backward selection procedure. Due to missingness on multiple variables, there were 52,147 observations used in the working model out of the total 72,183 records being read in. The Bateman index score was found to be significantly positively associated with SMM (p <.0001). Maternal race/ethnicity was also significantly associated with risk of SMM (p <.0001), with non-Hispanic Black women having the highest odds to experience SMM. RUCC category was significantly associated to SMM occurrence (p = .0031). Relative to RUCC value 1–2, women living in the counties with RUCC 3 or 6 had significantly higher chance for SMM (ORs and 95% CIs are: 1.34 (1.1, 1.64) for RUCC 3, and 1.39 (1.14, 1.68) for RUCC 6). Multiparity did not appear as a significant concern in both adjusted and unadjusted analyses, although the estimate is toward a lower chance of SMM when having multiparity (OR: 0.46). Younger gestational age is associated with increased risk for SMM: ORs and 95% CIs are 5.13 (3.7, 7.12) and 1.89 (1.56, 2.3) for <32 weeks and 32–<37 weeks respectively, as compared with gestational age of 37–41 weeks. When the Bateman index score was included as a continuous covariate in the working model, the estimated odds of SMM was 1.28 times for each unit increase in the Bateman score (p < .0001).
Table 2. Adjusted effects of the Bateman index score and maternal demographic characteristics on the risk of SMM among Medicaid covered pregnancies in Arkansas, 2013–2016.
Since approximately 26−28% of the deliveries had missing information on race/ethnicity, education, or marital status (see ), we used logistic regression modeling between SMM and the comorbidity index score only as an approach of sensitivity analysis (N = 72,111). The detailed modeling result for this additional analysis is provided in Supplementary Table 4. The association between the Bateman index score and the occurrence of SMM remained statistically significant (p < .0001), and the estimated odds ratios followed the same changing pattern over the score range as shown in .
Prediction of SMM by the maternal comorbidity index
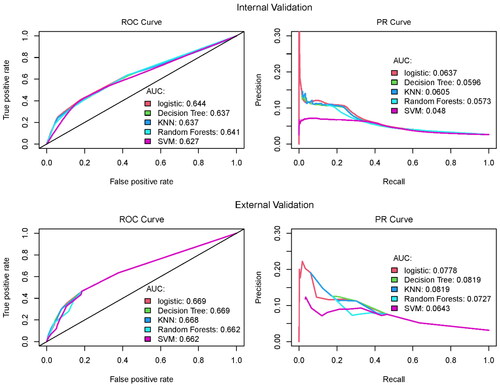
In order to compare our study results with existing literature, the ROC curves and AUC values from our analyses are presented in the left panels of (total N = 72,111). As shown, the obtained c-statistics are about 62 − 67%, similar to the findings in the study that published the Bateman index (AUC = 0.66) [Citation17] and another study applying Bateman index for pregnant women in Alberta, Canada (AUC = 0.58 − 0.7) [Citation30]. The precision recall (PR) curves and their AUC values are given in the right panel of , which are the measures we adopted in the evaluation of the predictive performance of the studied models. Precision is defined as the proportion of correctly identified cases out of all the predicted cases, which is also frequently referred to as positive predictive value (PPV) in medicine. For illustrative purpose, if there are 100 true cases within a sample, and an approach classifies only one of the true cases as a case and classifies the remaining true cases as non-cases, the precision is 100%, but the TPR (called recall here, also known as sensitivity) is only 1%. Thus, a precision needs to be quantified pertaining to a recall value, which is what a PR curve presents on the y- and x- axis, respectively. The PR curves in show that, for recall > 0.5, the precisions by different approaches are about 5% or lower. A 5% precision means that only 5% of SMM cases are able to be correctly identified using the comorbidity index satisfying a specific recall value. We included only the pregnancies with Bateman score >0 in plotting the PR curves. More specifically, the first row of figures in shows the predictive performance quantified on the test datasets over 100 random 12-fold cross validations using records from years 2013–2014 (N = 40,304). The second row of shows the prediction performance evaluated by the external validation steps, models fitted using records of years 2013–2014, and predictive ability quantified by the records of years 2015–2016 (N = 31,817). Both the analysis results suggest that the predictive ability of the comorbidity index for SMM outcome was minimal.
Figure 2. Predictive performance evaluations of the applied modeling approaches by both internal and external validation procedures using ANGELS data 2013–2016.
Discussions
Principal findings
The overall SMM rate has been steadily increasing not only in the US but also in rural states such as Arkansas. Maternal age, race/ethnicity, and residential area characteristics were found to be significantly associated with the presence of SMM in this study. The finding is consistent with known racial and ethnic disparities in the US [Citation12,Citation20]. Our study also showed that Non-Hispanic Black individuals had the highest rates of SMM no matter overall, being stratified between blood transfusion and nontransfusion, or between at delivery and post delivery (Supplementary Figures 1 and 2) [Citation16,Citation20,Citation22]. It has been more than a decade since SMM was reported as disproportionately affecting racial/ethnic marginalized women. More specific or enhanced programs at different levels are needed to mitigate this health gap.
In this study, we found that compared to RUCC categories 1 and 2 (i.e. counties in metro areas of 250,000 population or more), most of the other less urban areas had estimated ORs greater than 1 although for RUCC categories of 4 and 5 the effect was not statistically significant. It must be mentioned that defining which areas should be considered as rural is a fundamental challenge in literature [Citation38]. Various classification codes have been developed to recognize rural or urban areas with either two- or multi- categories, and “There was no one ‘best’ measure of rurality for predicting rural-urban disparities” [Citation39]. Kozhimannil et al. studied the severe maternal morbidity and mortality between rural and urban counties in the US 2007–2015 and found rural residents had a 9% greater probability of severe maternal morbidity and mortality compared with urban residents [Citation40]. The study used the definition from Office of Management and Budget to classify rural or urban counties [Citation41]. One speculation is that the effect of rurality on SMM might be lessened among an economically disadvantaged population, e.g. Medicaid insured people in our study compared to a general population. However, considering well-acknowledged health barriers for rural communities, such as transportation, and health literacy, estimated risks to SMM can inform and improve preparedness for the maternity care providers in rural regions either to reduce those risks or to provide better care for patients with SMM.
Secondary in part to an increase in the maternal age at the time of pregnancy, the overall health of pregnant women appears to be declining, with increased rates of pre-pregnancy obesity, preexisting chronic medical conditions and cesarean delivery, all of which contribute to an increasing SMM rate [Citation5–9]. Medical claims datasets have been used in other investigations to identify comorbidities during pregnancy and the occurrence of SMM [Citation17,Citation30,Citation42]. In our study, maternal comorbidities that comprise the Bateman index score were identified and the association between the index score and the presence of SMM were studied. What we found validates the use of the Bateman comorbidity index in Medicaid-covered pregnant women in Arkansas. Shown in , for the pregnancies where Bateman scores were calculated (N = 72,111) most pregnancies were scored 0–1 (N = 60,687, 84.2%). When the Bateman scores were higher, the proportion of pregnancies in that score range became smaller (13.8% for scores 2–5; 2% for scores ≥6). This is an expected index score distribution for the maternal comorbidity index at a population level. Both unadjusted () and adjusted results () show a very strong association between the index score and the likelihood of SMM, in which the subgroup with Bateman scores ≥6 had more than five times adjusted odds to experience SMM compared to the subgroup with a score of 0–1. In addition to Bateman index, we also identified that gestational age at delivery had a very strong association with SMM occurrence (p < .0001, see ).
One of the functionalities of the Bateman index score that has been left unstudied is its application in constructing risk tiers of SMM for a population of pregnant women. Since the strong positive association between the Bateman comorbidity index and SMM has been widely acknowledged [Citation30,Citation42–44], a higher index score implies greater odds of experiencing SMM. However, due to varied backgrounds, the distributions of comorbidities that comprise the Bateman index could differ in many ways across different populations. Our analysis suggests that Medicaid covered pregnant women in Arkansas 2013–2016 can be partitioned into four risk tiers. This could provide helpful reference information for clinical management of pregnancies in risk clustering for SMMs, when Bateman index scores can be obtained, especially in states similar to Arkansas that have significant rural population and socioeconomic disparity.
Our original goal also included building prediction models. An association study would help identify factors that bear statistically significant risk for SMM, while a predictive study could help identify pregnant women who are at risk developing SMM. From this study, however, we have concluded that comorbidities diagnosed during pregancy reflected by the Bateman index are unable to predict SMM. We observed that out of the 1409 recognized SMM cases, there were 42.1% (n = 592) cases with a Bateman score of 0. In other words, the comorbidity based approach missed more than a third of the cases even prior to applying any analytic techniques. Similar findings have been reported by other studies [Citation17,Citation30,Citation45], and especially discussed in a SMM study with Texas population in 2015 where 40% of the deliveries with SMM had a Bateman index score of zero. Analyses conducted by both excluding () and including (data not shown) the pregnancy records of the index score 0, the predictive values of the comorbid conditions during pregnancies did not provide promising signs. We have also attempted to include other covariates and demogrpahic variables as additional predictors in the models, or to condcut the predictive modeling for different subgroups (see an example given in Supplemenatry Figure 5). In addtion to Bateman index, a list of comorbid conditions summarized from published literatures had also been used as individual predictors to fit the predictive models (Supplementary Table 5). However no meaningful increase in the predicability has been observed in any of the trials. The similar predictive values were also reported in the paper for Leonard index development, where once a recall was >0.5, the precision values were all <0.1 for the three compared index measures there [Citation18].
A low risk pregnancy is usually defined as a pregnancy without complications and without maternal or fetal factors that woud make a pregnay at an increased risk for complications. A cross-sectional study of 10 million births between 2011 and 2013 revealed that almost 1/3 of women identified as low risk had an unexpected complication that occurred during labor, delivery or postpatum that necessistated a higher level of care for the patient and/or her neonate [Citation46]. Different studies including ours point out the same finding that there were a surprisingly large number of pregnancies, classified as low risk or with zero combordity index, which developed significant problems late in pregnancy, during labor, delivery or postpartum. The approaches using risks identified antepartum is limited in predicting the outcome. The implication is that expectant mothers, care providers and health systems should be aware of the notable likelihood of adverse outcomes even among the pregnancies deemed to be of low risk or zero comorbidity index score. Necessary plans might need to be considered in advance including an elevated care level such as a planned home birth to a hospital birth [Citation46]. On the other hand, women identified early in pregnancy with a comorbid condition could have had therapy for that condition early in the pregnancy and that could have altered the subsequent development of SMM which might also be one of the reasons for observed low predictability of SMM.
Limitation and future research
The ANGELS database was established to generate annual metrics for the Medicaid program with respect to high-risk pregnancy control. Due to this reason, information that would have further strengthened our findings were not readily available. For example, we could not ascertain the specific Medicaid program that beneficiaries were enrolled in, exclusively pregnancy-related Medicaid coverage or adult Medicaid coverage. Furthermore, the claims data in ANGELS database that were used for identifying SMM and the comorbidities are part of administrative claims data. They were primarily collected for Medicaid claims needs and provide limited information for research purpose. For example, by using claims data, we were not able to further analyze the severity levels for some comorbidity conditions.
It is worth mentioning that the transition from ICD-9 to ICD-10 code sets happened in year 2015. We cannot rule out the possibility that the observed jump of the SMM rate from 2014 to 2015 was contributed partially by the change of the coding system in identifying the SMM indicators [Citation47].
It is also our speculation that there might be medical conditions observed during pregnancy visits that are not reflected on the medical claims. We are motivated to explore the patient medical electronic health records database and the legacy systems to supplement information obtained from claims data only. The natural language processing technology and other statistical machine learning and deep learning approaches could be considered to extract and identify meaningful clinical notes. With added clinical data to the analytic models, we expect the predictability of SMM will be increased. This is one of the research avenues for SMM that we intend to explore.
Another limitation mentioned earlier is related to the missing data on a few key demographic variables, which reduced the analytical sample size notably and might account for some observed non-significant effects in statistics. The generalizability of our study results may be limited to Medicaid covered pregnancies for other US south central states that also encompass a large proportion of rural population, such as Alabama, Mississippi, and Louisiana. These states are usually ranked at the bottom in the nation for health and face the similar problems for women’s health, for example obesity and teen births [Citation23].
In this study we primarily looked at maternal comorbidity index and SMM. Using ANGELS data, future studies could also explore other important topics such as the spatial inequalities for SMM, the interaction effect between race/ethnicity, rurality and some other factors that define the sociodemographic status of pregnant women for SMM, and multimorbidity heterogeneous patterns bearing varied risks for SMM.
Supplemental Material
Download MS Word (883.6 KB)Disclosure statement
The authors report no conflict of interest. This study was conducted when NP was an Associate Professor at the University of Arkansas for Medical Sciences. Currently, NP is employed by Eli Lilly and Company, Indianapolis, IN, USA.
Additional information
Funding
References
- Kilpatrick SK, Ecker JL, American College of Obstetricians and Gynecologists and the Society for Maternal–Fetal Medicine, et al. Severe maternal morbidity: screening and review. Am J Obstet Gynecol. 2016;215(3):B17–B22.
- Rivara FP, Fihn SD. Severe maternal morbidity and mortality: JAMA network open call for papers. JAMA Netw Open. 2020;3(1):e200045.
- Callaghan WM, Creanga AA, Kuklina EV. Severe maternal morbidity among delivery and postpartum hospitalizations in the United States. Obstet Gynecol. 2012;120(5):1029–1036.
- CDC. Severe maternal morbidity in the United States. [cited 2021 Apr 19]. Available from: https://www.cdc.gov/reproductivehealth/maternalinfanthealth/severematernalmorbidity.html
- Mathews TJ, Hamilton BE. Mean age of mothers is on the rise: United States, 2000–2014. NCHS Data Brief. 2016;(232):1–8.
- Flegal KM, Carroll MD, Ogden CL, et al. Prevalence and trends in obesity among US adults, 1999–2008. JAMA. 2010;303(3):235–241.
- Fisher S, Kim S, Sharma A, et al. Is obesity still increasing among pregnant women? Prepregnancy obesity trends in 20 states, 2003–2009. Prev Med. 2013;56(6):372–378.
- Small MJ, James AH, Kershaw T, et al. Near-miss maternal mortality: cardiac dysfunction as the principal cause of obstetric intensive care unit admissions. Obstet Gynecol. 2012;119(2 Pt 1):250–255.
- Campbell KH, Savitz D, Werner EF, et al. Maternal morbidity and risk of death at delivery hospitalization. Obstet Gynecol. 2013;122(3):627–633.
- CDC. Severe morbidity indicators and corresponding ICD-9-CM/ICD-10-CM/PCS codes during delivery hospitalizations. [cited 2021 Apr 19]. Available from: https://www.cdc.gov/reproductivehealth/maternalinfanthealth/smm/severe-morbidity-ICD.htm.
- Korst LM, Gregory KD, Nicholas LA, et al. A scoping review of severe maternal morbidity: describing risk factors and methodological approaches to inform population-based surveillance. Matern Health Neonatol and Perinatol. 2021;7(1):1–20.
- Creanga AA, Bateman BT, Kuklina EV, et al. Racial and ethnic disparities in severe maternal morbidity: a multistate analysis, 2008–2010. Am J Obstetr Gynecol. 2014;210(5):435.e1–435.e8.
- Mhyre JM, Bateman BT, Leffert LR. Influence of patient comorbidities on the risk of near-miss maternal morbidity or mortality. J Am Soc Anesthesiol. 2011;115(5):963–972.
- Malone FD, Kaufman GE, Chelmow D, et al. Maternal morbidity associated with triplet pregnancy. Am J Perinatol. 1998;15(1):73–77.
- Gray KE, Wallace ER, Nelson KR, et al. Population‐based study of risk factors for severe maternal morbidity. Paediatr Perinat Epidemiol. 2012;26(6):506–514.
- Brown CC, Adams CE, George KE, et al. Associations between comorbidities and severe maternal morbidity. Obstet Gynecol. 2020;136(5):892–901.
- Bateman BT, Mhyre JM, Hernandez-Diaz S, et al. Development of a comorbidity index for use in obstetric patients. Obstetr Gynecol. 2013;122(5):957–965.
- Leonard SA, Kennedy CJ, Carmichael SL, et al. An expanded obstetric comorbidity scoring system for predicting severe maternal morbidity. Obstet Gynecol. 2020;136(3):440–449.
- Howell EA, Egorova NN, Janevic T, et al. Severe maternal morbidity among Hispanic women in New York City: investigation of health disparities. Obstet Gynecol. 2017;129(2):285–294.
- Admon LK, Winkelman TN, Zivin K, et al. Racial and ethnic disparities in the incidence of severe maternal morbidity in the United States, 2012–2015. Obstet Gynecol. 2018;132(5):1158–1166.
- Lisonkova S, Haslam MD, Dahlgren L, et al. Maternal morbidity and perinatal outcomes among women in rural versus urban areas. CMAJ. 2016;188(17–18):E456–E465.
- Admon LK, Dalton VK, Kolenic GE, et al. Comparison of delivery-related, early and late postpartum severe maternal morbidity among individuals with commercial insurance in the US, 2016 to 2017. JAMA Netw Open. 2021;4(12):e2137716.
- America’s Health Rankings. Health of women and children report. 2019 [cited 2021 Apr 19]. Available from: https://www.americashealthrankings.org/learn/reports/2019-health-of-women-and-children-report.
- USDA. State data. [cited 2021 Apr 19]. Available from https://data.ers.usda.gov/reports.aspx?StateFIPS=05&StateName=Arkansas&ID=17854
- Arkansas Department of Human Services. Arkansas medicaid program overview SFY. 2013 [cited 2022 Dec 15]. Available from: https://humanservices.arkansas.gov/wp-content/uploads/Medicaid_Program_Overview_SFY2013.pdf
- Arkansas Department of Human Services. Arkansas medicaid program overview SFY. 2014 [cited 2022 Dec 15]. Available from: https://humanservices.arkansas.gov/wp-content/uploads/Medicaid_Program_Overview_SFY2014.pdf.
- Arkansas Department of Human Services. Arkansas medicaid program overview SFY. 2015 [cited 2022 Dec 15]. Available from: https://humanservices.arkansas.gov/wp-content/uploads/Medicaid_Program_Overview_SFY2015.pdf.
- Arkansas Department of Human Services. Arkansas medicaid program overview SFY. 2016 [cited 2022 Dec 15]. Available from: https://humanservices.arkansas.gov/wp-content/uploads/Medicaid_Program_Overview_SFY2016.pdf.
- Bronstein JM, Lomatsch CT, Fletcher D, et al. Issues and biases in matching medicaid pregnancy episodes to vital records data: the Arkansas experience. Matern Child Health J. 2009;13(2):250–259.
- Metcalfe A, Lix L, Johnson JA, et al. Validation of an obstetric comorbidity index in an external population. BJOG: int J Obstet Gy. 2015;122(13):1748–1755.
- USDA. United States Department of Agriculture Economic Research Service. Rural Urban Continuum Codes (RUCC). [cited 2022 Nov 9]. Available from: https://www.ers.usda.gov/data-products/rural-urban-continuum-codes/
- HRSA. Health Resources and Services Administration. Department of Health & Human Services. Area Helath Resources Files. [cited 2022 Nov 9]. Available from: https://data.hrsa.gov/topics/health-workforce/ahrf.
- Firth D. Bias reduction of maximum likelihood estimates. Biometrika. 1993;80(1):27–38.
- Drummond C, Holte RC, editors. C4. 5, class imbalance, and cost sensitivity: why under-sampling beats over-sampling. Workshop on learning from imbalanced datasets II. Washington (DC): Citeseer; 2003.
- Mani I, Zhang I, editors. kNN approach to unbalanced data distributions: a case study involving information extraction. Proceedings of workshop on learning from imbalanced datasets. Washington (DC): ICML United States; 2003.
- Wang H, editor. Logistic regression for massive data with rare events. Online: International Conference on Machine Learning; 2020. PMLR.
- Pinker E. Reporting accuracy of rare event classifiers. NPJ Digital Med. 2018;1(1):1–2.
- Bennett KJ, Borders TF, Holmes GM, et al. What is rural? Challenges and implications of definitions that inadequately encompass rural people and places. Health Aff (Millwood). 2019;38(12):1985–1992.
- Long JC, Delamater PL, Holmes GM. Which definition of rurality should I use?: The relative performance of 8 federal rural definitions in identifying rural-urban disparities. Med Care. 2021;59(Suppl 5):S413–S419.
- Kozhimannil KB, Interrante JD, Henning-Smith C, et al. Rural-urban differences in severe maternal morbidity and mortality in the US, 2007–15. Health Aff (Millwood). 2019;38(12):2077–2085.
- US Office of Management and Budget. 2013. Rural-urban continuum codes. [cited 2022 Dec 15]. Available from: https://www.ers.usda.gov/data-products/rural-urban-continuum-codes.aspx.
- Salahuddin M, Mandell DJ, Lakey DL, et al. Maternal comorbidity index and severe maternal morbidity during delivery hospitalizations in Texas, 2011–2014. Birth. 2020;47(1):89–97.
- Easter SR, Bateman BT, Sweeney VH, et al. A comorbidity-based screening tool to predict severe maternal morbidity at the time of delivery. Am J Obstetr Gynecol. 2019;221(3):271.e1–271.e10.
- Main EK, Leonard SA, Menard MK. Association of maternal comorbidity with severe maternal morbidity: a cohort study of California mothers delivering between 1997 and 2014. Ann Intern Med. 2020;173(11 Suppl):S11–S18.
- Hehir MP, Ananth CV, Wright JD, et al. Severe maternal morbidity and comorbid risk in hospitals performing< 1000 deliveries per year. Am J Obstetr Gynecol. 2017;216(2):179.e1–179.e12.
- Danilack VA, Nunes AP, Phipps MG. Unexpected complications of low-risk pregnancies in the United States. Am J Obstetr Gynecol. 2015;212(6):809.e1–809.e6.
- Metcalfe A, Sheikh M, Hetherington E. Impact of the ICD-9-CM to ICD-10-CM transition on the incidence of severe maternal morbidity among delivery hospitalizations in the United States. Am J Obstetr Gynecol. 2021;225(4):422.e1–422.e11.