
Abstract
Background: Macrosomia is a common disorder that occurs during pregnancy. We investigated the comprehensive metabolite profiles of pregnant maternal and fetal sera in normoglycemic macrosomia in a Chinese population. Methods: Forty pregnant women and their fetuses were included in the study (twenty macrosomia patients and twenty normal-weight controls). Maternal and umbilical cord serum metabolites were identified using ultra-performance liquid chromatography coupled with tandem mass spectrometry. Results: In total, 203 metabolites were identified. Lipids and lipid-like molecules were the predominant metabolites. Fifty-three metabolites with significant differences were obtained in the maternal samples. In the macrosomia group, the levels of docosahexaenoic acid, eicosapentaenoic acid, and arachidonic acid were significantly higher than those in the control group. Umbilical cord serum samples were obtained for 24 different metabolites. The maternal-fetal gradient of polyunsaturated fatty acids was decreased in the macrosomia group. Aconitic acid, citric acid, isocitric acid, 2-methylhexanoic acid, and 12-hydroxystearic acid were the common differential metabolites in the maternal and umbilical cord serum samples. Conclusion: There were obvious metabolic abnormalities in the sera of pregnant women and fetuses with macrosomia. Lipids and lipid-like molecules were the predominant differential metabolites but had different classifications in the maternal and umbilical cord serum. These results may provide new insights into the long-term metabolic disorders associated with macrosomia.
Introduction
Macrosomia is defined as the infant’s birth weight (BW) ≥ 4000 g, regardless of gestational age (GA) [Citation1]. The incidence of macrosomia has increased worldwide in recent years. According to the National Center for Health Statistics, in 2018, approximately 7.8% of newborns in the United States weighed more than 4000 g [Citation2]. Several studies have reported that macrosomia increases the risk of perinatal complications. The delivery of a fetus with macrosomia is associated with emergency cesarean section, significant perineal trauma, and postpartum hemorrhage [Citation3,Citation4]. Infants are at an increased risk of shoulder dystocia, brachial plexus injury, facial nerve injuries, birth fractures of the humerus or clavicle, and birth asphyxia [Citation4,Citation5]. Macrosomia has also been linked to long-term health risks, including obesity, type 2 diabetes, and hypertension [Citation6,Citation7]. Thus, Dennedy et al. have identified macrosomia as a worldwide health problem [Citation8].
A growing body of evidence suggests that the causes of macrosomia include genetic and environmental factors, accompanied by a series of metabolic changes [Citation9]. Metabolomics is the study of the metabolites that change various metabolic pathways in organisms under the influence of genetic modifications or external stimuli. In recent years, the development of metabolomics technology has helped explore the intermediate biomarkers linking exposure and outcomes [Citation10]. Sun et al. [Citation11] used an untargeted metabolomics approach based on gas chromatography/mass spectrometry and found differences in the 2-methylfumarate, uracil, ribose, elaidic acid, lactulose, and 4-aminobutyric acid levels in umbilical cord blood between infants with macrosomia and normal BW. Using tandem mass spectroscopy, Wright et al. [Citation12] found that acetylcarnitine (C2), propionylcarnitine (C3), dicarboxylic acid, and long-chain acylcarnitine levels are significantly higher in patients with macrosomia than in those with normal BW. However, these results are not entirely consistent. This may be related to differences in the metabolomics methods, biological specimens, and population characteristics. Therefore, to further understand macrosomia, it is necessary to conduct additional metabolomics studies on macrosomia in the Chinese population.
In this study, we investigated the comprehensive metabolite profiles of pregnant maternal and fetal sera in normoglycemic macrosomia in a Chinese population using ultra-performance liquid chromatography coupled with tandem mass spectrometry (UPLC-MS/MS). We sought to identify the differently expressed metabolites and related metabolic pathways to provide new insights into macrosomia.
Methods
Ethics statement
This study was approved by the First Affiliated Hospital of Wenzhou Medical University (YS2020-257). Written informed consent was obtained from all patients before blood collection.
Definitions
Singleton infants with macrosomia were classified as macrosomia group, which was defined as BW ≥ 4000 g irrespective of GA [Citation1]. Singleton normal BW (control group) was defined as BW ≥ 2500 g and < 4000 g, and appropriate for GA (GA ≥ 37 weeks and < 42 weeks). GA was defined as the number of completed weeks of gestation, which was determined by the duration of menorrhea or confirmed by an early ultrasound scan during pregnancy [Citation13].
Study design and data collection
This case-control study recruited mothers and fetuses from the Obstetrics Department of the First Affiliated Hospital of Wenzhou Medical University in China from 2020 to 2021. The inclusion criteria were as follows: mothers of the Han race, natural conception, singleton pregnancy, maternal age 18–45 years, term baby (GA between 37 and 41+6 weeks) with normal appearance, and Apgar score > 7. The mothers lacked chronic diseases other than diabetes mellitus, overweight, and obesity (no hypertension, thyroid disease, immunological and inflammatory diseases, kidney and liver diseases, and thromboembolism). The use of typical multivitamin/microelement supplements for pregnant women (including folic acid; vitamins B, C, D, E, and A; and microelements such as iron, magnesium, calcium, selenium, copper, zinc, and manganese) was not among the criteria for exclusion/inclusion. However, mothers who consumed docosahexaenoic acid (DHA) preparations during pregnancy were excluded from this study.
The controls were matched (1:1) to cases with respect to age (±3 years), gestational diabetes mellitus (GDM) history, and cesarean section. Finally, 20 mothers with macrosomia and 20 with normal BW infants were included in the study. Maternal and neonatal data were collected from the medical records. Maternal data included age at delivery, gravidity, parity, pregnancy complications, and delivery mode (cesarean section). Neonatal data included GA, BW, sex, and Apgar scores.
Serum collection and Metabolite extraction
We performed the metabonomics analysis by Q300 Kit (Metabo-Profile, Shanghai, China).
The samples were treated according to the following steps.
Umbilical cord blood samples were obtained immediately (within 5 min) after birth. Maternal blood samples were collected during the third trimester of pregnancy. Serum was obtained by performing centrifugation at 2500 g for 15 min at 4 °C and stored at −80 °C. For metabolites, the serum was thawed in an ice bath to reduce degradation, and 20 μL of the serum was pipetted into a 96-well plate and added ice-cold methanol with partial internal standards. Then the plate was vortex-mixed for 5 min and centrifuged at 4000 g for 30 min to pellet the protein precipitate. The resulting supernatant was transferred to a clean 96-well plate, and freshly prepared derivative reagents were added [Citation14]. The plate was sealed, and derivatization was carried out at 30 °C for 60 min. Following derivatization, the samples were diluted in an ice-cold 50% methanol solution. After storage at −20 °C for 20 min, the plate was centrifuged at 4000 g for 30 min. The supernatant was transferred to a new 96-well plate with internal standards, and serial dilutions of derivatized stock standards were added to the left wells [Citation14]. The plate was then sealed for analysis. Quality control (QC) samples mixed with aliquots of the samples were prepared similarly. All of the 300 standards of metabolites were obtained from Sigma-Aldrich (St. Louis, MO, USA), Steraloids Inc. (Newport, RI, USA) and TRC Chemicals (Toronto, ON, Canada). The standards were accurately weighed and prepared in water, methanol, sodium hydroxide solution, or hydrochloric acid solution to obtain individual stock solutions at a concentration of 5.0 mg/mL. The appropriate amount of each stock solution was mixed to create stock calibration solutions [Citation14].
UPLC-MS/MS analysis
The UPLC-MS/MS analyses were performed using an ACQUITY UPLC-Xevo TQ-S instrument (Waters Corp., Milford, MA, USA). The separation was performed on ACQUITY UPLC BEH C18 1.7 µM VanGuard pre-column (2.1 mm × 5 mm) (Waters Corp., Milford, MA, USA) and ACQUITY UPLC BEH C18 1.7 µM analytical column (2.1 mm × 100 mm) (Waters Corp., Milford, MA, USA) at the flow rate of 0.40 ml/min [Citation14]. The mobile phases used were water with 0.1% formic acid as solvent A and acetonitrile/IPA (70:30) as solvent B. The elution gradient started from 5% solvent B maintained for 1 min, increased to 100% in 15 min, decreased to 5% in 6 s, and kept constant until the 18th minute. As for the mass spectrometer, the sourceand desolvation temperature and capillary were set as 150 °C, 550 °C, and 1.5 (ESI+), 2.0 (ESI-)Kv, respectively. All samples were determined in a random order. In every ten samples analyzed, QC samples were used to reduce errors.
Data processing and analysis
The raw data acquired from UPLC-MS/MS analyses were processed by Masslynx V4.1 (Waters Corp., Milford, MA, USA) to perform chromatographic peak identification, grouping, calibration, and quantitation. SIMCA-P 14.1.0 (Umetrics, Malmo, SWE) was used for statistical analyses, including the principal component analysis (PCA), orthogonal partial least square discriminant analysis (OPLS-DA), and univariate analysis. The OPLS-DA model was evaluated by R2 (goodness of fit) and Q2 (predictive goodness). The variable importance in projection (VIP) was obtained from the OPLS-DA model. For the univariate analysis, according to the normality and variance homogeneity of the data, the Student’s t-test or Mann-Whitney U-test was performed. Combining the results of univariate and multivariate analyses, metabolites with VIP > 1, p < 0.05, and |log2FC| > 0 (fold change, FC) were considered significant differential metabolites. The Benjamini-Hochberg (BH) method was performed to control the false discovery rate (FDR), and q < 0.25 was used as a significant level for the multiple comparison correction.
Pathway analysis
The identification of metabolites and pathway analysis was performed based on the Kyoto Encyclopedia of Genes and Genomes (KEGG) database (http://www.genome.jp/kegg/pathway.html) [Citation11].
Clinical data analysis
Statistical analysis of the clinical data was performed using SPSS (version 22.0; SPSS, Chicago, IL, USA). Differences in the qualitative demographic features and frequencies among categorical data were evaluated using the χ2 test. For other parameters, differences in means were evaluated using the Student’s t-test. All statistical tests were two-tailed, and p < 0.05 was considered significant.
Results
Demographic and clinical characteristics
There were no significant differences in the maternal age, height, weight, body mass index (BMI), gravidity, parity, history of GDM, and cesarean section between mothers with macrosomia and controls. However, pregnancy weight gain and gestational age were significantly higher in the macrosomia group than in the control group (both p < 0.0001). In terms of biochemical markers before delivery, albumin and hemoglobin levels were not significantly different between the macrosomia and control groups. Detailed information regarding the demographic and clinical characteristics is shown in .
Table 1. Baseline characteristics and clinical information in the macrosomia and control groups.
Multivariate data analysis
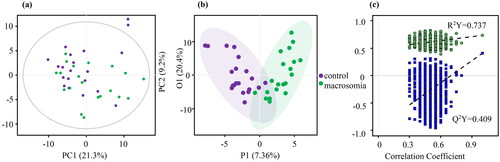
Using UPLC-MS/MS, 203 annotated metabolites were identified. shows the classification of these metabolites. Lipids and lipid-like molecules are the major types, accounting for 43%. The PCA plot of the data indicated that there was a separation trend between the macrosomia and control groups in both umbilical cord serum samples and maternal serum samples ( and ). Furthermore, the OPLS-DA plot of the data clearly distinguished the macrosomia group from the controls ( and ). The OPLS-DA model of maternal serum samples showed that the intragroup difference threshold of metabolites in the macrosomia and control groups was 20.3%, which was mainly caused by individual differences, and the significant threshold value of the difference in metabolites was 10.2%. The model quality parameters were R2Y = 0.75 and Q2Y = 0.402 (). This indicates that the model has a good fit and prediction. For umbilical cord serum samples, the intragroup difference threshold caused by individual differences was 20.4%, and the significant threshold value was 7.36% in the OPLS-DA model. The model quality parameters were R2Y = 0.737 and Q2Y = 0.409 ().
Figure 1. The classification and percentage of metabolites.
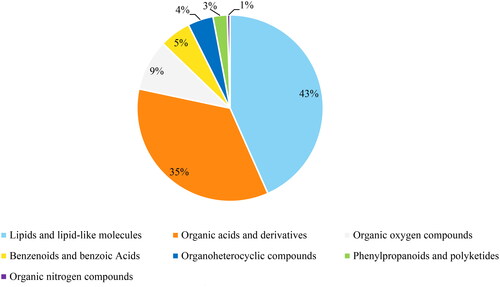
Figure 2. Metabolite profile of the macrosomia group vs. the control group about maternal serum samples. (a) Results of PCA analysis. (b) Results of OPLS-DA model. (c)Permutation test of OPLS-DA model.
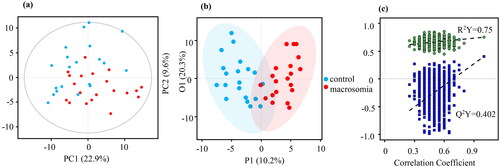
Figure 3. Metabolite profile of the macrosomia group vs. the control group about umbilical cord serum samples. (a) Results of PCA analysis. (b) Results of OPLS-DA model. (c) Permutation test of OPLS-DA model.
Identification of differential metabolites and analysis
Using p < 0.05 and |log2FC| >0 as the threshold of univariate analysis, 63 differential metabolites in the maternal serum samples between groups were identified, of which 53 increased and 9 decreased (). Thirty-two differential metabolites were detected in the umbilical cord serum samples (). Among them, 29 increased, and 3 decreased. Based on the OPLS-DA model and threshold values with VIP value > 1 and p < 0.05, a volcanic diagram was created ( and ).
Figure 4. Differential metabolites in maternal serum samples. (a) Volcano plot based on univariate analysis. (b) Volcano plot of OPLS-DA model. (c) Classification of differential metabolites.
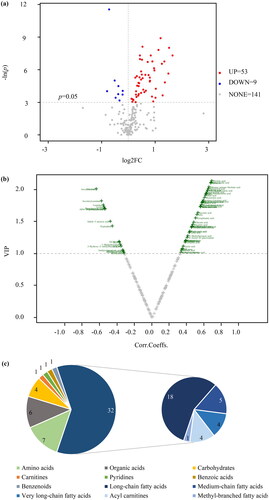
Figure 5. Differential metabolites in umbilical cord serum samples. (a) Volcano plot based on univariate analysis. (b) Volcano plot of OPLS-DA model. (c) Classification of differential metabolites.
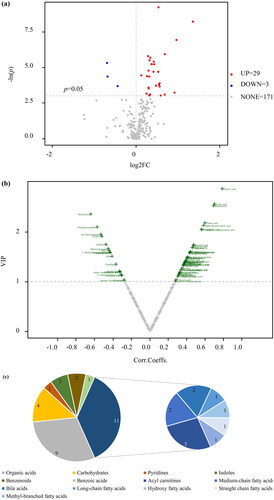
By combining the results of the OPLS-DA and univariate analysis, 53 metabolites with significant differences were obtained in the maternal serum samples (Supplemental Table 1). The predominant differential metabolites were lipids and lipid-like molecules, accounting for 32 out of the 53 types (60%) (). Among these, long-chain fatty acids were the main subtype, followed by medium-chain fatty acids, very-long-chain fatty acids, and acylcarnitines. Nineteen out of the thirty-two (59%) lipids and lipid-like molecules were unsaturated fatty acids, whose levels were increased in the macrosomia group, including dodecanoylcarnitine (C12), DHA, eicosapentaenoic acid (EPA), arachidonic acid (ARA), and linoleic acid ().
Table 2. Differential metabolites of lipids and lipid-like molecules in maternal serum (μmol/L).
Thirty different metabolites were identified in the umbilical cord serum samples, in which the levels of 28 metabolites were increased in the macrosomia group (Supplemental Table 2). Lipids and lipid-like molecules were the main differential metabolites, accounting for 37% of the total, followed by organic acids (). And acylcarnitines were the major subtypes, which contained adipoylcarnitine (C6DC), C2, and tetradecanoylcarnitine (C14) (). After correction for multiple hypothesis testing, 24 different metabolites were obtained. Medium-chain fatty acids and bile acids were the major subtypes. Adipic acid, 2-Methylhexanoic acid, 12-Hydroxystearic acid, valeric acid, isocaproic acid and C6DC were more abundant in the macrosomial group. In contrast, glycochenodeoxycholicacid and taurochenodeoxycholic acid levels were decreased. Univariate analysis of maternal-fetal serum gradients was performed on metabolically different unsaturated fatty acids found in the maternal blood. The maternal-fetal serum gradients differed significantly between the control and macrosomia infants. Especially polyunsaturated fatty acids, such as ARA, adrenic acid, docosapentaenoic acid (DPA), and DHA, their serum gradients were significantly less than in the control group ().
Table 3. Differential metabolites of lipids and lipid-like molecules in umbilical cord serum (μmol/L).
Table 4. Maternal to umbilical cord serum unsaturated fatty acids differences between control and macrosomia subjects.
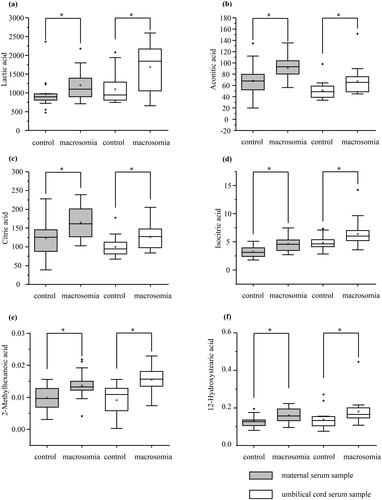
There were six common differential metabolites in the maternal and umbilical cord sera. The levels of lactic acid, aconitic acid, citric acid, isocitric acid, 2-methylhexanoic acid, and 12-hydroxystearic acid in the maternal and umbilical cord serum of the macrosomia group were significantly higher than those in the control group ().
Figure 6. Common differential metabolites in maternal and umbilical cord serum (μmol/L). (a) lactic acid (b) Aconitic acid (c) Citric acid (d) Isocitric acid (e) 2-Methylhexanoic acid (f)12-Hydroxystearic acid.
* p < 0.05
Pathway analysis
KEGG enrichment analysis showed that there were 32 pathways enriched with differential metabolites in the maternal serum (Supplemental Table 3). Lipid metabolism was the main metabolic pathway, followed by the carbohydrate, amino acid, cofactor, and vitamin metabolism pathways. Among the metabolic pathways, the linoleic acid pathway had the greatest effect (). Fatty acid biosynthesis was enriched with most metabolites comprising 5 compounds (myristic acid, dodecanoic acid, palmitoleic acid, decanoic acid, and oleic acid).
Figure 7. Metabolite set enrichment analysis. (a) The pathways in maternal serum. (b) The pathways in in umbilical cord serum.
The statistically significant pathways were marked with names.
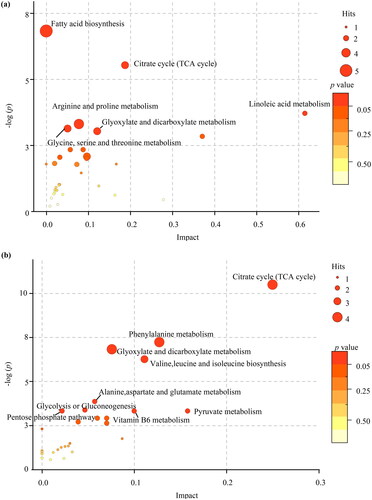
Thirty-one pathways were enriched with differential metabolites in the umbilical cord serum (Supplemental Table 4). Among these metabolic pathways, carbohydrate metabolism was the dominant pathway, followed by nucleotide, amino acid, cofactor, vitamin, and lipid metabolisms. Differential metabolites were significantly enriched in the citrate cycle (tricarboxylic acid, TCA cycle), including oxoglutaric acid, isocitric acid, citric acid, and pyruvic acid (). In addition, the TCA cycle, glyoxylate, and dicarboxylate metabolism were the most common statistically significant pathways of differential metabolites in the maternal and umbilical cord sera.
Clinical correlation analysis
We analyzed the correlation between common differential metabolites and clinical parameters of mothers and newborns (). In the maternal serum, the levels of 2-methylhexanoic acid, isocitric acid, aconitic acid, lactic acid, and citric acid were positively correlated with pregnancy weight gain. The levels of 12-hydroxystearic acid were negatively correlated with maternal age. In the umbilical cord serum, there was a positive correlation between 2-methylhexanoic acid, 12-hydroxystearic acid, and gestational age.
Table 5. Results of correlation analysis between common metabolites and clinical parameters.
Discussion
In this study, we confirmed the metabolic alterations in maternal and fetal sera in macrosomia using UPLC-MS/MS. Lipids and lipid-like molecules were the predominant metabolites. We preliminarily discussed the differences in the metabolic characteristics of pregnant women and fetuses with macrosomia.
In the maternal serum, lipids and lipid-like molecules accounted for 60% of the 53 metabolites with significant differences. Fatty acids were the main subtypes. Fifty-nine percent of the lipids and lipid-like molecules were unsaturated fatty acids, whose levels were increased in the macrosomia group and were significantly enriched in the linoleic acid metabolic pathway and fatty acid biosynthesis. Lipids are anabolized in the second trimester of pregnancy, and the storage of maternal lipids is accelerated to meet the needs of fetal growth [Citation15]. In the third trimester of pregnancy, lipid stores are mobilized to transport more fatty acids across the placenta, thereby participating in fetal fat deposition and weight gain [Citation16]. And macrosomia is considered to be the manifestation of maternal metabolic impairment. Some adipokines secreted by adipose serve as protective feedback mechanisms [Citation17]. Therefore, it is plausible that the differential metabolites were enriched in the linoleic acid metabolic pathway and fatty acid biosynthesis. We also found that the levels of unsaturated fatty acids in the serum of pregnant women with macrosomia increased, especially DHA, EPA, and ARA. These results are consistent with those of a recent study on maternal lipid profile and BW [Citation18]. Some studies have shown that during pregnancy, a significant physiological adaptability of a mother is greater metabolic flexibility than in the non-pregnant state, thus protecting the growth of the fetus from the influence of the mother’s nutritional deficiency [Citation19,Citation20]. DHA and ARA are important nutrients for the growth and development of the fetal cerebral cortex and rapidly accumulate in the fetus during the last trimester of pregnancy [Citation21]. A large proportion of them is stored in adipose tissue. The ability of fetuses and placentas to synthesize unsaturated fatty acids through fatty acid desaturation and carbon chain extension is limited [Citation22]. In macrosomia, the increase in DHA and ARA levels in the maternal serum could help meet the requirements of a fetal brain growth spurt. Currently, the transport and metabolic mechanisms of DHA and ARA in the fetus have not been fully elucidated. Recent studies have shown that ARA, DHA, and dihomo-gamma-linolenic acid (DGLA) are actively selected by the placenta for biomagnification [Citation23,Citation24]. According to the analysis of maternal-fetal serum gradients, our findings support the existence of fetal biomagnification of these unsaturated fatty acids in normal BW infants. In macrosomia, the maternal-fetal transfer of unsaturated fatty acids appeared to be reduced. A potential interpretation of the differences within the maternal plasma is that, compared to normal BW infants, macrosomia disturbed the mechanisms implicated in placental enrichment.
We also found a significant increase in acylcarnitine levels in the differential metabolites of lipids and lipid-like molecules in the umbilical cord serum, including C6DC. This result is similar to that obtained by Wright and Baker [Citation12]. They demonstrated that macrosomia had elevated levels of C2, C3, dicarboxylic acid (glutarylcarnitine, C6DC), and long-chain acylcarnitines. Acylcarnitine is a lipid produced by the combination of carnitine with acyl-coenzyme A through fatty acid beta-oxidation, which is necessary for energy metabolism within the mitochondria [Citation25]. In previous studies, the level of cyclic acylcarnitine was identified as a sign of mitochondrial dysfunction, reflecting the coordination efficiency of fatty acid beta-oxidation, the tricarboxylic acid cycle, and electron transfer chains [Citation26]. An increase in acylcarnitine level may be related to incomplete beta-oxidation of fatty acids, which accumulate reactive oxygen species and affect the conduction of insulin signals [Citation27]. Meanwhile, it has been reported that an increase in short-chain acylcarnitine level, which is similar to that in obese children, is related to a compensatory energy metabolism mechanism when mitochondrial fatty acid metabolism decreases [Citation12,Citation28–30]. High levels of acylcarnitine are also found in diabetic and obese adults [Citation31,Citation32]. Therefore, we hypothesized that C6DC was positively correlated with neonatal BW, which may be associated with long-term metabolic disorders. Besides, changes in acylcarnitine levels are related to many monogenic diseases, such as very long-chain acyl-CoA dehydrogenase deficiency (VLCADD) and methylmalonyl-CoA mutase deficiency [Citation33]. Currently, the detection of acylcarnitine in blood using mass spectrometry has been widely used to screen metabolic genetic diseases in neonates. Our results suggest that an increase in acylcarnitine levels in macrosomia may affect the accuracy of genetic and metabolic disease screening.
We also screened six common differential metabolites in the maternal and umbilical cord sera (lactic acid, aconitic acid, citric acid, isocitric acid, 2-methylhexanoic acid, and 12-hydroxystearic acid) and found that their levels were higher in the macrosomia group than those in the control group. Lactic acid is an end-metabolic product of glycolysis and is considered a marker for monitoring and evaluating fetal hypoxia during labor [Citation34]. As an energy substrate for fetal growth, lactic acid can be produced by aerobic glycolysis at the maternal-fetal interface of the placenta, resulting in significantly higher lactic acid levels in the fetus than in the mother [Citation35]. We found that lactic acid levels in the maternal and cord blood showed increasing trends in macrosomia and were significantly and positively correlated with pregnancy weight gain. The high level of lactic acid in macrosomia is related to temporary acute hypoxia of the fetus at delivery [Citation36]. However, lactic acid is one of the main carbon sources for fatty acid synthesis in fetal bovines, which might be associated with weight gain [Citation37].
Citric acid and isocitric acid are TCA cycle intermediates [Citation38]. According to previous studies, citric acid promotes fatty acid synthesis. Citric acid is the main carrier for the transfer of acetyl from the mitochondria to cytosol and a constitutive activator of acetyl-CoA carboxylase, which is the rate-limiting enzyme for fatty acid synthesis [Citation39,Citation40]. In our study, citric acid and isocitric acid were also positively correlated with pregnancy weight gain in the maternal blood and were elevated in the cord and maternal blood of macrosomia.
Our study has some limitations. First, the sample size of our study was small and collected from the same hospital. We planned to collect more samples from different hospitals to reduce bias and verify our results. Second, in terms of clinical data collection, we did not consider the diet and living habits of the pregnant women. The effects of these factors on the metabolic profiles of pregnant women could not be excluded. Third, we only collected maternal and umbilical cord blood, but not placental blood. And the maternal blood samples were collected during the third trimester of pregnancy, not at birth. In subsequent experiments, we planned to collect the placenta and the maternal blood samples at birth simultaneously to better analyze and understand the metabolic differences between mothers and fetuses with macrosomia.
In summary, metabolic abnormalities were observed in the sera of pregnant women and fetuses with macrosomia. Lipids and lipid-like molecules were the predominant differential metabolites but had different classifications in the maternal and umbilical cord sera. These results may provide new insights into the long-term metabolic disorders associated with macrosomia. Further studies are needed to verify this study and elucidate the underlying molecular mechanisms.
Acknowledgements
We thank the participants for their understanding and cooperation.
Disclosure statement
No potential conflict of interest was reported by the author(s).
Data availability statement
The data that support the findings of this study are available from the corresponding author upon reasonable request.
Correction Statement
This article has been republished with minor changes. These changes do not impact the academic content of the article.
Additional information
Funding
References
- Akanmode AM. Macrosomia. Treasure Island (FL): StatPearls Publishing; 2022.
- Martin JA, Hamilton BE, Osterman MJK, et al. Births: final data for 2018. Natl Vital Stat Rep. 2019;68(13):1–47.
- Chavkin U, Wainstock T, Sheiner E, et al. Perinatal outcome of pregnancies are complicated with extreme birth weights at term. J Matern Fetal Neonatal Med. 2019;32(2):198–202. doi: 10.1080/14767058.2017.1376048.
- Beta J, Khan N, Fiolna M, et al. Maternal and neonatal complications of fetal macrosomia: cohort study. Ultrasound Obstet Gynecol. 2019;54(3):319–325. doi: 10.1002/uog.20278.
- Scifres CM. Short- and long-term outcomes associated with large for gestational age birth weight. Obstet Gynecol Clin North Am. 2021;48(2):325–337. doi: 10.1016/j.ogc.2021.02.005.
- Johnsson IW, Haglund B, Ahlsson F, et al. A high birth weight is associated with increased risk of type 2 diabetes and obesity. Pediatr Obes. 2015;10(2):77–83. doi: 10.1111/ijpo.230.
- Boney CM, Verma A, Tucker R, et al. Metabolic syndrome in childhood: association with birth weight, maternal obesity, and gestational diabetes mellitus. Pediatrics. 2005;115(3):e290–e296. doi: 10.1542/peds.2004-1808.
- Dennedy MC, Dunne F. Macrosomia: defining the problem worldwide. Lancet. 2013;381(9865):435–436. doi: 10.1016/S0140-6736(12)62090-X.
- Jiang H, Wen Y, Hu L, et al. Serum MicroRNAs as diagnostic biomarkers for macrosomia. Reprod Sci. 2015;22(6):664–671. doi: 10.1177/1933719114561557.
- Liu J, Liu G, Li Z. Importance of metabolomics analyses of maternal parameters and their influence on fetal growth. Exp Ther Med. 2017;14(1):467–472. doi: 10.3892/etm.2017.4517.
- Sun H, Wang Y, Wang C, et al. Metabolic profiling of umbilical cord blood in macrosomia. Int J Obes. 2018;42(4):679–685. doi: 10.1038/ijo.2017.288.
- Wright EL, Baker PR. Neonatal macrosomia is an interfering factor for analytes on the Colorado state newborn screen. J Clin Endocrinol Metab. 2020;105(3):e1561–e1568. doi: 10.1210/clinem/dgz183.
- Polinski KJ, Robinson SL, Putnick DL, et al. Epigenetic gestational age and the relationship with developmental milestones in early childhood. Hum Mol Genet. 2023;32(9):1565–1574. doi: 10.1093/hmg/ddac302.
- Xie G, Wang L, Chen T, et al. A metabolite array technology for precision medicine. Anal Chem. 2021;93(14):5709–5717. doi: 10.1021/acs.analchem.0c04686.
- Hellmuth C, Lindsay KL, Uhl O, et al. Maternal metabolomic profile and fetal programming of offspring adiposity: identification of potentially protective lipid metabolites. Mol Nutr Food Res. 2019;63(1):e1700889. doi: 10.1002/mnfr.201700889.
- Herrera E, Amusquivar E, López-Soldado I, et al. Maternal lipid metabolism and placental lipid transfer. Horm Res. 2006;65 Suppl 3(Suppl. 3):59–64. doi: 10.1159/000091507.
- Vrachnis D, Antonakopoulos N, Fotiou A, et al. Is there a correlation between apelin and insulin concentrations in early second trimester amniotic fluid with fetal growth disorders? J Clin Med. 2023;12(9):3166. doi: 10.3390/jcm12093166.
- Cinelli G, Fabrizi M, Ravà L, et al. Association between maternal and foetal erythrocyte fatty acid profiles and birth weight. Nutrients. 2018;10(4):402. doi: 10.3390/nu10040402.
- Bowman CE, Arany Z, Wolfgang MJ. Regulation of maternal–fetal metabolic communication. Cell Mol Life Sci. 2021;78(4):1455–1486. doi: 10.1007/s00018-020-03674-w.
- Parrettini S, Caroli A, Torlone E. Nutrition and metabolic adaptations in physiological and complicated pregnancy: focus on obesity and gestational diabetes. Front Endocrinol. 2020;11:611929. doi: 10.3389/fendo.2020.611929.
- Basak S, Mallick R, Banerjee A, et al. Maternal supply of both arachidonic and docosahexaenoic acids is required for optimal neurodevelopment. Nutrients. 2021;13(6):2061. doi: 10.3390/nu13062061.
- Larqué E, Demmelmair H, Gil-Sánchez A, et al. Placental transfer of fatty acids and fetal implications. Am J Clin Nutr. 2011;94(6 Suppl):1908S–1913S. doi: 10.3945/ajcn.110.001230.
- Crawford MA, Sinclair AJ, Hall B, et al. The imperative of arachidonic acid in human reproduction. Prog Lipid Res. 2023;91:101222. doi: 10.1016/j.plipres.2023.101222.
- Giuffrida F, Fleith M, Goyer A, et al. Human milk fatty acid composition and its association with maternal blood and adipose tissue fatty acid content in a cohort of women from Europe. Eur J Nutr. 2022;61(4):2167–2182. doi: 10.1007/s00394-021-02788-6.
- Arjmand B, Dehghanbanadaki H, Yoosefi M, et al. Association of plasma acylcarnitines and amino acids with hypertension: a nationwide metabolomics study. PLOS One. 2023;18(1):e279835. doi: 10.1371/journal.pone.0279835.
- Song Y, Lyu C, Li M, et al. Plasma acylcarnitines during pregnancy and neonatal anthropometry: a longitudinal study in a multiracial cohort. Metabolites. 2021;11(12):885. doi: 10.3390/metabo11120885.
- Aguer C, Mccoin CS, Knotts TA, et al. Acylcarnitines: potential implications for skeletal muscle insulin resistance. Faseb J. 2015;29(1):336–345. doi: 10.1096/fj.14-255901.
- Cho K, Moon JS, Kang J, et al. Combined untargeted and targeted metabolomic profiling reveals urinary biomarkers for discriminating obese from normal-weight adolescents. Pediatr Obes. 2017;12(2):93–101. doi: 10.1111/ijpo.12114.
- Müllner E, Röhnisch HE, von Brömssen C, et al. Metabolomics analysis reveals altered metabolites in lean compared with obese adolescents and additional metabolic shifts associated with hyperinsulinaemia and insulin resistance in obese adolescents: a cross-sectional study. Metabolomics. 2021;17(1):11. doi: 10.1007/s11306-020-01759-y.
- Koves TR, Ussher JR, Noland RC, et al. Mitochondrial overload and incomplete fatty acid oxidation contribute to skeletal muscle insulin resistance. Cell Metab. 2008;7(1):45–56. doi: 10.1016/j.cmet.2007.10.013.
- Palacios-González B, León-Reyes G, Rivera-Paredez B, et al. Serum metabolite profile associated with sex-dependent visceral adiposity index and low bone mineral density in a mexican population. Metabolites. 2021;11(9):604. doi: 10.3390/metabo11090604.
- Ramos-Roman MA, Sweetman L, Valdez MJ, et al. Postprandial changes in plasma acylcarnitine concentrations as markers of fatty acid flux in overweight and obesity. Metabolism. 2012;61(2):202–212. doi: 10.1016/j.metabol.2011.06.008.
- Mccoin CS, Knotts TA, Adams SH. Acylcarnitines–old actors auditioning for new roles in metabolic physiology. Nat Rev Endocrinol. 2015;11(10):617–625. doi: 10.1038/nrendo.2015.129.
- Holzmann M, Cnattingius S, Nordström L. Lactate production as a response to intrapartum hypoxia in the growth-restricted fetus. BJOG. 2012;119(10):1265–1269. doi: 10.1111/j.1471-0528.2012.03432.x.
- Ma L, Huang X, Muyayalo KP, et al. Lactic acid: a novel signaling molecule in early pregnancy? Front Immunol. 2020;11:279. doi: 10.3389/fimmu.2020.00279.
- Westgren M, Divon M, Horal M, et al. Routine measurements of umbilical artery lactate levels in the prediction of perinatal outcome. Am J Obstet Gynecol. 1995;173(5):1416–1422. doi: 10.1016/0002-9378(95)90627-4.
- Settle P, Sibley CP, Doughty IM, et al. Placental lactate transporter activity and expression in intrauterine growth restriction. J Soc Gynecol Investig. 2006;13(5):357–363. doi: 10.1016/j.jsgi.2006.04.006.
- Bulló M, Papandreou C, García-Gavilán J, et al. Tricarboxylic acid cycle related-metabolites and risk of atrial fibrillation and heart failure. Metabolism. 2021;125:154915. doi: 10.1016/j.metabol.2021.154915.
- Arnold PK, Finley LWS. Regulation and function of the mammalian tricarboxylic acid cycle. J Biol Chem. 2023;299(2):102838. doi: 10.1016/j.jbc.2022.102838.
- Lillefosse HH, Clausen MR, Yde CC, et al. Urinary loss of tricarboxylic acid cycle intermediates as revealed by metabolomics studies: an underlying mechanism to reduce lipid accretion by whey protein ingestion? J Proteome Res. 2014;13(5):2560–2570. doi: 10.1021/pr500039t.