
Abstract
Herbaria are renowned as collections of specimens for research in plant taxonomy, plant identification and more recently in plant phylogenetics. The production of Floras and monographs in herbaria is fundamental to the understanding of plant taxonomy and plant biogeography. Herbaria have played an important role in providing the raw geographic data behind plant species distributions which form the basis of the most commonly used biodiversity metric: species richness. Less well recognised is the potential for using comprehensive species checklists, produced by herbaria, as a sampling frame when projecting biodiversity metrics. Functional diversity metrics derived from plant trait values are growing in importance in biodiversity monitoring; however, it is unclear whether the trait-based functional attributes are responsive to changes in species richness in all geographic areas. Modelling of the spatial distribution of trait values is one way to investigate the limits of biodiversity monitoring reliant on trait values. The research outputs of herbaria are arguably an untapped resource of such trait data. Greater digitisation of published Flora treatments as well as continuing digitisation of herbarium specimens is increasingly making these resources more available. With appropriate methods to ameliorate known biases in the species locality and plant trait data held by herbaria, these institutions can play an important role in building spatial models of plant trait distributions. Such models help to establish the relationships between species richness and plant functional diversity metrics in different biomes required for trait-led biodiversity monitoring. Here we present a six-step method to allow data held by herbaria to be used to establish a spatial model of functional diversity metrics at a continental scale.
Introduction
Specimen-derived data held by herbaria drive research in a wide range of different disciplines (Carine et al., Citation2018; Funk, Citation2003). The core specimen-level information of taxonomic identifications associated with a locality is used in biogeography, taxonomy, ecology and conservation, and additional information recorded on specimens is used to publish work on ethnobotany, plant use, phenology and the history of science. Extractive sampling from specimens is used in the study of genetic variation and in phylogenetics as well as the study of tissue chemistry. Specimen images have also been used in studies of herbivory and phytopathology (Heberling et al., Citation2019; Heberling & Isaac, Citation2017; Lavoie, Citation2013).
Alpha taxonomic work concerned with documenting, describing and naming plant taxa is arguably the most widely recognised research activity undertaken in herbaria, with such research typically being disseminated through the writing of Floras (a description of all the plant taxa in a country or region) or monographs (a description of plants within a taxonomic group, such as a genus). The compilation of point localities from which each plant species is known and the mapping of plant species distributions is a fundamental element of taxonomic research (Carine et al., Citation2018)—indeed, specimen-derived data from herbaria have played a central role in the establishing of spatial patterns of plant species richness (Brummitt et al., Citation2016; Burgess et al., Citation2005; Koch et al., Citation2017; Sosef et al., 2017). Despite the ongoing growth in possible uses for herbarium specimens, however, the potential for their role in understanding the spatial distribution of biodiversity metrics is still not fully appreciated.
Herbaria are particularly important in biodiversity research because of their central role in collating comprehensive checklists that document all the species known from geographic regions. For example, Plants of the World Online (Kew, Citation2019) lists the plant species known to occur in each TDWG level 2 region of the world. Such a global checklist is considered to be authoritative as it draws on a huge sweep of taxonomic literature to ensure that taxonomic synonymy is dealt with thoroughly, and also keeps pace with the description of new species. Herbaria also hold information about some of the most range-restricted and poorly documented species currently described, that are otherwise often overlooked. For example, when Sosef et al. (2017) used the herbarium specimen database Rainbio (Dauby et al., Citation2016) to investigate plant diversity across the continent of Africa, they found that, of the 25,356 species within the database, 3438 species (14%) had only one specimen and 8026 species (31%) had fewer than five specimens. Herbaria are unique as a repository for the locality details and species-level traits held within the specimens and their derived taxonomic descriptions for such poorly known species.
Species richness, the number of species known from a given geographical unit, is the most readily understandable metric of biodiversity. However, if we accept that biodiversity is a multifaceted concept (Franklin et al., Citation1981; Ricotta, Citation2005) there are several other metrics that can be equally if not more sensitive to change. Metrics of plant functional diversity derived from the trait values of a sample of plants, for example, are summary statistics of the full distribution of values of multiple traits for communities of numerous species. In general, the higher the value of a functional diversity metric, the greater the morphological dissimilarity between coexisting plant species. The discipline of functional ecology has developed from a desire to predict how changes in species composition affect ecosystem-level processes, and therefore requires an understanding of which functional traits (Chapin et al., Citation2000) are influential in this (Petchey & Gaston, Citation2006).
Herbaria have a unique role to play in understanding current and historic plant species composition (from which species richness is estimated) and also providing data on species-level traits (‘species-level’ typically implies minimum and maximum trait values for each species). As an example of a herbarium-derived trait database, PalmTraits1.0 (Kissling et al., Citation2019) is a compilation of species-level trait values from more than 130 taxonomic sources for nearly 2600 species of palms from 181 genera. Kissling et al. (Citation2019) describe how some trait values were taken from measurements made from specimens to fill gaps in this database, while the majority of trait values came from Floras, such as the treatment of the palm family within the Flora of Tropical East Africa (Dransfield, Citation1986) that itself is produced from measurements taken from herbarium specimens.
We similarly advocate for the compilation of species-level plant trait values from taxonomic literature, derived from measurements of multiple specimens, but for a set of species sampled at random from a comprehensive checklist for a chosen continent, rather than for just one taxonomic group, such as palms. Biodiversity metrics always require some form of sampling strategy because of the non-trivial nature of the task of establishing the species composition of spatial units or the trait values exhibited by those species. Herbaria provide trait values and localities of species that are otherwise poorly recorded. The broad scope of data held within herbaria allow for a robust sampling strategy to be applied, thus avoiding some of the biases of alternative data sources. This would be an advance on previous approaches that use data sets with greater levels of taxonomic and growth-form bias, as discussed below.
Methodologies used to examine spatial variation in plant trait values
Ecological plots or quadrats are without doubt a hugely valuable way of investigating both species composition and plant trait values in a particular location, and importantly can allow investigation of intraspecific variation in trait values. However, when used as a basis for extrapolated projections of functional trait values, it is important to acknowledge that trait values measured in ecological plots are typically only a subset of all the values that could be observed in those plots, limited to plant species that meet height or abundance criteria (Butler et al., 2017; Ordoñez et al., Citation2009; Wang et al., Citation2016), or based on combinations of trait values from multiple different ecological plot studies (Maire et al., Citation2015). In order to analyse the distribution of traits across a wide range of ecoregions, some studies have combined plant species distribution information with plant trait data from different sources. For example, Lamanna et al. (2014) used lists of plant species across a range of ecological plots and then assigned species-level traits to those species using plant trait databases. Studies using this approach face a trade-off between understanding the detailed intraspecific variation in traits versus understanding variation in traits across a broader range of species from a wider range of ecoregions. Methodologies used to measure plant traits in ecological plots do not always ensure that the sample of species within a given spatial unit is representative of either species richness or the full range of trait values, biases which can then be passed on to derived trait databases such as TRY (Kattge et al., 2011) and BIEN (BIEN, Citation2017).
This paper considers the importance of herbarium-derived authoritative checklists as a sampling framework with which to model diversity metrics using a robust sample of species. Weigelt et al. (Citation2020) have recently identified species checklists derived from herbarium data as crucial to extracting species-level trait values from Floras and other taxonomic literature. As also advocated here, Weigelt et al. (Citation2020) use Floras and taxonomic literature to infer trait values and growth form classes for species. However, by only using the most readily available data, rather than focussing on extracting information for a representative sample of species, the approach of Weigelt et al. (Citation2020) introduces strong spatial biases. For example, three recently completed Floras (the Flora of Ethiopia (completed in 2009, detailing 6000 species), the Flora of Somalia (completed in 2006) and the Flora of Tropical East Africa (completed in 2012, with 12,104 species)) are not yet included by Weigelt et al. (Citation2020). Here we propose a methodology that uses herbarium-produced global checklists as a sampling frame to target research into the trait values held within herbarium-derived publications and the spatial distributions of those species that can be inferred from specimen-based localities.
The relationship between species richness and functional diversity
Metrics of functional diversity are rarely considered as stand-alone biodiversity metrics, but instead are considered relative to species richness. On their own, functional diversity metrics can show which geographical areas have the greatest range of spread in trait values. However, when functional diversity is assessed as a property conditional on species richness, a greater understanding of the possible ecological processes driving the given functional diversity metric is obtained. We follow Swenson et al. (2012) in advocating the use of null models to identify whether functional diversity is greater than expected given the species richness of a spatial unit, less than expected given the species richness or within a confidence interval of expected functional diversity. A functional diversity metric with a value less than a confidence interval generated by a suitable null model is evidence of ecological filtering (Freschet et al., 2011; Kraft & Ackerly, Citation2010). Keddy (Citation1992) defined ecological filtering as a situation when, of the wide range of plant species that could disperse to a locality, both biotic interactions between species and the degree to which each species’ traits are adapted to local environmental conditions determine the particular assemblage of species that can exist at a locality. When considering the drivers behind the spatial distribution of plant traits, Ricklefs (Citation2004) included ecological filtering within a concept of ‘local determinism’ under which local trait values are driven by the balance between ecological filtering (Keddy, Citation1992), and competition-limiting similarity (MacArthur & Levins, Citation1967).
Given the ecological importance of understanding functional diversity metrics within the context of species richness, we advocate assembling herbarium data that will allow both to be modelled spatially. An additional reason is the rise of monitoring plant diversity using repeated measurements of plant traits (Knapp & Boxshall, Citation2010; Wesuls et al., Citation2010). In areas where there is either ecological filtering (indicated by functional diversity being less than expected given the species richness) or trait over-dispersion (greater functional diversity than expected given the species richness), a substantial change in species richness may not be accompanied by a similarly substantial change in functional diversity. The six-step method proposed here uses data available in herbaria to identify areas of ecological filtering for chosen traits at a fine spatial scale.
A methodology for studying continental-scale variation in plant functional diversity
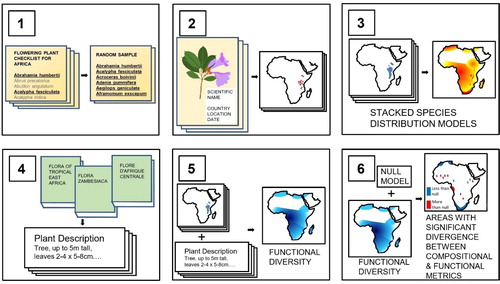
The methodology proposed () covers the following steps:
Fig. 1. (1) A random sample of plant species is taken from authoritative checklists that incorporate all known species from a continent. (2) Point localities are taken from herbarium specimens and databases where such localities are compiled. Specimen localities without coordinates are georeferenced. (3) A projection of the range of each of the sampled species is generated using an ensemble of species distribution models, using climatic and topographic variables as predictors. Summing the number of randomly sampled species projected to be present in each gridded pixel gives a projection of species richness. (4) Plant trait values providing dimensions of leaves, seeds and plant height for each of the randomly sampled species are extracted from taxonomic literature such as the descriptions held within Floras. (5) By appending species-level trait values to each projected species, metrics such as functional richness, functional dispersion or functional uniqueness can be calculated for each pixel whose species richness exceeds a minimum number of species. (6) Null models that, for a particular functional diversity metric, provide a confidence interval for each level of species richness allow identification of geographical areas where functional diversity metrics diverge from species richness.
Selection of a random sample of species from authoritative checklists
Compilation and georeferencing of point localities for the random sample of species taken from herbarium specimens
Stacking Species Distribution Models of overlapping species distributions using climatic and topographic variables as predictors
Compilation of plant trait values from taxonomic literature for the random sample of species
Calculation of biodiversity metrics for each pixel meeting a minimum number of species
Using null models to identify geographical areas where biodiversity metrics are, and are not, aligned
The novelty of this methodology comes from the use of a sample of species selected totally at random, which avoids frequently introduced biases towards large, widespread and abundant species in studies based on ecological plots and in trait value datasets derived from them. It also leads to the explicit consideration of functional diversity in the context of representative underlying patterns of species richness. Given the understandable taxonomic and ecological incompleteness of even large trait databases such as TRY, this necessitates extracting trait values from the most comprehensive source of plant species morphology: species descriptions produced from comparison of multiple herbarium specimens. Having set out the six steps of this methodology, we discuss which plant traits are most suitable for estimating continent-wide metrics of functional diversity, and discuss each step with reference to a study of plant functional diversity we have undertaken across the continent of Africa.
Global axes of plant trait variation
There is a growing consensus that plant traits describing three aspects of plant morphology—organismal height, leaf dimensions and seed traits—allow any species to be positioned within a global spectrum of plant form (Díaz et al., 2016; Westoby et al., Citation2002; Wright et al., Citation2004). Villéger et al. (Citation2008) and Díaz et al. (2016) have advocated the use of continuous traits such that any species can be placed in a multidimensional space described by these traits. This Leaf-Height-Seed framework (Westoby, Citation1998) has been shown to be part of key axes of plant specialisation across different environments, biogeographic regions and major plant lineages, and values recorded for any individual plant are limited by global constraints in the range of values that an individual trait such as height can take, and also by constraints on how values of different traits are combined (Díaz et al., 2016). For example, a plant species that is one of the shortest of all known species is highly unlikely to have a seed size that is one of the largest of all species.
We advocate using taxonomic literature ahead of using plant trait databases for studies of this sort, based on a random sample of species, for three reasons. Firstly, taxonomic literature has a far more comprehensive coverage of known plant species than trait databases such as TRY (Kattge et al., 2011): of the 63,670 plant species known from the continent of Africa (Kew, Citation2019), 22,108 species (34.7%) have values for at least one trait on TRY, but only 15% of known African plant species (1483 out of 9887 species) have values for four or more traits in the TRY database. A second reason is that the geographic location of species with trait values within the TRY database is also heavily biased. Thirdly, given that taxonomic species descriptions tend to refer to seed dimensions and the TRY database has more data on seed mass than on seed volume, it is not possible to combine data from these two data sources within a common multidimensional trait-space.
Herbaria and museums provide an alternative data source as they hold a huge wealth of information regarding both the distribution of species and, in the form of taxonomic descriptions, their traits. The publications written by scientists based in herbaria contain morphological descriptions of hundreds of thousands of plant species, often with maximum and minimum values of continuous plant traits, such as seed size, leaf dimensions and plant height, all derived from numerous individual specimens per species. The completion or near completion of several Floras across the continent of Africa (Beentje, Citation2015; Friis, Citation2009) make these volumes a realistic but under-utilised source of plant trait values for this continent.
Using taxonomic literature as a source of trait values rather than the more demanding task of examining the morphological dimensions of multiple specimens for each species is a much more time-efficient way to collect such data. Species descriptions in Floras and other taxonomic literature will typically state trait ranges derived from a comprehensive sample of the available specimens, usually from multiple herbaria. This means that finding the species description is less resource-intensive than finding a representative sample of specimens to re-measure, although in cases where species descriptions are based on only a handful of specimens, perhaps without showing pertinent characteristics, or are particularly succinct, such as those in Flora Capensis (Thiselton-Dyer, Citation1900) in which a range of leaf widths might be stated without stating leaf length, this may be necessary.
A limitation of species descriptions in Floras is that they are largely unstandardised and can differ in detail and the number of plant organs referred to. While there are standardised monographs, such as Grassbase (Clayton et al., Citation2006) and standardised Floras such as Flora of China (Brach & Song, Citation2006), that are stored in formal databases, the majority are not. This is particularly relevant for categorical traits that are recorded descriptively. Due to the largely unstandardised nature of species descriptions, the lack of a descriptor of a categorical trait such as succulence, for example, does not always provide a reliable indication that the species under consideration is not succulent. In comparison, quantitative traits are less often omitted from species descriptions, making them a more reliable source of information, as well as allowing each species to be placed within a multidimensional continuum of trait-space.
The continuous dimensions recorded in species descriptions typically include maximum and minimum values for plant height, leaf length, leaf width, seed length and/or seed diameter. Descriptive terms for leaf shape can be used to infer leaf area (e.g. a linear leaf could be assumed to be rectangular) and likewise descriptions of seed shape to infer seed volume. Given that organs will be measured at different stages of growth and development, species-level maximum values (following Kissling et al. Citation2019) of each of these three traits are most suitable for positioning a species in trait-space. A substantial minority of species are known from fewer than five specimens, so it is likely that the spatial variation of intraspecific trait values will not be known; species-level values are therefore most appropriate for modelling the distribution of trait values across large geographic regions such as a continent. However, it should be noted that in some plant communities the range of trait values will be heavily influenced by a few widespread species that might exhibit substantial spatial variation in trait values at the intraspecific level that will not be captured by this approach.
Details of the six-step methodology
Here we extend the methodology of Swenson et al. (2012) who assigned plant traits from the TRY database (Kattge et al., 2011) to lists of tree species recorded as herbarium specimens in each 1° or 5° square in South America. Although the number of locations in which botanical specimens have been recorded far exceeds the number of localities for which there is information from ecological plots, merely including localities of databased herbarium specimens does not give an accurate representation of species diversity either, due to existing geographical biases in collecting effort for purely pragmatic and logistical reasons. This is why we advocate using a random list of species selected from authoritative checklists that account for synonymy. For example, Plants of the World Online (Royal Botanic Gardens, Kew, Citation2019) can be used to indicate presence or absence of a species within TDWG level 2 regions globally.
We present an example of this methodological approach based on a sample of 586 species from the continent of Africa. We were able to extract trait values for 484 of these species from taxonomic literature, representing a c.1% sample of all known plant species from the continent. Species were selected at random such that each of the 63,670 plant species known from the continent of Africa each had an equal chance of being chosen. (Such checklists take into account synonymy including cases when a given species is assigned multiple different scientific names). A random sample of species also ensures representative geographic variation in species diversity (Van Proosdij et al., Citation2016). We further extend the methodology of Swenson et al. (2012) by extrapolating the distribution of species into areas of suitable habitat where herbarium specimens may not have been collected, using species distribution modelling.
The output of step 1 is a random sample of plant species from all those known from the continent considered—in this case the continent of Africa. The data gathered in steps 2 and 4 depend on the species selected within this random sample. Finding sufficient point localities for each of the randomly chosen species can largely be done using specimen databases such as Rainbio (Dauby et al., Citation2016) or GBIF (2019). GBIF incorporates records of citizen science observations from platforms such as iNaturalist (iNaturalist, Citation2019), but we recommend using localities from verified specimens to ensure an auditable data trail. Our experience is that a significant minority of species either have no available locality points within these databases, or too few points for modelling. For such species physical searches of specimens in herbaria followed by databasing and geo-referencing of any specimens found may prove necessary. We also advocate for these specimens to be flagged as priorities for digitisation.
The output of step 2 is a set of reliable point localities for each randomly sampled species. These point localities form the basis for species distribution modelling in step 3. Species distribution modelling is a correlative approach that calculates the likelihood of occurrence for a species based on the environmental variables where that species is known to occur. In the example presented here, of twenty-one environmental variables considered (nineteen Worldclim Bioclimatic variables (Fick & Hijmans, Citation2017; Hijmans et al., Citation2005) plus terrain index and distance to lakes (Lehner & Döll, Citation2004; Marthews et al., Citation2015)), the particular environmental variables chosen for each species relied on the variables within a convex hull enclosing specimen points that were correlated (Pearson correlation >0.6) being sequentially removed. The spatial extent of the environmental variables used to train and project models also varied between species, adapting the approach used by Senay et al. (Citation2013). An ensemble of three different modelling approaches was used across Africa: Bioclim (Busby, Citation1991), Maxent (Phillips et al., Citation2006) and Random Forest (Cutler et al., Citation2007).
Like any data source, data from herbaria can be biased in several ways. Two particular biases that need to be taken into account are: spatial and temporal biases in the collecting of plant specimens; and taxonomic biases in collecting. We address the spatial bias in the collecting of plant specimens (driven by a range of factors including accessibility and the specificity of research objectives (Daru et al., Citation2018)) by estimating spatial variation in specimen collecting intensity and using this to account for spatial bias when selecting background points or pseudoabsences (Phillips et al., Citation2009; Syfert et al., Citation2013). Spatial variation in collection intensity was taken into account within all three modelling approaches. Species that had too few locality points for species distribution modelling (fewer than 5) or whose species distribution models did not meet validity criteria were mapped using a point-to-grid method. Stacked, thresholded species distribution models produce two outputs: a projection of species richness (the number of species projected to be present within each spatial unit, see ) and a matrix of species composition that can be used to spatially project species-level trait values.
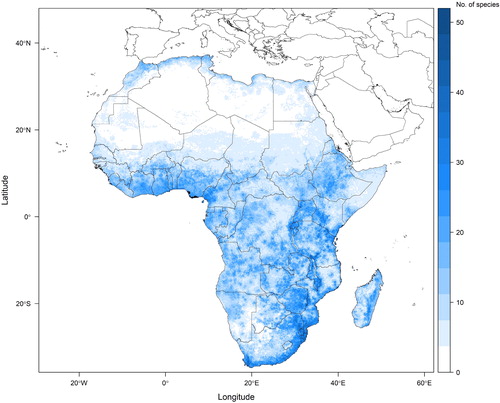
Fig. 2. Potential plant species richness across the continent of Africa based on a random sample of 484 angiosperm species whose localities were extracted from herbarium specimens, mapped to gridded pixels of a twelfth of a degree by a twelfth of a degree. Ensemble species distribution models were used to project species with sufficient points if those models met validity criteria. All other species are mapped using a point-to-grid method. This figure presents an example of how the methodology presented here (particularly up to the stacking of species distribution models in step 3) can be implemented.
For step 4, we advocate using maximum species-level trait values of plant height, leaf area and seed volume derived from taxonomic literature (Supplemental Data gives a list of over three hundred taxonomic references from which these trait values were derived for 586 African species) The stacked species distributions and the point data they are derived from do not include information on abundance, which limits the possible functional diversity metrics that can be calculated. We therefore recommend using functional richness, calculated as the volume of a multi-dimensional convex hull (Cornwell et al., Citation2006; Ricklefs & Travis, Citation1980) in step 5. Our projection of plant functional richness for the whole of the African continent is presented in .
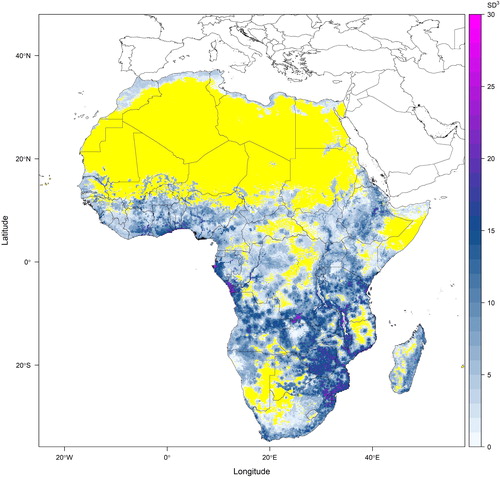
Fig. 3. Potential plant functional richness based on sampled species composition for Africa projected using the stacked species distribution models presented in . Species-level trait values of leaf area, seed volume and plant height were extracted from Floras and taxonomic literature (see Supplemental Data) and standardised such that the volume of occupied trait-space (functional richness measured using a convex hull method) had the units of trait value standard deviations raised to the power of three (because three traits were considered). This figure presents an example of the output of the fifth step of the proposed methodology. The yellow regions on this map are areas where the random sample of species has insufficient species to calculate functional richness.
Given the importance of understanding functional diversity in terms of its conditional relationship with species richness, as a final step 6 we endorse the use of null models (Gotelli, Citation1996; Swenson, Citation2014) to identify areas where metrics of species richness and functional richness diverge (not shown in this paper). Null models generate 95% confidence intervals of functional richness for a given species richness by repeatedly taking separate random samples of species up to the total of that species richness value, and calculating the respective functional richness of each. It is then possible to define geographical classes as falling within a 95% confidence interval of expected functional richness, or having a value higher or lower than this.
Discussion
Functional diversity within an ecosystem is an important component of an ecosystem’s biodiversity (Cernansky, Citation2017) and establishing spatial projections of functional diversity across a landscape and observing actual changes or anomalies is an increasingly important component of biodiversity monitoring (Knapp & Boxshall, Citation2010; Wesuls et al., Citation2010). A model of plant trait distributions based on the localities and traits from a more representative sample of plant species and underpinned by multiple specimens opens the possibility for a better understanding of the relationship between species diversity and functional diversity.
Authoritative species checklists, derived from herbarium specimens and curated taxonomically by herbarium staff, are instrumental resources for biodiversity research based on a robust sampling approach. We maintain that species descriptions within the Floras and taxonomic literature produced by herbaria will become an increasingly important source of species-level trait data. If these trait values are, as proposed here, mapped using localities derived from widely available herbarium specimens, these three herbarium products can be fundamental to a more accurate projection of functional diversity metrics.
The methodological approach we propose has its limitations as it is sensitive to the reliability of species distribution models that do not take into account species interactions, and is also limited in the categories of traits that can be extracted; for example, leaf economic spectrum traits that reveal resource allocation in leaves (Wright et al., Citation2004) are not recorded in taxonomic literature, and our approach does not include information about species abundances. However, it is an advance on previous attempts that have other biases in the species and/or traits sampled, as described in this paper.
Data in herbaria can be used to identify geographic areas where compositional and functional diversity metrics diverge. Such divergence (including that due to ecological filtering) has important implications for biodiversity monitoring products based on structural or functional traits. Previous studies have emphasised that divergence can be detected at global or continental scales (Freschet et al., 2011; Swenson et al., 2012) as well as at the better-studied local scale. Herbarium-based studies with an explicit sampling strategy, providing a better representation of spatial variation in species richness, will aid in understanding this divergence between species richness and functional diversity at a range of spatial scales. As efforts to monitor biodiversity using remote sensing products based on structural or functional traits grow, identification of geographic areas where these biodiversity metrics diverge will only become more important.
Summary
We advocate a method to model the spatial distribution of two biodiversity metrics, species richness and functional richness, by combining under-used biogeographic and plant trait information held by herbaria to investigate, at a continental scale, geographic areas where functional and compositional biodiversity metrics diverge. Herbaria document functionally relevant morphological traits and geographic distributions of species that are not recorded in most studies made at more local scales. The use of a herbarium-derived authoritative species checklist to formally sample species and hence include those that are poorly known alongside better-recorded species is an improved approach to investigating functional diversity that will yield more robust results across such large spatial scales. This approach identifies geographic areas where species richness and functional richness diverge, enhancing our understanding of ecological processes and the use of plant traits for monitoring biodiversity.
Associate Editor: Maria Vorontsova
Supplemental Material - Appendix
Download MS Word (187.4 KB)Acknowledgements
We thank Mark Carine for a positive critique that helped to improve a previous version of this manuscript. We are also grateful for the constructive comments of two anonymous reviewers.
Disclosure statement
No potential conflict of interest was reported by the author(s).
Supplemental data
Supplemental data for this article can be accessed here: https://doi.org/10.1080/14772000.2021.1887394.
Additional information
Funding
References
- Beentje, H. (2015). Science comes from collaboration and communication: The Flora of Tropical East Africa as an example. Webbia, 70, 171–179. https://doi.org/10.1080/00837792.2015.1013244
- BIEN. (2017). BIEN. https://bien.nceas.ucsb.edu/bien/
- Brach, A. R., & Song, H. (2006). eFloras: New directions for online floras exemplified by the Flora of China Project. TAXON, 55, 188–192. https://doi.org/10.2307/25065540
- Brummitt, N., Aletrari, E., Syfert, M. M., & Mulligan, M. (2016). Where are threatened ferns found? Global conservation priorities for pteridophytes. Journal of Systematics and Evolution, 54, 604–616. https://doi.org/10.1111/jse.12224
- Burgess, N., Küper, W., Mutke, J., Brown, J., Westaway, S., Turpie, S., Meshack, C., Taplin, J., McClean, C., & Lovett, J. C. (2005). Major gaps in the distribution of protected areas for threatened and narrow range Afrotropical plants. Biodiversity and Conservation, 14, 1877–1894. https://doi.org/10.1007/s10531-004-1299-2
- Busby, J. R. (1991). BIOCLIM - a bioclimate analysis and prediction system. In C. R. Margules & M. P. Austin (Eds.), Nature conservation: Cost effective biological surveys and data analysis (pp. 64–68). CSIRO. https://doi.org/10.1590/2175-7860201869437
- Butler, E. E., Datta, A., Flores-Moreno, H., Chen, M., Wythers, K. R., Fazayeli, F., Banerjee, A., Atkin, O. K., Kattge, J., Amiaud, B., Blonder, B., Boenisch, G., Bond-Lamberty, B., Brown, K. A., Byun, C., Campetella, G., Cerabolini, B. E. L., Cornelissen, J. H. C., Craine, J. M., … Reich, P. B. (2017). Mapping local and global variability in plant trait distributions. Proceedings of the National Academy of Sciences of the United States of America, 114, E10937–E10946. https://doi.org/10.1073/pnas.1708984114
- Carine, M. A., Cesar, E. A., Ellis, L., Hunnex, J., Paul, A. M., Prakash, R., Rumsey, F. J., Wajer, J., Wilbraham, J., & Yesilyurt, J. C. (2018). Examining the spectra of herbarium uses and users. Botany Letters, 165, 328–336. https://doi.org/10.1080/23818107.2018.1482782
- Cernansky, R. (2017). Biodiversity moves beyond counting species. Nature, 546, 22–24. https://doi.org/10.1038/546022a
- Chapin, F. S., Zavaleta, E. S., Eviner, V. T., Naylor, R. L., Vitousek, P. M., Reynolds, H. L., Hooper, D. U., Lavorel, S., Sala, O. E., Hobbie, S. E., Mack, M. C., & Díaz, S. (2000). Consequences of changing biodiversity. Nature, 405, 234–242. https://doi.org/10.1038/35012241
- Clayton, W. D., Vorontsova, M. S., Harman, K. T., & Williamson, H. (2006). GrassBase - The online world grass flora. Retrieved November 13, 2018, from http://www.kew.org/data/grasses-db.html
- Cornwell, W. K., Schwilk, D. W., & Ackerly, D. D. (2006). A trait-based test for habitat filtering: Convex hull volume. Ecology, 87, 1465–1471. https://doi.org/10.1890/0012-9658(2006)87[1465:attfhf[PMC]2.0.co;2]
- Cutler, D. R., Edwards, T. C., Beard, K. H., Cutler, A., Hess, K. T., Gibson, J., & Lawler, J. J. (2007). Random forests for classification in ecology. Ecology, 88, 2783–2792. [Database] https://doi.org/10.1890/07-0539.1
- Daru, B. H., Park, D. S., Primack, R. B., Willis, C. G., Barrington, D. S., Whitfeld, T. J. S., Seidler, T. G., Sweeney, P. W., Foster, D. R., Ellison, A. M., & Davis, C. C. (2018). Widespread sampling biases in herbaria revealed from large-scale digitization. The New Phytologist, 217, 939–955. https://doi.org/10.1111/nph.14855
- Dauby, G., Zaiss, R., Blach-Overgaard, A., Catarino, L., Damen, T., Deblauwe, V., … Couvreur, T. L. P. (2016). RAINBIO: A mega-database of tropical African vascular plants distributions. PhytoKeys, 74, 1–18. https://doi.org/10.3897/phytokeys.74.9723
- Díaz, S., Kattge, J., Cornelissen, J. H. C., Wright, I. J., Lavorel, S., Dray, S., Reu, B., Kleyer, M., Wirth, C., Colin Prentice, I., Garnier, E., Bönisch, G., Westoby, M., Poorter, H., Reich, P. B., Moles, A. T., Dickie, J., Gillison, A. N., Zanne, A. E., … Gorné, L. D. (2016). The global spectrum of plant form and function. Nature, 529, 167–117. https://doi.org/10.1038/nature16489
- Dransfield, J. (1986). Flora of tropical East Africa - Palmae. A.A. Balkema.
- Fick, S. E., & Hijmans, R. J. (2017). WorldClim 2: New 1-km spatial resolution climate surfaces for global land areas. International Journal of Climatology, 37, 4302–4315. https://doi.org/10.1002/joc.5086
- Franklin, J. F., Denison, W., McKee, A., Maser, C., Sedell, J., Swanson, F., & Juday, G. (1981). Ecological characteristics of old-growth Douglas-fir forests. USDA Forest Service General Technical Report PNW-118. https://doi.org/10.1017/CBO9781107415324.004
- Freschet, G. T., Dias, A. T. C., Ackerly, D. D., Aerts, R., van Bodegom, P. M., Cornwell, W. K., Dong, M., Kurokawa, H., Liu, G., Onipchenko, V. G., Ordoñez, J. C., Peltzer, D. A., Richardson, S. J., Shidakov, I. I., Soudzilovskaia, N. A., Tao, J., & Cornelissen, J. H. C. (2011). Global to community scale differences in the prevalence of convergent over divergent leaf trait distributions in plant assemblages. Global Ecology and Biogeography, 20, 755–765. https://doi.org/10.1111/j.1466-8238.2011.00651.x
- Friis, I. (2009). The Flora of Ethiopia and Eritrea project concluded with a fourth Flora of Ethiopia and Eritrea-symposium held in Uppsala, Sweden. Webbia, 64, 267–270. https://doi.org/10.1080/00837792.2009.10670862
- Funk, V. (2003). 100 Uses for an Herbarium: Well at least 72. American Society of Plant Taxonomists Newsletter, 17, 17–19.
- GBIF: The Global Biodiversity Information Facility. (2019). What is GBIF? Retrieved from https://www.gbif.org/what-is-gbif
- Gotelli, N. J. (1996). Null models in ecology (G. R. Graves, Ed.). Smithsonian Institution Press.
- Heberling, J. M., & Isaac, B. L. (2017). Herbarium specimens as exaptations: New uses for old collections. American Journal of Botany, 104, 963–965. https://doi.org/10.3732/ajb.1700125
- Heberling, J. M., Prather, L. A., & Tonsor, S. J. (2019). The changing uses of Herbarium Data in an era of global change: An overview using automated content analysis. BioScience, 69, 812–822. https://doi.org/10.1093/biosci/biz094
- Hijmans, R. J., Cameron, S. E., Parra, J. L., Jones, P. G., & Jarvis, A. (2005). Very high resolution interpolated climate surfaces for global land areas. International Journal of Climatology, 25, 1965–1978. https://doi.org/10.1002/joc.1276
- iNaturalist. (2019). iNaturalist. https://www.inaturalist.org
- Kattge, J., Díaz, S., Lavorel, S., Prentice, I. C., Leadley, P., Bönisch, G., Garnier, E., Westoby, M., Reich, P. B., Wright, I. J., Cornelissen, J. H. C., Violle, C., Harrison, S. P., Van Bodegom, P. M., Reichstein, M., Enquist, B. J., Soudzilovskaia, N. A., Ackerly, D. D., Anand, M., … Wirth, C. (2011). TRY - a global database of plant traits. Global Change Biology, 17, 2905–2935. https://doi.org/10.1111/j.1365-2486.2011.02451.x
- Keddy, P. A. (1992). Assembly and response rules: Two goals for predictive community ecology. Journal of Vegetation Science, 3, 157–164. https://doi.org/10.2307/3235676
- Kew. (2019). Plants of the World Online. Retrieved February 27, 2019, from http://www.plantsoftheworldonline.org/
- Kissling, W. D., Balslev, H., Baker, W. J., Dransfield, J., Göldel, B., Lim, J. Y., Onstein, R. E., & Svenning, J.-C. (2019). PalmTraits 1.0, a species-level functional trait database of palms worldwide. Scientific Data, 6, 178–113. https://doi.org/10.1038/s41597-019-0189-0
- Knapp, S., & Boxshall, G. (2010). Biodiversity and systematics: How have we fared in the international year of biodiversity? Systematics and Biodiversity, 8, 419–422. https://doi.org/10.1080/14772000.2010.543008
- Koch, R., Almeida-Cortez, J. S., & Kleinschmit, B. (2017). Revealing areas of high nature conservation importance in a seasonally dry tropical forest in Brazil: Combination of modelled plant diversity hot spots and threat patterns. Journal for Nature Conservation, 35, 24–39. https://doi.org/10.1016/j.jnc.2016.11.004
- Kraft, N. J. B., & Ackerly, D. D. (2010). Functional trait and phylogenetic tests of community assembly across spatial scales in an Amazonian forest. Ecological Monographs, 80, 401–422. https://doi.org/10.1890/09-1672.1
- Lamanna, C., Blonder, B., Violle, C., Kraft, N. J. B., Sandel, B., Šímová, I., Donoghue, J. C., Svenning, J.-C., McGill, B. J., Boyle, B., Buzzard, V., Dolins, S., Jørgensen, P. M., Marcuse-Kubitza, A., Morueta-Holme, N., Peet, R. K., Piel, W. H., Regetz, J., Schildhauer, M., … Enquist, B. J. (2014). Functional trait space and the latitudinal diversity gradient. Proceedings of the National Academy of Sciences of the United States of America, 111, 13745–13750. https://doi.org/10.1073/pnas.1317722111
- Lavoie, C. (2013). Biological collections in an ever changing world: Herbaria as tools for biogeographical and environmental studies. Perspectives in Plant Ecology, Evolution and Systematics, 15, 68–76. https://doi.org/10.1016/j.ppees.2012.10.002
- Lehner, B., & Döll, P. (2004). Development and validation of a global database of lakes, reservoirs and wetlands. Journal of Hydrology, 296, 1–22. https://doi.org/10.1016/j.jhydrol.2004.03.028
- MacArthur, R. H., & Levins, R. (1967). The limiting similarity, convergence, and divergence of coexisting species. The American Naturalist, 101, 377–385. https://doi.org/10.1086/282505
- Maire, V., Wright, I. J., Prentice, I. C., Batjes, N. H., Bhaskar, R., van Bodegom, P. M., Cornwell, W. K., Ellsworth, D., Niinemets, Ü., Ordonez, A., Reich, P. B., & Santiago, L. S. (2015). Global effects of soil and climate on leaf photosynthetic traits and rates. Global Ecology and Biogeography, 24, 706–717. https://doi.org/10.1111/geb.12296
- Marthews, T. R., Dadson, S. J., Lehner, B., Abele, S., & Gedney, N. (2015). High-resolution global topographic index values for use in large-scale hydrological modelling. Hydrology and Earth System Sciences, 19, 91–104. https://doi.org/10.5194/hess-19-91-2015
- Ordoñez, J. C., Van Bodegom, P. M., Witte, J. P. M., Wright, I. J., Reich, P. B., & Aerts, R. (2009). A global study of relationships between leaf traits, climate and soil measures of nutrient fertility. Global Ecology and Biogeography, 18, 137–149. https://doi.org/10.1111/j.1466-8238.2008.00441.x
- Petchey, O. L., & Gaston, K. J. (2006). Functional diversity: Back to basics and looking forward. Ecology Letters, 9, 741–758. https://doi.org/10.1111/j.1461-0248.2006.00924.x
- Phillips, S. J., Anderson, R. P., & Schapire, R. E. (2006). Maximum entropy modeling of species geographic distributions. Ecological Modelling, 190, 231–259. https://doi.org/10.1016/j.ecolmodel.2005.03.026
- Phillips, S. J., Dudík, M., Elith, J., Graham, C. H., Lehmann, A., Leathwick, J., & Ferrier, S. (2009). Sample selection bias and presence-only distribution models: Implications for background and pseudo-absence data. Ecological Applications, 19, 181–197. https://doi.org/10.1890/07-2153.1
- Ricklefs, R. E. (2004). A comprehensive framework for global patterns in biodiversity. Ecology Letters, 7, 1–15. https://doi.org/10.1046/j.1461-0248.2003.00554.x
- Ricklefs, R. E., & Travis, J. (1980). A morphological approach to the study of avian community organization. The Auk, 97, 321–338.
- Ricotta, C. (2005). Through the jungle of biological diversity. Acta Biotheoretica, 53, 29–38. https://doi.org/10.1007/s10441-005-7001-6
- Senay, S. D., Worner, S. P., & Ikeda, T. (2013). Novel three-step pseudo-absence selection technique for improved species distribution modelling. PloS One, 8, e71218. https://doi.org/10.1371/journal.pone.0071218
- Sosef, M. S. M., Dauby, G., Blach-Overgaard, A., van der Burgt, X., Catarino, L., Damen, T., Deblauwe, V., Dessein, S., Dransfield, J., Droissart, V., Duarte, M. C., Engledow, H., Fadeur, G., Figueira, R., Gereau, R. E., Hardy, O. J., Harris, D. J., de Heij, J., Janssens, S., … Couvreur, T. L. P. (2017). Exploring the floristic diversity of tropical Africa. BMC Biol, 15, 15. https://doi.org/10.1186/s12915-017-0356-8
- Swenson, N. G. (2014). Functional and phylogenetic ecology in R. Springer. Springer International Publishing. https://doi.org/10.1007/978-1-4614-9542-0
- Swenson, N. G., Enquist, B. J., Pither, J., Kerkhoff, A. J., Boyle, B., Weiser, M. D., Elser, J. J., Fagan, W. F., Forero-Montaña, J., Fyllas, N., Kraft, N. J. B., Lake, J. K., Moles, A. T., Patiño, S., Phillips, O. L., Price, C. A., Reich, P. B., Quesada, C. A., Stegen, J. C., … Nolting, K. M. (2012). The biogeography and filtering of woody plant functional diversity in North and South America. Global Ecology and Biogeography, 21, 798–808. https://doi.org/10.1111/j.1466-8238.2011.00727.x
- Syfert, M. M., Smith, M. J., & Coomes, D. A. (2013). The effects of sampling bias and model complexity on the predictive performance of MaxEnt species distribution models. PLoS One, 8, e55158. https://doi.org/10.1371/journal.pone.0055158
- Thiselton-Dyer, W. T. (1900). Flora Capensis being a systematic description of the plants of the Cape Colony, Caffraria & Port Natal. Volume VII. Pontederiaceae to Gramineae. London: Reeve and Co. https://www.biodiversitylibrary.org/item/95488#page/2/mode/1up
- Van Proosdij, A. S. J., Raes, N., Wieringa, J. J., & Sosef, M. S. M. (2016). Unequal contribution of widespread and narrow-ranged species to botanical diversity patterns. PLoS One, 11, e0169200. https://doi.org/10.1371/journal.pone.0169200
- Villéger, S., Mason, N. W. H., & Mouillot, D. (2008). New multidimensional functional diversity indices for a multifaceted framework in functional ecology. Ecology, 89, 2290–2301. https://doi.org/10.1890/07-1206.1
- Wang, R., Yu, G., He, N., Wang, Q., Zhao, N., & Xu, Z. (2016). Latitudinal variation of leaf morphological traits from species to communities along a forest transect in eastern China. Journal of Geographical Sciences, 26, 15–26. https://doi.org/10.1007/s11442-016-1251-x
- Weigelt, P., König, C., & Kreft, H. (2020). GIFT – A Global Inventory of Floras and Traits for macroecology and biogeography. Journal of Biogeography, 47, 16–43. https://doi.org/10.1111/jbi.13623
- Westoby, M. (1998). A leaf-height-seed (LHS) plant ecology strategy scheme. Plant and Soil, 199, 213–227. https://doi.org/10.1023/A:1004327224729
- Westoby, M., Falster, D. S., Moles, A. T., Vesk, P. A., & Wright, I. J. (2002). Plant ecological strategies: Some Leading Dimensions of Variation Between Species. Annual Review of Ecology and Systematics, 33, 125–159. https://doi.org/10.1146/annurev.ecolsys.33.010802.150452
- Wesuls, D., Strohbach, M., Horn, A., & Poschold, P. (2010). Plant functional traits and types as a tool to analyse impacts on vegetation. In U. Schmiedel and N. Jürgens (Ed.), Biodiversity in southern Africa (Vol. 2, pp. 222–232). Klaus Hess.
- Wright, I. J., Reich, P. B., Westoby, M., Ackerly, D. D., Baruch, Z., Bongers, F., Cavender-Bares, J., Chapin, T., Cornelissen, J. H. C., Diemer, M., Flexas, J., Garnier, E., Groom, P. K., Gulias, J., Hikosaka, K., Lamont, B. B., Lee, T., Lee, W., Lusk, C., … Villar, R. (2004). The worldwide leaf economics spectrum. Nature, 428, 821–827. https://doi.org/10.1038/nature02403