
Abstract
The role of geomorphological features as drivers for benthic deep-sea biodiversity remains poorly understood. By disentangling the putative Haploniscus belyaevi Birstein, Citation1963a species complex from the abysso-hadal Kuril-Kamchatka Trench (KKT) region in the North-west Pacific Ocean, we aim to shed light on deep-sea differentiation and how it is related to potential bathymetric barriers such as the KKT and the Kuril-Island Ridge (KIR). Our integrative taxonomic approach featured morphological and molecular delimitation methods, also considering the post-marsupial development due to pronounced sexual dimorphism. Mitochondrial 16S and COI markers were sequenced and several molecular species delimitation methods were applied. By combining the different results we were able to delineate six distinct species within the belyaevi complex, including several morphologically cryptic species, and found hints of three additional species groups in the complex. Even though several of these species were distributed across the KKT and/or KIR, limited gene flow and depth-differentiation were indicated supporting previous notions that these geomorphological features play a role in deep-sea benthos speciation.
Introduction
The deep-sea benthos supports a remarkable diversity of invertebrates, with isopod crustaceans being a particularly species-rich and abundant taxon (e.g., Brandt et al., Citation2019; Brix et al., Citation2018). To date, the underlying factors that have historically shaped this diversity and the role of important geomorphological features such as trenches and ridges are not well understood. Studying the phylogeography of deep-sea taxa is hampered by the availability of few datasets of sufficient size to allow an appropriate study design in terms of geographic coverage and number of conspecifics (Taylor & Roterman, Citation2017). In addition, taxonomic uncertainty is a major problem when it comes to deep-sea specimens, as most deep-sea species are not taxonomically described (Mora et al., Citation2011) and formally recognized species often turn out to actually be complexes of several previously overlooked species when studied genetically (e.g., Brix et al., Citation2015; Daníelsdóttir et al., Citation2008; Goffredi et al., Citation2003).
Species complexes pose a challenge for the biogeography and the estimation of marine biodiversity. Often entailing morphologically highly similar or even cryptic species they may cause biodiversity underestimation in the context of classical evaluations of species richness or evenness (Vrijenhoek, Citation2009). Delimiting marine species complexes can be further complicated by phenotypic plasticity, for example in the form of complex lifestyles or sexual dimorphism (e.g., Riehl et al., Citation2012; Vrijenhoek, Citation2009). Because species serve as evolutionary units, accurate species delimitation is essential as a basis of any phylogeographic study (Pante et al., Citation2015). However, species complexes also bear the potential to unravel deep-sea evolutionary mechanisms (Knowlton, Citation1993; Mayr, Citation1963). Phylogeographic patterns of species complexes can provide valuable insights into how environmental factors, such as depth and geomorphology, have impacts on deep-sea speciation (Silva et al., Citation2021). Herein lies a great potential and significant opportunity to improve our understanding of evolution in the deep oceans and, thus, the origins of deep-sea biodiversity (Taylor & Roterman, Citation2017).
Since 2012, a series of three expeditions to the deep North-west Pacific (NWP) have surveyed the fauna of the wider Kuril-Kamchatka Trench (KKT) region, including the NWP Abyssal Plain, the KKT itself, the Kuril Basin of the Sea of Okhotsk (SO), and the bathyal Bussol Strait and adjacent slope regions of the Kuril-Island Ridge (KIR) (Brandt et al., Citation2020). The objectives of these campaigns included the inventory of the deep-sea benthic fauna and the investigation of potential barrier effects of the large-scale bathymetric features of the KIR and KKT using a standardized gear set (Brandt et al., Citation2020).
Among the samples from the NWP, a species complex of Haploniscidae Hansen, Citation1916 (Crustacea: Isopoda) has been identified (Johannsen et al., Citation2020) comprising Haploniscus belyaevi Birstein, Citation1963a and five additional morphologically highly similar groups. The proposed H. belyaevi species complex (henceforward called belyaevi complex) is particularly promising to disentangle the influence of environmental factors on its phylogeography because it was highly abundant in the samples and widely distributed in the greater KKT region (Johannsen et al., Citation2020). It occurred from the SO in the north to the North-west Pacific Abyssal Plain in the south, across a subduction zone with a complex seafloor geomorphology (including trench and ridge) and three biogeographic provinces (see Watling et al., Citation2013). Within this geographic range the belyaevi complex occurred in samples from depths covering the abyssal and hadal zones of the benthos (see Johannsen et al., Citation2020) rendering the belyaevi complex a particularly good model taxon to study deep-sea diversification. Diagnostic (morphological/genetic/genomic) differences between sister species occurring in neighbouring biogeographic provinces commonly indicate interspecific concordance between biogeography and phylogeography; in cases where individual species are distributed across two or more biogeographic provinces – as in the case of the belyaevi complex – shifts in genotype frequencies or significant levels of differentiation often align with biogeographic boundaries, providing intraspecific concordance between biogeography and phylogeography (Bowen et al., Citation2016). Likewise, depth-dependent inter-species divergence and intraspecific differentiation have been frequently observed in deep-sea taxa (e.g., Havermans et al., Citation2013; Jennings et al., Citation2013; Riehl et al., Citation2018), pointing towards depth as a major evolutionary factor (see also McCallum & Riehl, Citation2020). Hence, species complexes occurring in border regions of biogeographic provinces and at various depths, such as the belyaevi complex, are of major interest to investigate patterns of differentiation and to pinpoint the factors responsible for limiting gene flow.
The belyaevi complex furthermore represents a suitable model taxon because as benthic brooders and without adaptations to long-distance dispersal (Brix et al., Citation2020), haploniscids should be especially substrate-bound and, thus, their dispersal and gene flow should be affected by habitat patchiness and discontinuity (see S. Bober et al., Citation2018). With diversity-regulating processes differing at local, regional, and global scales, the impact of these processes on the marine fauna varies depending on their dispersibility (Bowen et al., Citation2016; Brandt et al., Citation2004). In places with strong bathymetric gradients and varying slope angles, such as the wider KKT region, sediment coverage varies significantly (e.g., Niedzielski et al., Citation2013; Riehl et al., Citation2020). This can result in a mosaic-like pattern of sedimented (soft substrate) and rocky (hard substrate) habitats, each with its specialized benthic fauna. Such interruptions of suitable habitats should furthermore reduce dispersal in sediment-dwelling organisms, such as haploniscids, and may therefore promote population differentiation in these organisms (Riehl et al., Citation2020).
The primary goal of this work was to corroborate the hypothesis that Haploniscus belyaevi sensu Johannsen et al. (Citation2020) comprises a complex of multiple, closely related species. This was accomplished by applying the taxonomic feedback loop, first independently scrutinizing morphological ontogenetic development, molecular phylogenetics, biogeography and DNA-based species delimitation and then synthesizing the results. The species delimitation represents the essential first step to disentangle the effects of depth and geomorphological barriers on diversification.
Then, by relating biogeographic with phylogenetic patterns, the second goal was to study historic differentiation across biogeographic borders, depth strata and large geomorphological features to infer their potential effects on benthic speciation. It was expected that across these aforementioned barriers both intraspecific differentiation as well as interspecific divergence would become apparent. Providing a first indication that these factors indeed promote speciation in the belyaevi complex, this study opens up new possibilities for future population-genetic and phylogeographic investigations on the NWP deep-sea haploniscids and provides the foundation for proper taxonomic descriptions of the species of the belyaevi complex.
Materials and methods
Study area, sampling handling, and specimen treatment
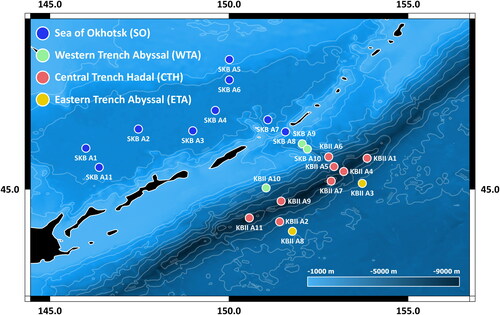
All samples analysed in this study were collected in the greater Kuril-Kamchatka Trench (KKT) region of the North-west Pacific Ocean (NWP) and its marginal Sea of Okhotsk (SO). To the north-west of the KKT, the KIR separates the NWP from the adjacent SO and its Kuril Basin (3,374 m max. depth). However, several bathyal straits, of which the Bussol Strait (2,350 m sill depth) and the Krusenstern Strait (1,920 m sill depth) are the deepest, allow for exchange of water and potentially also deep-sea fauna between the KKT and the SO (Malyutina et al., Citation2018; Tyler, Citation2002). Both the KKT and the KIR might represent barriers hard to overcome for deep-sea species (e.g., J. Bober et al., Citation2019; Johannsen et al., Citation2020) as they also divide the KKT region into the following biogeographic provinces as defined by Watling et al. (Citation2013): (i) the Aleutian-Japan hadal province, restricted to the KKT; (ii) the Northern Pacific Boreal province, represented by the SO; and (iii) the North Pacific province, comprising vast NWP abyssal plains. Furthermore, for a preliminary biogeographic analysis, the greater KKT region has been divided into four geographic zones (SO = Sea of Okhotsk, WTA = West Trench Abyssal, CTH = Central Trench Hadal, ETA = East Trench Abyssal) based on the biogeographic provinces defined by Watling et al. (Citation2013) but with further adjustments proposed by Johannsen et al. (Citation2020) to include local bathymetric characteristics (). All maps of the KKT region were created using QGIS 3.10.1 with GRASS 7.8.1 (GRASS Development Team, Citation2020; QGIS.org, Citation2020).
Fig. 1. Sampling area map (Kuril-Kamchatka Trench region). Overview of sampling areas of the KuramBio II (KBII) and SokhoBio (SKB) expeditions in the greater Kuril-Kamchatka Trench region of the North-west Pacific, divided into four different geographic zones following Johannsen et al. (Citation2020).
Collecting was done during the SokhoBio (Sea of Okhotsk Biodiversity Studies, Malyutina et al., Citation2015) campaign on board the RV Akademik M.A. Lavrentyev in 2015 and the KuramBio II (Kuril Kamchatka Biodiversity Studies II, Brandt, Citation2016) campaign on board RV Sonne. All samples we refer to were collected with a box corer (BC), an Agassiz trawl (AGT), and two types of epibenthic sledges (Brandt et al., Citation2013; Brenke, Citation2005; see Supplemental Table S1 for station data). Collected sediment was sieved using 300 µm-meshed metal sieves and filtered with −20 °C precooled, filtered seawater to remove fine sediment fractions. To preserve the specimens for genetic studies all samples were bulk-fixed in chilled 96% ethanol and kept chilled at all times following Riehl et al. (Citation2014). Using a stereomicroscope Leica M60, all available haploniscid specimens were sorted into taxonomic groups up to species level by phenotypic clustering.
Table 1. 16S and COI intracluster p-distances. Intraspecific variation (mean uncorrected p-distances and range in brackets) within each genotypic cluster for the 16S and the COI gene respectively. N/A denotes cases in which calculation of p-distance was not possible due to low sequence counts.
Voucher specimens for molecular analysis were selected during the sorting procedure to represent the entire variability of haploniscid phenotypic clusters (see below) and cover their largest possible geographic distribution; they were stored in individual cryovials containing 96% ethanol.
All voucher specimens have been photographed using a Leica M125 C stereomicroscope equipped with a Leica DMC 4500 camera and are part of a working collection at the Senckenberg Museum in Frankfurt, Germany (SGN). All material will be deposited at SGN and the Zoological Museum Hamburg, Germany in the course of future taxonomic studies (see Supplemental Table S2). DNA sequencing reads and contig sequences were registered in the Barcode of Life Data System (BoLD System, Ratnasingham & Hebert, Citation2007), available at dx.doi.org/10.5883/DS-NWPHA22, together with voucher photographs and sampling metadata. From there, sequence data were uploaded to GenBank (Benson et al., Citation2013), accession numbers OM782497 to OM782662. Locality data were uploaded to the Ocean Biogeographic Information System (OBIS, Grassle, Citation2000), available at https://ipt.iobis.org/obis-deepsea/resource?r=deep-sea_haploniscid_isopods. All alignments and primary phylogenetic trees were registered in Zenodo (European Organization For Nuclear Research & OpenAIRE, Citation2013) available at http://doi.org/10.5281/zenodo.6553796.
Table 2. 16S and COI intercluster p-distances. Mean uncorrected p-distances between each genotypic cluster of the H. belyaevi species complex and other species of the genus Haploniscus for 16S (below diagonal) and COI data (above diagonal) respectively, representing mean interspecific divergence. N/A denotes cases in which calculation of p-distance was not possible due to the unavailability of molecular sequences for certain clusters and the respective gene.
Taxonomic feedback loop
To corroborate the stated primary hypothesis, morphological and molecular evidence was scrutinized with focus on the belyaevi complex using a taxonomic feedback loop (Page et al., Citation2005), a process also referred to as reciprocal illumination (Hennig, Citation1965). As a first step, phenotypic clusters among the belyaevi complex were identified by morphological similarity using diagnostic characters extracted from the literature and reconstructing the post-marsupial development. In the second step, congruence between genotypic and phenotypic clusters was searched for using two standard mitochondrial markers (16S, COI). Finally, operational criteria derived from the phylogenetic species concept (PSC) introduced by Eldredge and Cracraft (Citation1980) and the unified species concept (USC) introduced by De Queiroz (Citation2007) were applied, synthesizing morphological, molecular, and biogeographic information to determine species identities. The USC renders all properties treated as secondary species criteria in other species concepts relevant to species delimitation to the extent that they provide evidence of lineage separation.
Morphological species delimitation and identification
All available haploniscid isopods from the NWP were analysed morphologically, with a focus on the six phenotypic clusters of the Haploniscus belyaevi species complex identified by Johannsen et al. (Citation2020) delineating species also considering their phenotypic plasticity. For identification of the species, original taxonomic literature (Birstein, Citation1963a, Citation1963b, Citation1971) and type material housed at the Zoological Museum of Moscow Lomonosov State University (MSU) were consulted. This approach allowed the inclusion of further previously overlooked members of the species complex.
First, to resolve phenotypic plasticity and stage-dependent sexual dimorphism, specimens were allocated to ontogenetic stages, following the nomenclature and characters used by Brökeland (Citation2010b). Staging was based on developing morphological character states, like those of pereonite 7 and pereopods VII as well as male pleopods I and II. In this study, the terms ‘ontogenetic stage’ and ‘instar’ are distinguished from each other: An ontogenetic stage includes all specimens that share a certain combination of unique morphological character states that undergo developmental changes when transitioning into another such stage; an instar refers to a certain moult that may occur either within or between ontogenetic stages – it is distinguishable from other instars primarily by differences in body length. Body length measurements were taken by sketch-drawing the specimens laterally under a Leica M60 microscope with camera lucida and using a micrometer for calibration. Digitalized drawings were measured from the tip of the rostrum to the tip of the posterolateral pleotelson processes under consideration of potential body curvature using the measuring tool of Adobe Acrobat Reader. The relative length of the posterolateral protrusions was calculated as the posterolateral protrusion length (posterolateral protrusion tip to posterior pleotelson apex) divided by the total pleotelson length (posterolateral protrusion tip to posterior margin of pereonite 7).
Confocal Laser Scanning Microscopy (CLSM) was used as a non-destructive alternative to scanning electron microscopy to study detailed morphological differences between phenotypic clusters and ontogenetic stages. The ventral pleotelson was scanned for every available ontogenetic stage of each phenotypic cluster and dorsal habitus scans were additionally taken for the adult male stage. Specimens were chosen on the premise that molecular data were available, and least damaged specimens were preferred. Single specimens of each available ontogenetic stage (see Supplemental Table S3) were transferred into glycerine and simultaneously stained using Congo red dissolved in 70% denatured ethanol following Michels and Büntzow (Citation2010). The specimens were incubated for 3 days under dark conditions to allow the ethanol to evaporate slowly to avoid shrinking. Afterwards, the specimens were placed on temporary slides following the technique established by Michels and Büntzow (Citation2010) with slight modifications. Given the large size of the specimens, sealing rings with quadrate cross-section were extracted from cryovial lids and used as spacer. For fixation of these rings and coverslips (No. 1.5, 170 µm) clear nail polish was used. Scans were conducted using a Leica DM2500 with a Leica TCS SPE II and the LEICA LAS X 3.5.5.19976 software at a resolution of 2480 × 2480 pixels (see Supplemental Table S4). Fiji ImageJ 1.52p (Schindelin et al., Citation2012; Schneider et al., Citation2012) was used for initial post-production, Adobe Photoshop CC 2019 20.0.3 and Adobe Illustrator CC 2019 23.0.2 were used for final adjustments. Panorama Stitcher Mini version 1.1.0 (Boltnev & Kacher, Citation2010) and the Image Composite Editor (ICE) version 2.0.3.0 (Microsoft Corporation, Citation2015) were used for photo stitching.
DNA extraction, sequencing, and alignment
For DNA extraction up to four pereopods were dissected from each specimen and were transferred from ethanol to 20 µl PVP (© LGC Genomics) buffer and stored at −20 °C. To prevent contamination with foreign DNA preparation tools were heat-sterilized and preparation dishes bleached and cleaned. In total, 149 specimens of the hypothesized belyaevi complex were selected for molecular analysis (Supplemental Table S2), alongside 139 additional samples of other haploniscid taxa from the KKT region.
For molecular analyses (i) the (partial) mitochondrial large ribosomal RNA subunit (16S) and (ii) the (partial) cytochrome-c-oxidase subunit I (COI) were used following principal directions provided by Riehl et al. (Citation2014). The PCR and subsequent Sanger DNA sequencing (Sanger et al., Citation1977) were conducted at LGC Genomics Germany, Berlin. The chosen primers for the 16S gene were 16S SF and SR, while the dgLCO1490 and dgHCO2198 primers were used for the COI gene fragment (see Supplemental Table S5). Assembly, trimming and multiple sequence alignments were performed in Geneious 9.1.8 (https://www.geneious.com). The Geneious plug-in MAFFT v7.308 (Katoh et al., Citation2002; Katoh & Standley, Citation2013) was employed for multiple sequence alignment with the settings L-INS-i, 200PAM/k = 2, 1.53 gap open penalty and 0.123 offset. Multiple sequence alignments were visually quality controlled and, in the case of COI, checked for stop codons using the amino-acid translation (invertebrate mitochondrial). The aligned datasets were concatenated using the appropriate function in Geneious.
Sequences of the isopod families Desmosomatidae Sars, Citation1899, Macrostylidae Hansen, Citation1916 and Munnopsidae Lilljeborg, Citation1864 from GenBank were used as outgroup (see Supplemental Table S6).
Molecular species delimitation
To delineate genotypic clusters (i.e., genetically distinct groups with few or no intermediates to other such groups; Mallet, Citation1995) within the hypothesized belyaevi complex, the distance-based “Assemble Species by Automatic Partitioning” (ASAP; Puillandre et al., Citation2021) and the tree-based bPTP (Zhang et al., Citation2013) were used via their respective web tools. For the ASAP web tool, which clusters molecular sequences into distinct groups by applying different thresholds over multiple partitions, 16S and COI were analysed separately and the best-suited models were selected based on their ASAP score and number of delineated species in comparison to other performed methods of species delimitation (Supplemental Figs S1 and S2). Thresholds for molecular distance-based species delimitation from previous studies on haploniscids (see Brix et al., Citation2011; Brökeland & Raupach, Citation2008), related isopods (S. Bober et al., Citation2018; Brix et al., Citation2011, Citation2015; Brökeland & Raupach, Citation2008; Riehl & Kühn, Citation2020) as well as universal thresholds (Hebert et al., Citation2003) were used as orientation, well aware that any published threshold between intraspecific variability and interspecific divergence is somewhat arbitrary (hence the use of ASAP; Puillandre et al., Citation2021).
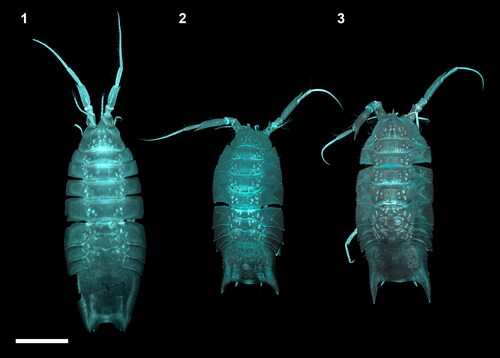
Fig. 2. CLSM images of adult males within the Haploniscus belyaevi species complex. Dorsal habitus CLSM scans of copulatory males from three different phenotypic clusters within the H. belyaevi species complex: H. ‘KKT’ (KBII Hap165 (1)), H. ‘SO’ (SKB Hap06 (2)), and H. aff. belyaevi (SKB Hap54 (3)).
We analysed the concatenated tree in the bPTP web tool, which models branching events based on the number of mutations to distinguish sequence clusters, and focused on the maximum likelihood results (mPTP).
For graphically differentiating between intraspecific variability and interspecific divergence and the resulting barcoding gap, histograms were produced with Microsoft Excel, using a randomly chosen representative for each phenotypic cluster (SKB Hap50, KBII Hap201, and SKB Hap20) as comparison with all other sequences. For this purpose, matrices of pairwise distances were calculated separately for 16S and COI alignment in MEGA-X 10.1.18 (Kumar et al., Citation2018).
TCS haplo-networks confined to specimens of the belyaevi complex and another closely related species were calculated for each of the 16S and COI alignments respectively using the software PopART 1.7 (Clement et al., Citation2002; Leigh & Bryant, Citation2015). A geotag including sampling area and region data was given to each analysed sequence to identify potential biogeographic patterns. Phylogenetic analyses were performed in IQTree 2.0.6 for all three alignments (Minh et al., Citation2020), further utilizing partition models in the case of the COI- and the concatenated alignment (Chernomor et al., Citation2016). For the latter, three independent partitions were analysed: the 16S gene fragment (partition 1), the COI first and second codon positions (partition 2) and COI third codon position (partition 3), to accommodate for different mutation rates. The resulting phylogenetic trees were illustrated using Interactive Tree of Life 5.6.2 (iTOL, Letunic & Bork, Citation2007). The statistical support for each node was evaluated based on the thresholds proposed in Hillis and Bull (Citation1993): bootstrap (bt) values exceeding 90 indicated high support (herein also called “strong”), while bt values of 70–89 were considered well-supported. Weak support was assigned to 50–69, and bt values below 50 did not indicate any support.
Results
Morphological species delimitation
The haploniscid samples from the two recent expeditions in the NWP allowed for the discrimination of eight phenotypic clusters belonging to the genus Haploniscus, two phenotypic clusters of Hydroniscus and three Mastigoniscus clusters (Supplemental Table S2). While five of these are considered to represent undescribed species, the remaining eight clusters could be allocated to known haploniscid species from the NWP based on the available original taxonomic literature (Birstein, Citation1963a, Citation1963b, Citation1971). These known species comprise Haploniscus gibbernasutus Birstein, Citation1971, H. hydroniscoides Birstein, Citation1963a, H. menziesi Birstein, Citation1963a, H. profundicolus Birstein, Citation1971, H. ultraabyssalis Birstein, Citation1963b, Hydroniscus minutus Birstein, Citation1971, Hydr. vitjazi Birstein, Citation1963a, and Mastigoniscus latus (Birstein, Citation1971).
Investigations of the MSU collection material revealed severe mismatches between the original species description and the presumed type material of Haploniscus belyaevi. The latter comprised multiple haploniscid species of which none could be allocated to H. belyaevi as they did not match the original description (including illustration), and the exact syntype depicted in the original species description was missing. The available type material furthermore stems from a sampling station which does not align with the station data listed in the original description. As the whereabouts of the actual type specimens are currently unknown to the authors and could not be clarified upon request by the responsible institution’s collection personnel it has to be assumed that the actual syntypes of H. belyaevi have been lost. Accordingly, the identification of H. belyaevi was based solely on the original description text and illustrations (Birstein, Citation1963a).
With the aid of original literature regarding H. belyaevi, initially three phenotypic clusters were differentiated among the material from recent expeditions that together form the belyaevi complex. All three phenotypic clusters shared two antennal spines, which were located on the antennal third (basis) and fifth peduncular articles (merus) respectively. It was found that the spine on the third article is located dorsally and has a blunt, triangular shape, while the spine on the fifth article is located distodorsally and had an acute, elongate shape. Further, all detected phenotypic clusters shared an acute rostrum, yet the orientation of the rostrum varied between clusters. These clusters differed especially with regard to character states showing pronounced sexual dimorphism in adult male specimens. The first phenotypic cluster was provisionally named Haploniscus ‘KKT’ after its main distribution in the Kuril-Kamchatka Trench. Morphological characters distinguishing H. ‘KKT’ from the other two phenotypic clusters among the recently collected material and the original H. belyaevi description included posterior extensions of the pleotelson posterior margin in subadult and adult males, dorsally “roofing” the uropods (), and an anteriorly oriented rostrum with antero-dorsally pointing tip. Additionally, the lateral pleotelson outlines were straight while the pleotelson was narrowing posteriorly. Within this cluster, variation in the length of the antennal distodorsal spine of the fifth article was found. Further, the basis of the rostrum showed varying levels of expression of a dorsal bulge. A re-examination of H. ‘KKT’ following the detection of multiple distinct genotypic clades within this phenotypic cluster (see below) revealed that hadal specimens lacked this dorsal bulge at the basis of the rostrum, as opposed to abyssal specimens. Also, the posterior pleotelson extensions were more pronounced in hadal than in abyssal specimens (data not shown). Accordingly, H. ‘KKT’ could be subdivided into the clusters H. ‘KKT abyssal’ and H. ‘KKT hadal’ based on their depth distribution (see below).
The second phenotypic cluster, provisionally named Haploniscus ‘SO’ after its main region of occurrence in the Sea of Okhotsk, was distinguishable from H. ‘KKT’ solely by the shape of the pleotelson and its posterolateral protrusions. While the lateral pleotelson outline was straight anteriorly, it was convex posteriorly with longer protrusions than in H. ‘KKT’, also featuring a peculiar laterally curved appearance. Overall, the shape of the entire pleotelson was square rather than tapering in this cluster, which was especially apparent in adult male specimens (). Rostral morphology of H. ‘SO’ did not vary from that of H. ‘KKT’.
The third phenotypic cluster was identified as Haploniscus aff. belyaevi as it matched the original species description and illustration of H. belyaevi. However, H. aff. belyaevi solely occurred in the Kuril Basin of the SO and did not occur south of the KIR, where H. belyaevi had been originally recorded (CTH, ETA, WTA) as inferred from the original species description (Birstein, Citation1963a). An unequivocal identification was not possible because of the missing type material. It differed from the before-mentioned phenotypic clusters in the shape of the rostrum and the posterolateral pleotelson protrusions. H. aff. belyaevi had an acute rostrum with an anterior orientation. Over their ontogenetic development, the posterolateral protrusions of the pleotelson reached a longer relative length (0–0.52 pleotelson length) than in the other two clusters (0–0.2 in H. ‘KKT’ and 0–0.26 in H. ‘SO’), which was particularly noticeable in the adult males (). Thus, the pleotelson appeared somewhat square rather than tapering in this cluster as well, which was, again, more pronounced in adult male specimens.
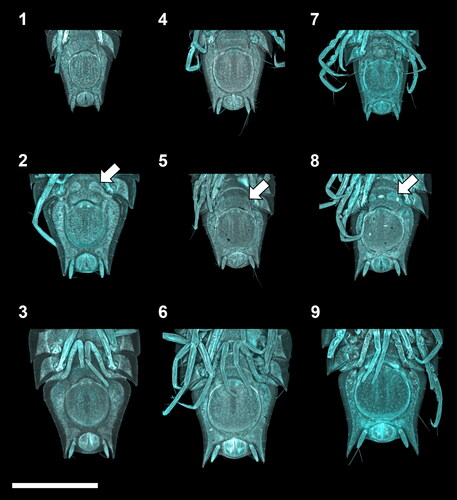
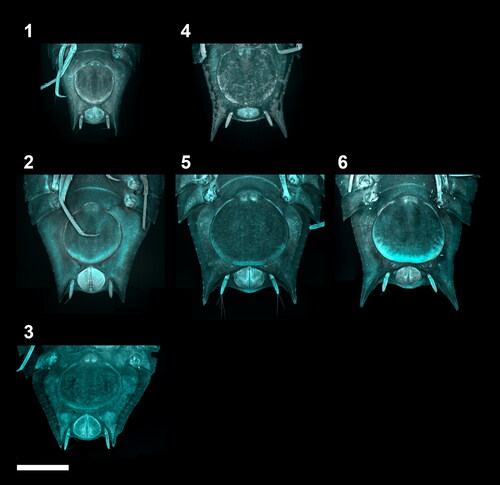
Fig. 3. Ontogenetic development of the manca stages of the Haploniscus belyaevi species complex. Ventral pleotelson CLSM-scans of three different phenotypic clusters H. ‘KKT’ (KBII Hap227 (1), KBII Hap234 (2), KBII Hap107 (3)), H. ‘SO’ (SKB Hap45 (4), SKB Hap12 (5), SKB Hap39 (6)) and H. aff. belyaevi (SKB Hap09 (7), SKB Hap30 (8), SKB Hap52 (9)) across the three successive ontogenetic stages: manca I (1, 4, 7), manca II (2, 5, 8) and manca III (3, 6, 9). Arrows on manca II specimens indicate the subcuticular anlagen of the developing seventh pereopods.
Reconstruction of post-marsupial development
Ontogenetic reconstruction of the three phenotypic clusters resulted in the identification of three manca stages (manca I–III, ), three male stages (juvenile ♂ IV, preparatory ♂ V, and copulatory ♂ VI, ), and two female stages (preparatory ♀ IV, ovigerous ♀ V, ). A whole set of these ontogenetic stages was only present for H. ‘KKT’, while samples of H. ‘SO’ and H. aff. belyaevi lacked two and three stages, respectively. Whether these stages are non-existent or rather unsampled remains unresolved. Several morphological characters were identified that help distinguishing between ontogenetic stages, regardless of the morphological variation between the three phenotypic clusters (see Supplemental Fig. S1).
Fig. 4. Ontogenetic development of the adult male stages of the Haploniscus belyaevi species complex. Ventral pleotelson CLSM-scans of three different phenotypic clusters H. ‘KKT’ (KBII Hap119 (1), KBII Hap216 (2), KBII Hap165 (3)), H. ‘SO’ (SKB Hap19 (4), SKB Hap06 (5)) and H. aff. belyaevi (SKB Hap54 (6)) across the three successive ontogenetic stages: juvenile male IV (1, 4), preparatory male V (2) and copulatory male VI (3, 5, 6).
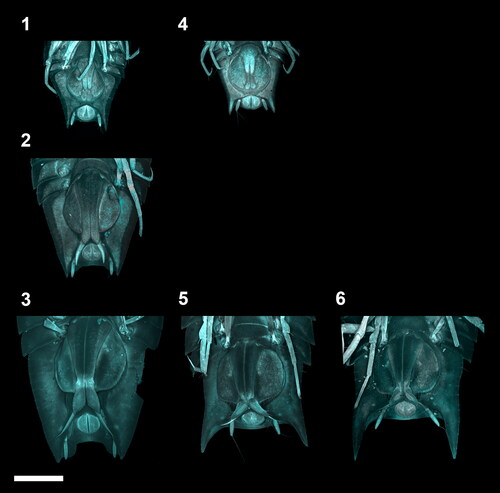
Fig. 5. Ontogenetic development of the adult female stages of the Haploniscus belyaevi species complex. Ventral pleotelson CLSM-scans of three different phenotypic clusters H. ‘KKT’ (KBII Hap123 (1), KBII Hap219 (2), KBII Hap118 (3)), H. ‘SO’ (SKB Hap41 (4), SKB Hap23 (5)) and H. aff. belyaevi (SKB Hap50 (6)) across the three successive ontogenetic stages: preparatory female IV early instar (1, 4), preparatory female IV late instar (2, 5, 6) and ovigerous female V (3). The female IV stage is depicted twice to compare specimens of its first and last instar. Depicted differences in shape and size between these instars are the result of a gradual development over multiple moults that did not justify the erection of additional stages. The ovigerous female V specimen of H. ‘KKT’ could not be scanned in a standardized view without the risk of damaging the specimen due to a pronounced body curvature.
The manca I stage was recognizable by the absence of the seventh pereonite and pereopods (, and ). During the manca II stage the anlagen of the seventh pereopods developed beneath the cuticle of the anteroventral pleotelson (, and ). In the manca III stage the seventh pereopods have emerged and are incompletely developed. They adopted a position close to the medioventral body with merus through dactylus paired up, apparently bearing no locomotive function yet. Also, the setation of these limbs was absent or not yet fully developed in this stage. The seventh pereonite was incompletely developed in this stage as well, with the tergites having a cone-like shape rather than a rectangular shape like all remaining tergites (, and ). All subsequent stages of the males (male IV–VI) were recognizable by the presence of the first pleopods, which first appeared in the juvenile ♂ IV stage, projecting to half the length of the still fused pleopods II ( and ). In the preparatory ♂ V stage, pleopods I projected beyond the now separated pleopods II. Further, the pleopod II endopod (stylet) was visible, extending beyond the posterior margin of the first pleopods (). In the copulatory ♂ VI stage the first pleopods were characterized by distolateral protrusions (lobes) (, and ). In adult females two morphologically different stages were identified: The preparatory ♀ IV stage (, ) was distinguishable from the ovigerous ♀ V stage () by the absence of a marsupium. Instead of gradually developing oostegites with external buds, as in Munnopsidae (Wilson, Citation1981), the haploniscid isopods analysed here must either develop their oostegites in a single moult or carry their developing oostegite anlagen internally, as is the case in Urstylidae (Riehl et al., Citation2014).
Overall, each detected phenotypic cluster is characterized by at least some form of sexual dimorphism. These differences between sexes were particularly pronounced in the pleotelson posterior margin, including enlarged posterolateral outgrowths in males of H. ‘SO’ and H. aff. belyaevi ( and ) and marginal protrusions dorsally covering the male uropods of H. ‘KKT’ (). As opposed to the males, their conspecific females are characterized by smaller outgrowths or the absence of these protrusions respectively (, and ), resulting in a much higher interspecific similarity.
Body length analysis of the ontogenetic stages of the belyaevi complex
Analysing the body-length distribution of all available intact specimens of the three phenotypic clusters H. aff. belyaevi (N = 14), H. ‘SO’ (N = 36) and H. ‘KKT’ (N = 51) revealed similar size ranges for all groups across their entire ontogenies, namely 1.2–4.0 mm, 1.1–4.4 mm and 1.2–4.5 mm respectively (). After molecular analyses detected multiple genotypic clusters within H. ‘SO’ and H. ‘KKT’ (see below) their body-length histograms were subdivided accordingly. Within H. ‘KKT’ the ‘KKT hadal’ group (N = 29) reached larger body sizes than the ‘KKT abyssal’ one (N = 22) in each of the ontogenetic stages, except for the preparatory ♀ IV stage. No size differences became apparent between the three genotypic clusters of H. ‘SO’ (N(SO-KIR)=27; N(SO-SO)=6; N(SO-WTA)=3). Overlaps in body-size ranges between consecutive ontogenetic stages occurred primarily between the first two manca stages of all three clusters (N(manca I)=21; N(manca II)=9) and between the adult female stages of H. ‘KKT’ (N(♀ IV)=11; N(♀ V)=6). The largest size range within the same ontogenetic stage was recorded for the preparatory ♀ IV stage in all phenotypic clusters (N = 25), which also contained the largest specimens of H. ‘SO’. Several ontogenetic stages exhibited at least one gap in their length spectrum, if not multiple, which could indicate the existence of additional instars within each stage. This especially applied to the preparatory ♀ IV stage (N = 25), the manca I stage (N = 21) and, in the case of H. ‘KKT’, to the male VI (N = 9) and ovigerous ♀ V stages (N = 6).
Fig. 6. Ontogenetic body-length frequency of the Haploniscus belyaevi species complex. Bodylength-frequency histograms of ontogenetic stages for three analyzed phenotypic clusters (H. aff. belyaevi, H. ‘KKT’ and H. ‘SO’) and genotypic clusters within. Stages represented include manca I–III, juvenile ♂ IV, preparatory ♂ V, copulatory ♂ VI, preparatory ♀ IV and ovigerous ♀ V.
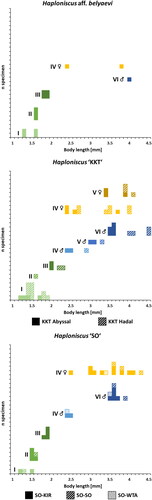
The body-length histograms of multiple stages (manca I, female IV, female V) suggest the existence of different moults within these stages, that could not be differentiated using our approach. An overlap of the size ranges of manca I and manca II specimens, for instance, highlights that either size variation is significant within stages or that the onset of development for certain morphological traits — in this case the subcuticular anlagen of the seventh pereopods — is independent of body size, or there may be a certain degree of flexibility as to the moult in which these morphological traits occur.
Sequencing and alignment results
Altogether, tissue for the extraction of total genomic DNA was dissected from 282 haploniscid specimens. For 16S, 109 out of 166 sequences belong to one of the three phenotypic clusters: H. ‘KKT’ (N = 52), H. ‘SO’ (N = 42), and H. aff. belyaevi (N = 14). Other known haploniscid species present in this dataset were H. hydroniscoides, H. menziesi, H. profundicolus and Hydr. minutus. The genus Mastigoniscus was represented by M. latus and M. sp. 1. Further information regarding the 16S and COI alignments as well as the results of the phylogenetic tree calculation are provided in the Supplemental Table S7.
Out of 131 COI sequences, 72 belong to the species complex of interest, including H. ‘KKT’ (N = 52), H. ‘SO’ (N = 12), and H. aff. belyaevi (N = 8). All haploniscid species and phenotypic clusters from which 16S data were successfully retrieved were also present in the COI dataset, except H. menziesi and H. profundicolus. No stop codons were reported within the translated amino-acid sequence. The amplification of the 16S marker (58.9%) was more successful than the COI marker (46.5%). While sequences of both investigated genes could be acquired for most sampled isopods, some specimens were solely represented by either a 16S or a COI sequence (Supplemental Table S2). The concatenated 16S and COI multiple-sequence alignment contained 186 sequences of which 180 belong to haploniscid isopods and six to outgroup representatives.
Genetic variation and barcode-gap analysis
The histogram of pairwise inter- and intraspecific distances in the 16S alignments depicted a ‘barcoding gap’ separating the belyaevi complex’s phenotypic clusters from each other (). Intraspecific variation within the belyaevi complex was low (H. KKT: 1.3%; H. SO: 2.1%) to absent (H. aff. belyaevi: 0%; ), while interspecific divergence between the clusters of the belyaevi complex ranged between 5.9% and 8.9%, with most other haploniscid species from the KKT region being divergent by more than 17.8% from the belyaevi complex’s clusters (). Haploniscus profundicolus represents the sole exception to this finding, given its close relationship with H. KKT (2% divergence, ), despite not being considered as a potential member of the belyaevi complex initially due to morphological differences.
Fig. 7. Barcoding–gap analysis of the Haploniscus belyaevi species complex. Stacked (i.e., placed on top of each other) histograms contrasting the intraspecific variations of the phenotypic clusters H. aff. belyaevi (SKB Hap50), H. ‘KKT’ (KBII Hap201), H. ‘SO’ (SKB Hap20) with their interspecific divergences (also considering H. profundicolus) based on uncorrected p-distances of the 16S alignment (1) and the COI alignment (2).
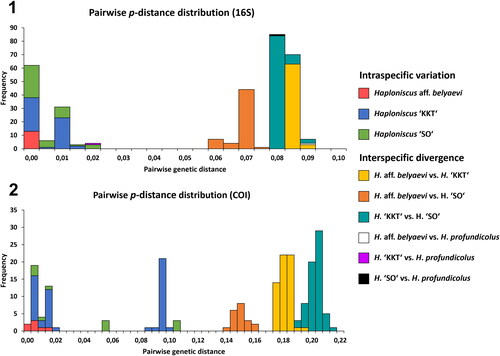
Within the COI dataset, levels of intraspecific variation and interspecific divergence were generally higher and, in many cases, up to twice as high than in the 16S dataset ( and ). Consequently, intraspecific variation within H. ‘KKT’ and H. ‘SO’ reached maximum p-distances of 10.8%, while variation within H. aff. belyaevi remained comparatively low with maximum levels of up to 1.7% (). The interspecific divergence between the clusters of the belyaevi complex ranged between 13.2–21.6% in COI (), while all other haploniscid species were divergent by more than 22% ().
In both markers the intraspecific variation of H. ‘KKT’ was distributed across several discrete peaks, indicating the existence of at least two distinct genotypic clusters at 0.5%, 1.5% and 9.5% divergence (). Similar findings were recorded within H. ‘SO’, whose distribution of variability showed three peaks: between 0.5% and 1.5% (overlapping distributions) and 5.5 as well as 10.5% (discrete, ). In both markers these discontinuities of the variability distribution were due to the same individuals assigned to H. ‘KKT’ and H. ‘SO’.
Combined phylogenetic analysis
The comparison of the two resulting cladograms from the 16S and COI alignments revealed congruent placements for most identified clades within the phylogenetic trees (see ), thus justifying a combined analysis of a concatenated dataset. In both cladograms the family Haploniscidae as well as the three phenotypic clusters of the belyaevi complex were monophyletic. The belyaevi complex was paraphyletic in the 16S-based cladogram as H. profundicolus adopted a sister-group position to a clade comprising H. ‘KKT’ and H. aff. belyaevi while, unfortunately, no COI data for this taxon were available. Incongruent placements of a few branches can be explained by poor or lacking resolution and resulting polytomies ().
The consensus tree of the concatenated 16S-COI multiple-sequence alignments included 180 haploniscid specimens which we divided into nine different monophyletic groups representing (morphologically determined) known haploniscid species from the KKT region as well as the phenotypic clusters differentiated here, forming the ingroup ().
Fig. 8. Consensus phylogenetic tree (16S and COI) of 186 haploniscid isopods. Sequence allocation to distinct clusters based on ASAP and mPTP analyses (white rings) and morphological identity (coloured background) is highlighted. Sequences are genetically clustered based on the results of an ASAP-analysis for the 16S (circle) and COI gene (triangle) as well as a mPTP-analysis (diamond). Shaded ring segments indicate gaps within a cluster due to missing molecular data of the specimens in question for this gene.
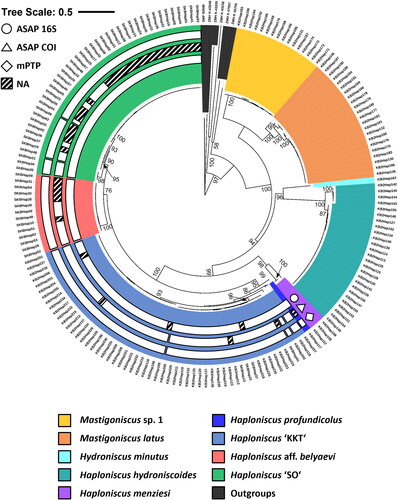
Focusing on the latter, 112 sequences represented the belyaevi complex as well as H. profundicolus, which was placed among the belyaevi complex. Of the belyaevi complex members, H. ‘KKT’ represented the largest clade with 55 specimens. It formed a highly supported sister group (95 bt) to H. profundicolus. Amongst H. ‘KKT’, four highly supported clades can be differentiated, of which a doubleton clade composed of KBII Hap118 and KBII Hap207 (later called HT 14) formed the most basal group. The relationships among the rest of them remained unresolved (bt <50). The two main groups of H. ‘KKT’ were preliminarily named H. ‘KKT abyssal’ (96 bt) and H. ‘KKT hadal’ (93 bt), according to their (main) depth distribution.
The second clade among the belyaevi complex was reasonably well supported (75 bt) and included H. aff. belyaevi (14 specimens; 100 bt) and H. ‘SO’ (42 specimens; 90 bt) (). Among H. aff. belyaevi no distinct clades became apparent due to highly similar terminals. Among H. ‘SO’, however, three highly supported clades stood out that were provisionally named according to their (main) areas of occurrence (H. ‘SO-SO’, H. ‘SO-KIR’, and H. ‘SO-WTA’). While H. ‘SO-WTA’ (98 bt) has the basal position, H. ‘SO-SO’ (95 bt) and H. ‘SO-KIR’ (100 bt) form a highly supported (93 bt) sister-group relationship.
Overall, the phylogenetic analysis of the concatenated dataset resulted in similar topologies but better statistical support for the basal nodes, thus solidifying the distinction of phenotypic clusters.
ASAP and mPTP analyses
The best partition of the ASAP-analysis for the 16S gene (ASAP-16S) as inferred from its ASAP-score (1.00) divided the belyaevi complex into three genotypic clusters, that are in accordance with the phenotypic clusters that form the belyaevi complex (). The sole exception is the lumping of the single H. profundicolus specimen with H. KKT into a single cluster. For the best partition of the COI gene (ASAP-COI; ASAP-score: 2.00) eight groups were delineated. The extra subdivision of genotypic clusters was restricted to H. SO and H. KKT, which comprise three and four groups respectively. Regarding the tree-based mPTP approach that was applied to the concatenated phylogenetic dendrogram, nine distinct clusters were identified. As in ASAP-COI, H. SO is further split into three clusters, whilst H. aff. belyaevi remains a single cluster. A subdivision of H. KKT into the same four groups as in ASAP-COI is also present in the mPTP analysis. H. profundicolus is separated from but sister to H. KKT.
Geographic distribution and molecular variability of the belyaevi complex
In total, the 16S haplotype network contained 109 sequences which were divided into 15 haplotypes (HT; ). Aside from H. aff. belyaevi (14 sequences, HT 1), H. ‘SO’ (42 sequences, HT 2–9), and H. ‘KKT’ (52 sequences, HT 11–15), the haplotype network also contained the single sequence of H. profundicolus (1 sequence, HT 10) due to its close evolutionary relationship to H. ‘KKT’ (see below). The single specimen of H. profundicolus (KBII Hap117) was not only closely related to H. ‘KKT’ (9 mutations), but also occurred in sympatry with H. ‘KKT’ at the KBII A8 sampling area located within the ETA region. All remaining phenotypic clusters of the belyaevi complex were separated in the haplotype analysis by high numbers of bp changes in 16S. Among the five observed H. ‘KKT’ haplotypes, two haplotypes were dominating that have distinct geographic distributions: (i) HT 12 was primarily recorded within the CTH region at hadal depths (5,493–8,191 m; ‘KKT hadal’) while (ii) HT 15 occurred at abyssal depths (4,469–5,755 m) of the ETA and WTA regions (hence called ‘KKT abyssal’). Co-occurrence between both haplotypes was restricted to a single sampling area (KBII-A10) in the WTA region and they differed by five bp changes in 16S. HT 11 differed from HT 12 by a single bp change in 16S and also occurred in the CTH. The remaining HT 13 and HT 14 differed from HT 12 by three bp changes in 16S each and occurred in the CTH and ETA, respectively. H. aff. belyaevi was collected from three different sampling areas in the SO region (SKB-A2, A4, A11) and was represented by a single 16S haplotype. All H. aff. belyaevi records cover a narrow depth range of 3,210–3,366 m and exclusively stem from the Kuril Basin. H. aff. belyaevi and H. ‘SO’, which occurred sympatrically at several stations within the Kuril Basin, were separated by a minimum of 23 bp changes. The H. ‘SO’ phenotypic cluster showed the highest 16S diversity and was grouped into eight 16S haplotypes. This diversity was reflected in the biogeography of the group, which occurred at altogether six sampling areas covering a range from the Kuril Basin in the SO region, across the KIR to the WTA region (). However, no geographic pattern became apparent in the haplotype network. As in H. ‘KKT’, few main haplotypes and multiple unique derivative haplotypes, which differ from the main haplotypes by 1–2 mutations, characterized the H. ‘SO’ network. HT 3 and HT 4 occurred within the WTA region at depths of 4,769 but were genetically distinct.
Fig. 9. 16S (1) and COI (2) haplotype networks of the Haploniscus belyaevi species complex and H. profundicolus. Haplotypes are colour-coded after their sampling area and geographic area following Johannsen et al. (Citation2020). Circled numbers represent mutation steps for improved clarity. HT, haplotype.
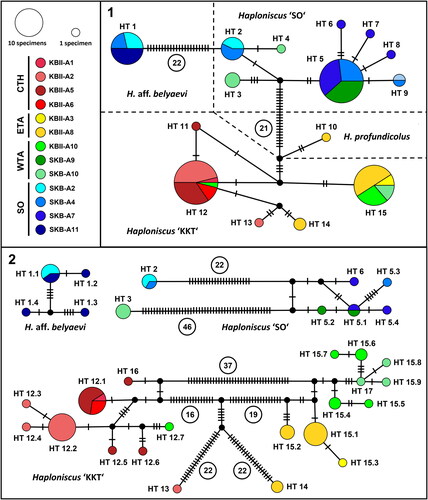
Given the degree of separation between the phenotypic clusters of the belyaevi complex in 16S, three separate haplotype networks were calculated based on 72 COI sequences. In comparison to the 16S haplotype network these were characterized by a larger number of haplotypes (N = 28) as well as a higher frequency of bp changes within the investigated phenotypic clusters (). 16S haplotypes that were split into multiple COI haplotypes are named accordingly to facilitate traceability. The 52 COI sequences belonging to the H. ‘KKT’ cluster (HT 12–17) showed the same geographic distribution as their associated 16S-sequences. A geographic structure that was already indicated in the 16S data became even more clear here: a hadal group, with one exception collected at the CTH region (‘KKT hadal’; HT 12.1–12.6, HT 16) at 5,493–8,191 m depth, comprised two main haplotypes (HT 12.1, HT 12.2) and several unique haplotypes which differed from either of the main haplotypes by 1–4 bp changes; despite originating from the WTA sampling area KBII-A10, HT 12.7 was most closely related to the hadal HT 12.6 and HT 12.5. A second group, that differed from the ‘KKT hadal’ group by 30 or more bp changes occurred solely at abyssal depths (4,469–5,755 m) of the ETA and WTA regions (‘KKT abyssal’; HT 15.1–15.9, HT 17). Among the ‘KKT abyssal’ group no haplotypes were shared between ETA and WTA and within both regions all haplotypes were more similar to each other than between the regions. The hadal HT 13 and the abyssal HT 14 were unique and relatively distinct from any other haplotype of the H. ‘KKT’ cluster. Haploniscus aff. belyaevi (HT 1.1–1.4) was represented in the COI haplotype network by eight sequences that were found at two sampling areas within the SO region (SKB-A2 and SKB-A11). It featured one common haplotype that was distributed in both sampling areas, as well as three unique haplotypes from SKB-A11. The H. ‘SO’ cluster (HT 2, HT 3, HT 5.1–5.4, HT 6) comprised 12 sequences distributed across seven haplotypes. A clear geographic structure became apparent in this COI network separating the haplotypes HT 2 from the SO region (H. ‘SO-SO’) and HT 3 from the WTA region (hence H. ‘SO-WTA’) from the remaining haplotypes of the H. ‘SO’ cluster. These remaining haplotypes (HT 5.1–5.4, HT 6) formed a group covering a large geographic range from the SO across the KIR into the WTA (hence H. ‘SO-KIR’).
Discussion
Taxonomic feedback loop and synthesis
As the central unit in biology is the species, accurate species delimitation is a critical first step upon which subsequent organism-based research and conservation depend. A pluralistic, integrative approach to taxonomy is essential for improved species delimitation and discovery (Padial et al., Citation2010), especially in the deep sea, where the vast majority of eukaryotic species currently remain undiscovered (Cordier et al., 2022).
Evidence presented here from multiple data sources validates the hypothesis that Haploniscus belyaevi sensu Johannsen et al. (Citation2020) is a complex of closely related species. The comparison of molecular and morphological approaches revealed principal congruence ( and ) supporting the distinction of three main lineages within this belyaevi complex. Analyses of the partial COI gene, which as expected exhibited a higher variability than 16S (see, e.g., Brix et al., Citation2011; Riehl et al., Citation2014) (see Supplemental Fig. S2), revealed further subdivisions among these three groups which in turn also allowed for the identification of minor but consistent morphological differences between some of the groups (compare H. KKT above). While H. aff. belyaevi formed a distinct and coherent group across all datasets and its full distribution range (e.g., ), the results were more complex for H. ‘SO’ and H. ‘KKT’.
Molecular data support the separation of an abyssal group from a mostly hadal group among H. ‘KKT’ and indicate the existence of an additional two rare species that were clearly differentiated (). Re-scrutinizing the specimens morphologically, the initially delimited phenotypic cluster H. ‘KKT’ exhibited variation of the rostral and pleotelson morphology as well as body size corroborating the separation of an abyssal from a hadal group (). In conjunction, the congruence between genotypic and phenotypic clusters as well as a highly supported phylogenetic distinction and minimally overlapping geographic distributions provide sufficient support for the delimitation of two separate species H. ‘KKT abyssal’ and H. ‘KKT hadal’ according to the USC and PSC (De Queiroz, Citation2007; Eldredge & Cracraft, Citation1980). A morphological delineation was impossible for the distinct haplotypes HT 13 and HT 14 ( and ) due to the small number of specimens available and their respective ontogenetic stages (HT 13: manca; HT 14: adult ♀ stages).
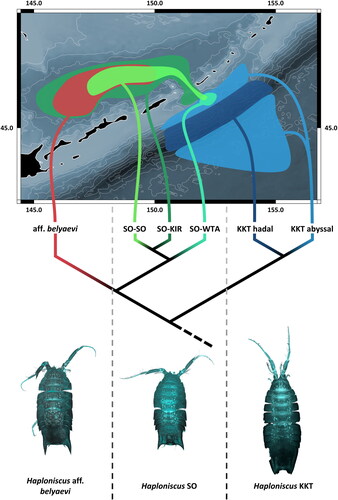
Fig. 10. Phylogeography of the Haploniscus belyaevi species complex in the Kuril-Kamchatka Trench region. Morphological diversity (bottom), simplified phylogenetic diversity (middle) and schematic geographic distribution (top) of each of the six distinct species of the H. belyaevi complex are visualized.
Within H. ‘SO’, molecular approaches support three groups (; and ) with partially overlapping geographic occurrences. Only H. ‘SO-WTA’ and H. ‘SO-KIR’ did not have any sympatric occurrence in the samples (). Morphological re-examination did not reveal noticeable differences between these groups. According to the criteria postulated by Held (Citation2003) and summarized by Raupach and Wägele (Citation2006) (i.e. (i) bimodal distribution of pairwise distance values without intermediates, (ii) differentiation at a level known for this gene from undisputed species pairs closely related to the studied species and (iii) persistence of high levels of genetic differentiation in sympatry) H. ‘SO-SO’, H. ‘SO-KIR’, and H. ‘SO-WTA’ qualify as cryptic species.
Applying morphological, genetic, phylogenetic, and biogeographic criteria, six species can be recognized among the belyaevi complex fulfilling the USC and the PSC: (i) H. aff. belyaevi, (ii) H. ‘SO-KIR’, (iii) H. ‘SO-SO’, (iv) H. ‘SO-WTA’, (v) H. ‘KKT abyssal’, and (vi) H. ‘KKT hadal’. As for H. aff. belyaevi, we refrained to recognize this species as H. belyaevi at this stage due to the missing type material and the distribution differences of the two species. Highly differentiated singleton and rare haplotypes (H. profundicolus, HT 13 and HT 14) indicate the existence of additional species within the H. belyaevi complex. The variation of differentiation of genotypic and phenotypic traits among its members made it clear that no single dataset alone would have been sufficient to discover the full species diversity of the belyaevi complex. This highlights the strengths of an integrative approach to taxonomy.
Species boundaries among the H. belyaevi complex
Allometric and other morphological changes during development, such as sexual dimorphisms, are common among the animal kingdom, also in deep-sea Asellota (e.g., S. Bober et al., Citation2018; Jennings et al., Citation2020), such as Haploniscidae (Brökeland, Citation2010b, Citation2010a). While such morphological disparity between sexes and life stages may cause taxonomic uncertainty (e.g., Riehl & Kühn, Citation2020), in resolving the developmental patterns of individual species lies great potential to infer and better understand ecology and evolution of deep-sea organisms that are otherwise difficult to study (see, e.g., S. Bober et al., Citation2018; Kniesz et al., Citation2018).
It was a noteworthy observation by Johannsen et al. (Citation2020) that some of the phenotypic clusters comprised either only a certain developmental stage or only one sex (Johannsen et al., Citation2020), suggesting that phenotypic plasticity, such as sexual dimorphism or ontogenetic changes, hindered the allocation of conspecific males and females. Our data show that the actual species boundaries do not reflect those originally proposed by Johannsen et al. (Citation2020). The complex is composed of even more (up to nine) species, including several morphologically cryptic species and, surprisingly, potentially H. profundicolus.
Ontogenetic reconstruction revealed three main phenotypic groups within this species complex and showed that during their development all of these species undergo strong and sex-specific morphological changes (, Supplemental Fig. S1), causing difficulties for morphology-based species identification. We investigated their ontogeny with focus on general morphological features known to change during post-marsupial development, such as the seventh pereopods, the seventh pereonites, or the male first pleopods (Brökeland, Citation2010b; Hessler, Citation1970; Wolff, Citation1962). This allowed us to improve our understanding of how sexually dimorphic characters develop throughout maturation and, ultimately, to link conspecific instars (, Supplemental Fig. S1). Three species complexes had been previously reported for the Haploniscidae (Brökeland, Citation2010a; Brökeland & Raupach, Citation2008; Paulus et al., Citation2022). Similar to our findings, two of these are also characterized by a somewhat pronounced and unique sexual dimorphism, a prominent characteristic also found in other haploniscids (e.g., Birstein, Citation1963a; Brökeland, Citation2010b, Citation2010a). In these cases, females share a relatively common morphology across species while morphological differentiation is pronounced in adult males (Brökeland, Citation2010a; Knauber, unpublished data). Tracing the morphological changes through post-marsupial development was the only way to delineate species groups on morphological grounds with certainty. Because our findings for the belyaevi complex are showing the same pattern we assume we are dealing with a rather common phenomenon in the Haploniscidae.
This family is not the only group of crustaceans in the deep-sea benthos with strong morphological changes during ontogeny affecting diagnostic characters (see, e.g., Riehl & Kühn, Citation2020) or sexual dimorphism (e.g., J. Bober et al., Citation2019; Duncan, Citation1983; Riehl et al., Citation2012; Rivera & Oakley, Citation2009). Given that any organism-centred, broad-picture seeking branch of comparative biology relies on a meaningful taxonomic foundation and the names it creates (Patterson et al., Citation2010; Sigwart et al., Citation2021), our study adds to the growing body of literature highlighting the necessity for high-quality taxonomic information that includes verified DNA reference libraries as well as ontogenetic information (Korshunova et al., Citation2017; Methou et al., Citation2020) in an integrative approach to taxonomy.
The 16S data of H. profundicolus – initially included for means of comparison – suggests that this species is closely related to the belyaevi complex. Indeed, its sister-group relationship with H. ‘KKT’ () and high molecular similarity with H. ‘KKT hadal’ (0.02 uncorr. p-distance; ) suggests it is part of the same phylogenetic lineage. However, H. profundicolus is strikingly different morphologically: (i) the adult male specimen lacks the posterior protrusions of the pleotelson covering the uropods and (ii) further lacks the distodorsal spine on the fifth peduncular article of the second antenna, which represents the character that distinguishes members of the belyaevi complex from other haploniscids from the KKT region.
The close genetic affiliation of H. profundicolus and the belyaevi complex was surprising. Over all, our results suggest that the high morphological similarities between the members of the belyaevi complex, in particular the juvenile stages and females, is due to a lack of differentiation rather than chance similarities because these species are phylogenetically relatively young (). Therefore, the close genetic affiliation of a morphologically highly distinct species, like H. profundicolus seems at odds. It is currently solely based on 16S molecular data and a single adult male specimen. On this data basis, laboratory errors leading to contamination cannot be excluded as an explanation for certain. For this reason, we hesitate to conclude on this issue.
Together with haplotypes HT 13 and HT 14, the three rare haplotypes indicate the potential existence of further species within the belyaevi complex, highlighting that despite increased sampling efforts in the NWP over the last decades (see, e.g., Brandt et al., Citation2020; Brandt & Malyutina, Citation2015) the deep-sea fauna of this region is still not fully inventoried. Such occurrences are unsurprising as in deep-sea biodiversity studies high numbers of singletons and low densities are often reported and explained with rarity (e.g., Elsner et al., Citation2015; Janssen et al., Citation2015; Pasotti et al., Citation2021) which would require a much higher sampling effort to have the full species richness represented in the samples. Despite decades of studies and numerous campaigns since the first samples were taken in the abysso-hadal NWP, our results show that we can still expect many species that are new to science to be discovered during forthcoming expeditions. Nevertheless, with those species that are more common, our dataset and the integrative taxonomic approach applied allows for a first look into the phylogeography of the Haploniscidae in the NWP deep sea.
Biogeography and potential geomorphological impact on diversification
Geomorphological features and diversification
A barrier effect of ridges and trenches is mainly supported by the rarity of species and haplotypes occurring across such proposed barriers. In contrast to previous work which suggested the KKT and/or KIR as isolating geomorphological features for benthic species (J. Bober et al., Citation2019; Jennings et al., Citation2020), three species were identified within the belyaevi complex whose ranges span across one of these barriers (). However, focusing on the species level alone would not do justice to the full extent of observed variation associated with the presence of these geomorphological features. The COI haplotype analysis (), for instance, suggests the populations of H. ‘KKT abyssal’ on either side of the KKT evolve rather separately. With no shared COI haplotypes between both sides of the trench and consistent grouping of WTA and ETA specimens respectively, clear geographic structure is apparent and reduced gene flow between these populations is indicated. Being indistinguishable in morphological and 16S data, these populations have likely not been separated for long, but the accumulation of evidence for several different isopod groups indicates a general role of the trench as a barrier promoting divergence between populations. Our findings are similar to what has been reported for a few species of other isopod families, the Macrostylidae and Ischnomesidae, which also occur on both sides of the KKT with reduced gene flow among populations (J. Bober et al., Citation2019; S. Bober et al., Citation2018). It should be noted, though, that our study, like the ones cited above, is limited to mitochondrial DNA which allows to gain insight in maternal lineages only. A recent comparison between mitochondrial and nuclear sequence data from haploniscids in a population-genetic context discovered differences between connectivity indicators for males and females (Paulus et al., Citation2022). Consistently, males showed higher population connectivity providing evidence for a comparatively more active migratory behaviour compared with females. Haploniscus ‘KKT abyssal’ constitutes a promising species to further investigate the barrier effect of the trench, and sequencing of restriction site associated DNA markers (RADseq) would provide a powerful tool to look deeper into the connectivity across the KKT and the trench’s role in population differentiation, which we can only touch upon briefly here.
Of particular interest is also the dependency of a barrier effect on the dispersal potential of the respective taxa. Haploniscids are assumed to have limited dispersal abilities due to their benthic and brooding lifestyle, like other isopods; moreover, haploniscids lack any morphological adaptation associated with extensive locomotion, such as natatory appendages, which may be the reason for even more restricted gene flow in this group compared with more motile isopods, such as munnopsids (e.g., Brix et al., Citation2020; Harrison, Citation1989). Similar to mid-ocean ridges, also the barrier effect of trenches on the dispersal and gene flow of benthic species may be dependent on lifestyle and niche adaptations of the species (S. Bober et al., Citation2018; Brix et al., Citation2020) which is a promising starting point for future population-genetic studies.
Different from previous studies investigating the barrier effect of the Mid-Atlantic Ridge on isopod differentiation (S. Bober et al., Citation2018; Riehl et al., Citation2018), we found evidence for exchange across the KIR, as predicted by Brandt et al. (Citation2019). They hypothesized that the relatively deep (∼2,350 m) Bussol Strait, along which H. ‘SO-KIR’ and H. ‘SO-SO’ have been collected, enables dispersal across the KIR connecting WTA and SO populations. In our study, H. ‘SO-KIR’ as well as H. ‘SO-SO’ have been collected on either side of the KIR (). While the trans-KIR distribution for H. ‘SO-SO’, was restricted to a single and genetically distinct specimen from the WTA region (HT 4) without shared haplotypes between regions (), H. ‘SO-KIR’ shows a lack of geographic structuring with shared trans-KIR haplotypes (HT 5 in 16S; HT 5.1 in COI). The high frequency 16S haplotype HT 5 is likely ancestral to its closest relatives as there is a direct relationship between haplotypes frequencies and the age of a haplotype; star-like network patterns characterized by a frequent and dominant haplotype surrounded by multiple rare haplotypes with only one or few bp differences suggest that most of the haplotypes originated in a recent population expansion (Bandelt et al., Citation1995) which is more clearly visible in 16S because of the larger number of available sequences. This may indicate a recent colonization of the SO, possibly related to glacial-interglacial environmental changes which have had a strong effect on ice cover, nutrient input through continental runoff and oxygen ventilation in the SO with a hypoxic midwater event only 6,000 years ago (Lembke-Jene et al., Citation2018), which could have had dramatic effects on the SO benthos. However, haplotype networks were primarily constructed to assist with species delimitation and to gain first insights into geographic structuring of the genetic diversity. Standard population genetic indices of haplotype and nucleotide diversity or those used to infer demographic history have not been calculated because the number of available specimens was too small for many populations in order to expect meaningful results. The wide trans-KIR distribution of H. ‘SO-KIR’ is surprising, though, as in another Pacific abyssal region a mean maximal range of 183 km has been observed for haploniscids (Brix et al., Citation2020) which is exceeded by far with the trans-KIR distribution observed here. Morphological differences between species studied here that may suggest differing dispersal abilities have not been identified.
Depth and diversification
In line with the depth-differentiation hypothesis (DDH; Rex & Etter, Citation2010) we observed an almost complete separation of abyssal and hadal haplotypes within H. ‘KKT’, which was supported by morphological and molecular data (). The DDH was originally induced from observations made in bathyal slope environments; it predicts that species inhabiting environments with steep depth gradients inhabit relatively narrow depth horizons in contrast to much wider geographic ranges. Especially niche turnover along this gradient, caused by the depth-dependent changes of pressure, food supply and other environmental factors, favours genetic diversity and ultimately results in species formation, according to the DDH (Jennings et al., Citation2013; Zardus et al., Citation2006). The combined physiological effects of these environmental depth gradients likely constrain the fundamental ecological niches of many crustacean species (McCallum & Riehl, Citation2020) and thus provide opportunity for ecological speciation. Even though most evidence supporting the DDH originates from bathyal depths, including a Haploniscidae example (Brökeland & Raupach, Citation2008), patterns of vertical stratification have been observed also at abyssal and hadal depths (Havermans et al., Citation2013; Jennings et al., Citation2020) pointing at similar patterns of niche adaptations potentially entailing biochemical limitations and/or competitive exclusion. The difference in body size between the supposedly recently diverged sister clades H. ‘KKT abyssal’ and H. ‘KKT hadal’ may be linked to depth-dependent variation in nutrient supply (Altabet et al., Citation1991), a factor connected to metabolic niches (McClain et al., Citation2020). Located in a highly productive area, the KKT receives relatively large supplies of organic matter from surface waters (Stewart & Jamieson, Citation2018). These accumulate within the trench due to its physical topography. Because a connection between food availability and body sizes has been postulated for deep-sea environments before (see Ruhl et al., Citation2008), the increased nutrient supply for specimens inhabiting the trench valley could have ultimately had an impact on speciation through metabolic niche adaptations and larger body sizes.
Overall, the diversity patterns and geographic distributions of the haploniscids studied here suggest that in situ evolution rather than the source-sink scenario (see Hessler & Wilson, Citation1983; Rex et al., Citation2005) plays a significant role in the forming and distribution of species in the abyss and hadal, similar to other isopod groups (Wilson & Hessler, Citation1987). We see relatively clear indications in our data, that bathymetry may be a key driver for diversification, not only in the bathyal, as multiple previous studies showed, but also in the deepest regions of the oceans.
Outlook
Our study showed that the diversity of haploniscid isopods in the NWP deep sea is far from completely inventoried. Clear indications for additional species belonging to the belyaevi complex that could not be followed due to insufficient and/or unsuitable material promise future discoveries of new taxa even where the deep-sea benthos has been sampled relatively well. The value of a comprehensive and integrative taxonomic approach becomes clear when examining the complex phylogeny and varying levels of morphological differentiation between closely related species despite comparable genetic divergence. Importantly, delimiting and naming cryptic species lays a fundamental baseline for various research applications and may eventually even inform decision-makers regarding conservation policies as well as resource and health management (e.g., de León & Nadler, Citation2010; Delić et al., Citation2017).
Our molecular analyses were solely based on mitochondrial markers which are maternally inherited and known to bear the risk of persistent ancestral polymorphisms and introgression (e.g., Mason et al., Citation1995). It remains to be studied in a proper population-genetic design and with additional nuclear markers, how much of the genetic variation we observed within the belyaevi complex is attributable to the grouping of populations delimited by the boundaries of the major geographic structures KKT and KIR as well as to depth and related environmental factors. The application of next-generation sequencing (NGS), such as RADseq can provide robust population genetic results from limited numbers of specimens and small amounts of tissue. Study designs integrating NGS with dedicated phylogeographic and detailed taxonomic research approaches may be a suitable next step to build on this study, which had the primary goal of delimiting species. This way, NWP haploniscids may serve to provide new perspectives on key research questions, such as the evolutionary origins and vulnerability of deep-sea biota; at a time when both short- and long-term perturbations to deep-sea ecosystems are increasing, NGS promises to provide new and highly interesting hypotheses about the functioning of deep-sea organisms and communities.
Associate Editor: Dr Xikun Song
Supplemental Material - Table S7
Download MS Word (17.1 KB)Supplemental Material - Table S6
Download MS Word (16.6 KB)Supplemental Material - Table S5
Download MS Word (14.7 KB)Supplemental Material - Table S4
Download MS Word (20.3 KB)Supplemental Material - Table S3
Download MS Word (14.7 KB)Supplemental Material - Table S2
Download MS Word (66.7 KB)Supplemental Material - Table S1
Download MS Word (20.2 KB)Supplemental Material - Figure S2
Download MS Word (472.3 KB)Supplemental Material - Figure S1
Download MS Word (280.5 KB)Acknowledgements
All haploniscid specimens analysed within this study were collected and sorted within the framework of the international KuramBio II and SokhoBio projects. The SokhoBio expedition was organized with financial support from the Russian Science Foundation (Project No. 14-50-00034). Material sorting was funded by the BMBF (German Ministry of Education and Research) grant 03G0857A to Angelika Brandt, University of Hamburg, now Senckenberg Museum, Frankfurt, Germany. Funding for the KuramBio II expedition was provided by the PTJ (Projektträger Jülich) BMBF grant 03G0250A to Angelika Brandt. Further support for these projects was provided by the Russian Foundation for Basic Research (projects 13-04-02144, 16-04-01431), the Council of the President of the Russian Federation (project MK-2599.2013.4), Russian Federation Government grant No 11. G34.31.0010 and a grant of the Presidium of the Far East Branch of RAS (12–I–P30–07). Biogeography and distribution studies were supported by the Russian Ministry of Science and Education (Project 14.616.21.0077, ID No. RFMEF161617X0077). Finalizing this paper was possible thanks to the generous financial support of the Johanna Quandt Young Academy at Goethe University. We thank the crews of the RVs Sonne and Akademik M.A. Lavrentyev for their work and help in collecting these samples, as well as all scientists, student helpers and technicians who sorted and managed the collected samples. This is contribution #1 of the Senckenberg Ocean Species Alliance (SOSA).
Disclosure statement
No potential conflict of interest was reported by the author(s).
Supplemental material
Supplemental material for this article can be accessed here: https://dx.doi.org/10.1080/14772000.2022.2099477.
Related Research Data
References
- Altabet, M. A., Deuser, W. G., Honjo, S., & Stienen, C. (1991). Seasonal and depth-related changes in the source of sinking particles in the North Atlantic. Nature, 354, 136–139. https://doi.org/10.1038/354136a0
- Bandelt, H. J., Forster, P., Sykes, B. C., & Richards, M. B. (1995). Mitochondrial portraits of human populations using median networks. Genetics, 141, 743–753. https://doi.org/10.1093/genetics/141.2.743
- Benson, D. A., Cavanaugh, M., Clark, K., Karsch-Mizrachi, I., Lipman, D. J., Ostell, J., & Sayers, E. W. (2013). GenBank. Nucleic Acids Research, 41, D36–D42. https://doi.org/10.1093/nar/gks1195
- Birstein, J. A. (1963a). Deep water isopods (Crustacea, Isopoda) of the north-western part of the Pacific Ocean. Nauka Publishing House, USSR Academy of Sciences, P.P. Shirshov Institute of Oceanography.
- Birstein, J. A. (1963b). Isopods (Crustacea, Isopoda) from the ultra-abyssal zone of the Bougainville Trench. Zoologicheskii Zhurnal, 42, 814–834.
- Birstein, J. A. (1971). Additions to the fauna of isopods (Crustacea: Isopoda) of the Kuril-Kamchatka Trench. Part 2. Asellota-2. Trudy Instituta Okeanologii Akademiya Nauk SSR, 92, 162–238.
- Bober, J., Brandt, A., Frutos, I., & Schwentner, M. (2019). Diversity and distribution of Ischnomesidae (Crustacea: Isopoda: Asellota) along the Kuril-Kamchatka Trench – A genetic perspective. Progress in Oceanography, 178, 102174. https://doi.org/10.1016/j.pocean.2019.102174
- Bober, S., Brix, S., Riehl, T., Schwentner, M., & Brandt, A. (2018). Does the Mid-Atlantic Ridge affect the distribution of abyssal benthic crustaceans across the Atlantic Ocean? Deep Sea Research Part II: Topical Studies in Oceanography, 148, 91–104. https://doi.org/10.1016/j.dsr2.2018.02.007
- Bober, S., Riehl, T., Henne, S., & Brandt, A. (2018). New Macrostylidae (Isopoda) from the Northwest Pacific Basin described by means of integrative taxonomy with reference to geographical barriers in the abyss. Zoological Journal of the Linnean Society, 182, 549–603. https://doi.org/10.1093/zoolinnean/zlx042
- Boltnev, A., Kacher, O. (2010). Panorama Stitcher Mini (1.10) [MacOS]. https://www.panoramastitcher.com
- Bowen, B. W., Gaither, M. R., DiBattista, J. D., Iacchei, M., Andrews, K. R., Grant, W. S., Toonen, R. J., & Briggs, J. C. (2016). Comparative phylogeography of the ocean planet. Proceedings of the National Academy of Sciences of the United States of America, 113, 7962–7969. https://doi.org/10.1073/pnas.1602404113
- Brandt, A. (2016). Kuril Kamchatka Biodiversity Studies II - RV Sonne SO250, Tomakomai-Yokohama (Japan), 16.08.-26.09.2016 (p. 174). [Cruise report]. University of Hamburg.
- Brandt, A., Alalykina, I., Brix, S., Brenke, N., Błażewicz, M., Golovan, O. A., Johannsen, N., Hrinko, A. M., Jażdżewska, A. M., Jeskulke, K., Kamenev, G. M., Lavrenteva, A. V., Malyutina, M. V., Riehl, T., & Lins, L. (2019). Depth zonation of Northwest Pacific deep-sea macrofauna. Progress in Oceanography, 176, 102131. https://doi.org/10.1016/j.pocean.2019.102131
- Brandt, A., Brix, S., Riehl, T., & Malyutina, M. (2020). Biodiversity and biogeography of the abyssal and hadal Kuril-Kamchatka trench and adjacent NW Pacific deep-sea regions. Progress in Oceanography, 181, 102232. https://doi.org/10.1016/j.pocean.2019.102232
- Brandt, A., Brökeland, W., Brix, S., & Malyutina, M. (2004). Diversity of Southern Ocean deep-sea Isopoda (Crustacea, Malacostraca)—A comparison with shelf data. Deep Sea Research Part II: Topical Studies in Oceanography, 51, 1753–1768. https://doi.org/10.1016/j.dsr2.2004.06.033
- Brandt, A., Elsner, N., Brenke, N., Golovan, O., Malyutina, M. V., Riehl, T., Schwabe, E., & Würzberg, L. (2013). Epifauna of the Sea of Japan collected via a new epibenthic sledge equipped with camera and environmental sensor systems. Deep Sea Research Part II: Topical Studies in Oceanography, 86-87, 43–55. http://dx.doi.org/10.1016/j.dsr2.2012.07.039
- Brandt, A., & Malyutina, M. V. (2015). The German-Russian deep-sea expedition KuramBio (Kurile Kamchatka biodiversity studies) on board of the RV Sonne in 2012 following the footsteps of the legendary expeditions with RV Vityaz. Deep Sea Research Part II: Topical Studies in Oceanography, 111, 1–9. http://dx.doi.org/10.1016/j.dsr2.2014.11.001
- Brenke, N. (2005). An epibenthic sledge for operations on marine soft bottom and bedrock. Marine Technology Society Journal, 39, 10–21. https://doi.org/10.4031/002533205787444015
- Brix, S., Leese, F., Riehl, T., & Kihara, T. C. (2015). A new genus and new species of Desmosomatidae Sars, 1897 (Isopoda) from the eastern South Atlantic abyss described by means of integrative taxonomy. Marine Biodiversity, 45, 7–61. https://doi.org/10.1007/s12526-014-0218-3
- Brix, S., Osborn, K. J., Kaiser, S., Truskey, S. B., Schnurr, S. M., Brenke, N., Malyutina, M., & Martinez Arbizu, P. (2020). Adult life strategy affects distribution patterns in abyssal isopods – implications for conservation in Pacific nodule areas. Biogeosciences, 17, 6163–6184. https://doi.org/10.5194/bg-17-6163-2020
- Brix, S., Riehl, T., & Leese, F. (2011). First genetic data for species of the genus Haploniscus Richardson, 1908 (Isopoda: Asellota: Haploniscidae) from neighbouring deep-sea basins in the South Atlantic. Zootaxa, 2838, 79–84. https://doi.org/10.11646/zootaxa.2838.1.5
- Brix, S., Stransky, B., Malyutina, M., Pabis, K., Svavarsson, J., & Riehl, T. (2018). Distributional patterns of isopods (Crustacea) in Icelandic and adjacent waters. Marine Biodiversity, 48, 783–811. https://doi.org/10.1007/s12526-018-0871-z
- Brökeland, W. (2010a). Description of four new species from the Haploniscus unicornis Menzies, 1956 complex (Isopoda: Asellota: Haploniscidae). Zootaxa, 2536, 1–35. https://doi.org/10.11646/zootaxa.2536.1
- Brökeland, W. (2010b). Redescription of Haploniscus rostratus (Menzies, 1962) (Crustacea: Peracarida: Isopoda) with observations on the postmarsupial development, size ranges and distribution. Zootaxa, 2521, 1–25. https://doi.org/10.11646/zootaxa.2521.1
- Brökeland, W., & Raupach, M. J. (2008). A species complex within the isopod genus Haploniscus (Crustacea: Malacostraca: Peracarida) from the Southern Ocean deep sea: A morphological and molecular approach. Zoological Journal of the Linnean Society, 152, 655–706. https://doi.org/10.1111/j.1096-3642.2008.00362.x
- Chernomor, O., von Haeseler, A., & Minh, B. Q. (2016). Terrace aware data structure for phylogenomic inference from supermatrices. Systematic Biology, 65, 997–1008. https://doi.org/10.1093/sysbio/syw037
- Clement, M., Snell, Q., Walker, P., Posada, D., & Crandall, K. (2002 TCS: Estimating gene genealogies. Parallel and Distributed Processing Symposium, International, 2, 7
- Cordier, T., Angeles, I. B., Henry, N., Lejzerowicz, F., Berney, C., Morard, R., Brandt, A., Cambon-Bonavita, M.-A., Guidi, L., Lombard, F., Arbizu, P. M., Massana, R., Orejas, C., Poulain, J., Smith, C. R., Wincker, P., Arnaud-Haond, S., Gooday, A. J., de Vargas, C., & Pawlowski, J. (2022). Patterns of eukaryotic diversity from the surface to the deep-ocean sediment. Science Advances, 8, eabj9309. https://doi.org/10.1126/sciadv.abj9309
- Daníelsdóttir, A., Gíslason, D., Kristinsson, K., Stefánsson, M., Johansen, T., & Pampoulie, C. (2008). Population structure of deep-sea and oceanic phenotypes of deepwater redfish in the Irminger Sea and Icelandic continental slope: Are they cryptic species? Transactions of the American Fisheries Society, 137, 1723–1740. https://doi.org/10.1577/T07-240.1
- de León, G. P. -P., & Nadler, S. A. (2010). What we don't recognize can hurt us: a plea for awareness about cryptic species. Journal of Parasitology, 96, 453–464. https://doi.org/10.1645/GE-2260.1
- Delić, T., Trontelj, P., Rendoš, M., & Fišer, C. (2017). The importance of naming cryptic species and the conservation of endemic subterranean amphipods. Scientific Reports, 7, 3391. https://doi.org/10.1038/s41598-017-02938-z
- De Queiroz, K. (2007). Species concepts and species delimitation. Systematic Biology, 56, 879–886. https://doi.org/10.1080/10635150701701083
- Duncan, T. K. (1983). Sexual dimorphism and reproductive behavior in Almyracuma proximoculi (Crustacea: Cumacea): The effect of habitat. The Biological Bulletin, 165, 370–378. https://doi.org/10.2307/1541202
- Eldredge, N., & Cracraft, J. (1980). Phylogenetic patterns and the evolutionary process: Method and theory in comparative biology. Columbia University Press.
- Elsner, N. O., Malyutina, M. V., Golovan, O. A., Brenke, N., Riehl, T., & Brandt, A. (2015). Deep down: Isopod biodiversity of the Kuril–Kamchatka abyssal area including a comparison with data of previous expeditions of the RV Vityaz. Deep Sea Research Part II: Topical Studies in Oceanography, 111, 210–219. https://doi.org/10.1016/j.dsr2.2014.08.007
- European Organization For Nuclear Research & OpenAIRE. (2013). Zenodo [Database]. Zenodo. https://doi.org/10.25495/7GXK-RD71
- Goffredi, S., Hurtado, L., Hallam, S., & Vrijenhoek, R. (2003). Evolutionary relationships of deep-sea vent and cold seep clams (Mollusca: Vesicomyidae) of the “pacifica/lepta” species complex. Marine Biology, 142, 311–320. https://doi.org/10.1007/s00227-002-0941-3
- GRASS Development Team (2020). Geographic Resources Analysis Support System (GRASS) Software. Open Source Geospatial Foundation (7.8.1) [Computer software]. http://grass.osgeo.org
- Grassle, J. F. (2000). The Ocean Biogeographic Information System (OBIS): An online, worldwide atlas for accessing, modeling and mapping marine biological data in a multidimensional geographic context. Oceanography, 13, 5–7. https://doi.org/10.5670/oceanog.2000.01
- Hansen, H. J. (1916). Crustacea Malacostraca, III. V. The order Isopoda. In The Danish Ingolf-Expedition, 3, 1–262.
- Harrison, K. (1989). Are deep-sea asellote isopods infaunal or epifaunal? Crustaceana, 56, 317–319. https://doi.org/10.1163/156854089X00284
- Havermans, C., Sonet, G., d'Udekem d'Acoz, C., Nagy, Z. T., Martin, P., Brix, S., Riehl, T., Agrawal, S., & Held, C. (2013). Genetic and morphological divergences in the cosmopolitan deep-sea amphipod Eurythenes gryllus reveal a diverse abyss and a bipolar species. PloS One, 8, e74218. https://doi.org/10.1371/journal.pone.0074218
- Hebert, P. D., Cywinska, A., Ball, S. L., & Dewaard, J. R. (2003). Biological identifications through DNA barcodes. Proceedings. Biological Sciences, 270, 313–321. https://doi.org/10.1098/rspb.2002.2218
- Held, C. (2003). Molecular evidence for cryptic speciation within the widespread Antarctic crustacean Ceratoserolis trilobitoides (Crustacea, Isopoda). In A. H. L. Huiskes, W. W. C. Gieskes, J. Rozema, R. M. L. Schorno, S. M. van der Vies, & W. J. Wolff (Eds.), Antarctic biology in a global context. (pp. 135–139). Backhuys Publishers.
- Hennig, W. (1965). Phylogenetic systematics. Annual Review of Entomology, 10, 97–116. https://doi.org/10.1146/annurev.en.10.010165.000525
- Hessler, R. R. (1970). The Desmosomatidae (Isopoda, Asellota) of the Gay Head-Bermuda transect (Vol. 15). University of California Press. https://escholarship.org/uc/item/1mn198vx
- Hessler, R. R., & Wilson, G. D. F. (1983). The origin and biogeography of malacostracan crustaceans in the deep sea. Evolution, Time and Space: The Emergence of the Biosphere, 23, 227–254.
- Hillis, D. M., & Bull, J. J. (1993). An empirical test of bootstrapping as a method for assessing confidence in phylogenetic analysis. Systematic Biology, 42, 182–192. https://doi.org/10.1093/sysbio/42.2.182
- Janssen, A., Kaiser, S., Meißner, K., Brenke, N., Menot, L., & Martínez Arbizu, P. (2015). A reverse taxonomic approach to assess macrofaunal distribution patterns in abyssal Pacific polymetallic nodule fields. PloS One, 10, e0117790.
- Jennings, R. M., Etter, R. J., & Ficarra, L. (2013). Population differentiation and species formation in the seep sea: The potential role of environmental gradients and depth. PloS One, 8, e77594. https://doi.org/10.1371/journal.pone.0077594
- Jennings, R. M., Golovan, O., & Brix, S. (2020). Integrative species delimitation of desmosomatid and nannoniscid isopods from the Kuril-Kamchatka trench, with description of a hadal species. Progress in Oceanography, 182, 102236. https://doi.org/10.1016/j.pocean.2019.102236
- Johannsen, N., Lins, L., Riehl, T., & Brandt, A. (2020). Changes in species composition of Haploniscidae (Crustacea: Isopoda) across potential barriers to dispersal in the Northwest Pacific. Progress in Oceanography, 180, 102233. https://doi.org/10.1016/j.pocean.2019.102233
- Katoh, K., & Standley, D. M. (2013). MAFFT multiple sequence alignment software version 7: Improvements in performance and usability. Molecular Biology and Evolution, 30, 772–780. https://doi.org/10.1093/molbev/mst010
- Katoh, K., Misawa, K., Kuma, K., & Miyata, T. (2002). MAFFT: A novel method for rapid multiple sequence alignment based on fast Fourier transform. Nucleic Acids Research, 30, 3059–3066. https://doi.org/10.1093/nar/gkf436
- Kniesz, K., Brandt, A., & Riehl, T. (2018). Peritrich epibionts on the hadal isopod species Macrostylis marionae n. Sp. From the Puerto Rico Trench used as indicator for sex-specific behaviour. Deep Sea Research Part II: Topical Studies in Oceanography, 148, 105–129. https://doi.org/10.1016/j.dsr2.2017.10.007
- Knowlton, N. (1993). Sibling species in the sea. Annual Review of Ecology and Systematics, 24, 189–216. https://doi.org/10.1146/annurev.es.24.110193.001201
- Korshunova, T., Martynov, A., & Picton, B. (2017). Ontogeny as an important part of integrative taxonomy in Tergipedid aeolidaceans (Gastropoda: Nudibranchia) with a description of a new genus and species from the Barents Sea. Zootaxa, 4324, 1–22. https://doi.org/10.11646/zootaxa.4324.1.1
- Kumar, S., Stecher, G., Li, M., Knyaz, C., & Tamura, K. (2018). MEGA X: Molecular evolutionary genetics analysis across computing platforms. Molecular Biology and Evolution, 35, 1547–1549. https://doi.org/10.1093/molbev/msy096
- Leigh, J. W., & Bryant, D. (2015). POPART: Full-feature software for haplotype network construction. Methods in Ecology and Evolution, 6, 1110–1116. https://doi.org/10.1111/2041-210X.12410
- Lembke-Jene, L., Tiedemann, R., Nürnberg, D., Gong, X., & Lohmann, G. (2018). Rapid shift and millennial-scale variations in Holocene North Pacific Intermediate Water ventilation. Proceedings of the National Academy of Sciences of the United States of America, 115, 5365–5370. https://doi.org/10.1073/pnas.1714754115
- Letunic, I., & Bork, P. (2007). Interactive Tree Of Life (iTOL): An online tool for phylogenetic tree display and annotation. Bioinformatics (Oxford, England), 23, 127–128. https://doi.org/10.1093/bioinformatics/btl529
- Lilljeborg, W. (1864). Bidrag till Kännedomen om de inom Sverige och Norrige förekommande Crustaceer af Isopodernas underordning och Tanaidernas familj. Leffler. http://mdz-nbn-resolving.de/urn:nbn:de:bvb:12-bsb10231589-9
- Mallet, J. (1995). A species definition for the modern synthesis. Trends in Ecology & Evolution, 10, 294–299. https://doi.org/10.1016/0169-5347(95)90031-4
- Malyutina, M. V., Brandt, A., & Ivin, V. I. (2015). The Russian-German deep-sea expedition SokhoBio (Sea of Okhotsk Biodiversity Studies) to the Kurile Basin of the Sea of Okhotsk on board of the R/V Akademik M. A. Lavrentyev (p. 102) [Cruise report].
- Malyutina, M. V., Chernyshev, A. V., & Brandt, A. (2018). Introduction to the SokhoBio (Sea of Okhotsk Biodiversity Studies) expedition 2015. Deep Sea Research Part II: Topical Studies in Oceanography, 154, 1–9. https://doi.org/10.1016/j.dsr2.2018.08.012
- Mason, D. J., Butlin, R. K., & Gacesa, P. (1995). An unusual mitochondrial DNA polymorphism in the Chorthippus biguttulus species group (Orthoptera: Acrididae). Molecular Ecology, 4, 121–126. https://doi.org/10.1111/j.1365-294X.1995.tb00199.x
- Mayr, E. (1963). Animal species and evolution. Harvard University Press. Oxford University Press. https://www.cabdirect.org/cabdirect/abstract/19640100703
- McCallum, A., & Riehl, T. (2020). Intertidal to Abyss: Crustaceans and Depth. In Evolution and Biogeography—The Natural History of the Crustacea (Vol. 8, pp. 429–449). Oxford University Press. https://global.oup.com/academic/product/the-natural-history-of-the-crustacea-9780190637842?lang=en&cc=de#
- McClain, C. R., Webb, T. J., Nunnally, C. C., Dixon, S. R., Finnegan, S., & Nelson, J. A. (2020). Metabolic Niches and Biodiversity: A Test Case in the Deep Sea Benthos. Frontiers in Marine Science, 7, 216. https://doi.org/10.3389/fmars.2020.00216
- Methou, P., Michel, L. N., Segonzac, M., Cambon-Bonavita, M.-A., & Pradillon, F. (2020). Integrative taxonomy revisits the ontogeny and trophic niches of Rimicaris vent shrimps. Royal Society Open Science, 7, 200837. https://doi.org/10.1098/rsos.200837
- Michels, J., & Büntzow, M. (2010). Assessment of Congo red as a fluorescence marker for the exoskeleton of small crustaceans and the cuticle of polychaetes. Journal of Microscopy, 238, 95–101. https://doi.org/10.1111/j.1365-2818.2009.03360.x
- Microsoft Corporation. (2015). Image Composite Editor (2.0.3.0) [Windows]. Microsoft Corporation. https://www.microsoft.com/en-us/research/product/computational-photography-applications/image-composite-editor/
- Minh, B. Q., Schmidt, H. A., Chernomor, O., Schrempf, D., Woodhams, M. D., von Haeseler, A., & Lanfear, R. (2020). IQ-TREE 2: New models and efficient methods for phylogenetic inference in the genomic era. Molecular Biology and Evolution, 37, 1530–1534. https://doi.org/10.1093/molbev/msaa015
- Mora, C., Tittensor, D. P., Adl, S., Simpson, A. G. B., & Worm, B. (2011). How many species are there on Earth and in the ocean? Public Library of Science Biology, 9, e1001127. https://doi.org/10.1371/journal.pbio.1001127
- Niedzielski, T., Høines, Å., Shields, M. A., Linley, T. D., & Priede, I. G. (2013). A multi-scale investigation into seafloor topography of the northern Mid-Atlantic Ridge based on geographic information system analysis. Deep Sea Research Part II: Topical Studies in Oceanography, 98, 231–243. https://doi.org/10.1016/j.dsr2.2013.10.006
- Padial, J. M., Miralles, A., De la Riva, I., & Vences, M. (2010). The integrative future of taxonomy. Frontiers in Zoology, 7, 16. https://doi.org/10.1186/1742-9994-7-16
- Page, T. J., Choy, S. C., & Hughes, J. M. (2005). The taxonomic feedback loop: Symbiosis of morphology and molecules. Biology Letters, 1, 139–142. https://doi.org/10.1098/rsbl.2005.0298
- Pante, E., Puillandre, N., Viricel, A., Arnaud‐Haond, S., Aurelle, D., Castelin, M., Chenuil, A., Destombe, C., Forcioli, D., Valero, M., Viard, F., & Samadi, S. (2015). Species are hypotheses: Avoid connectivity assessments based on pillars of sand. Molecular Ecology, 24, 525–544. https://doi.org/10.1111/mec.13048
- Pasotti, F., Mevenkamp, L., Pape, E., Błażewicz, M., Bonifácio, P., Riehl, T., De Smet, B., Lefaible, N., Lins, L., & Vanreusel, A. (2021). A local scale analysis of manganese nodules influence on the Clarion-Clipperton Fracture Zone macrobenthos. Deep Sea Research Part I: Oceanographic Research Papers, 168, 103449. https://doi.org/10.1016/j.dsr.2020.103449
- Patterson, D. J., Cooper, J., Kirk, P. M., Pyle, R. L., & Remsen, D. P. (2010). Names are key to the big new biology. Trends in Ecology & Evolution, 25, 686–691. https://doi.org/10.1016/j.tree.2010.09.004
- Paulus, E., Brix, S., Siebert, A., Martínez Arbizu, P., Rossel, S., Peters, J., Svavarsson, J., & Schwentner, M. (2022). Recent speciation and hybridization in Icelandic deep-sea isopods: An integrative approach using genomics and proteomics. Molecular Ecology, 31, 313–330. https://doi.org/10.1111/mec.16234
- Puillandre, N., Brouillet, S., & Achaz, G. (2021). ASAP: Assemble species by automatic partitioning. Molecular Ecology Resources, 21, 609–620. https://doi.org/10.1111/1755-0998.13281
- QGIS.org. (2020). QGIS Geographic Information System. Open Source Geospatial Foundation Project (3.10.1) [Computer software]. http://qgis.org
- Ratnasingham, S., & Hebert, P. D. N. (2007). BOLD: The Barcode of Life Data System (www.barcodinglife.org). Molecular Ecology Notes, 7, 355–364. https://doi.org/10.1111/j.1471-8286.2006.01678.x
- Raupach, M. J., & Wägele, J.-W. (2006). Distinguishing cryptic species in Antarctic Asellota (Crustacea: Isopoda)—A preliminary study of mitochondrial DNA in Acanthaspidia drygalskii. Antarctic Science, 18, 191–198. https://doi.org/10.1017/S0954102006000228
- Rex, M. A., & Etter, R. J. (2010). Deep-sea biodiversity: Pattern and scale. Harvard University Press.
- Rex, M. A., McClain, C. R., Johnson, N. A., Etter, R. J., Allen, J. A., Bouchet, P., & Warén, A. (2005). A Source‐Sink Hypothesis for Abyssal Biodiversity. The American Naturalist, 165, 163–178. https://doi.org/10.1086/427226
- Riehl, T., & Kühn, M. A. L. (2020). Uniting what belongs together—Reevaluation of the isopod species Macrostylis grandis and M. ovata using ontogenetic, morphological and genetic evidence. Progress in Oceanography, 181, 102238. https://doi.org/10.1016/j.pocean.2019.102238
- Riehl, T., Brenke, N., Brix, S., Driskell, A., Kaiser, S., & Brandt, A. (2014). Field and laboratory methods for DNA studies on deep-sea Isopod Crustaceans. Polish Polar Research, 35, 203–224. https://doi.org/10.2478/popore-2014-0018
- Riehl, T., Lins, L., & Brandt, A. (2018). The effects of depth, distance, and the Mid-Atlantic Ridge on genetic differentiation of abyssal and hadal isopods (Macrostylidae). Deep Sea Research Part II: Topical Studies in Oceanography, 148, 74–90. https://doi.org/10.1016/j.dsr2.2017.10.005
- Riehl, T., Wilson, G. D. F., & Hessler, R. R. (2012). New Macrostylidae Hansen, 1916 (Crustacea: Isopoda) from the Gay Head-Bermuda transect with special consideration of sexual dimorphism. Zootaxa, 3277, 1–26. https://doi.org/10.11646/zootaxa.3277.1.1
- Riehl, T., Wilson, G. D. F., & Malyutina, M. V. (2014). Urstylidae — a new family of abyssal isopods (Crustacea: Asellota) and its phylogenetic implications. Zoological Journal of the Linnean Society, 170, 245–296. https://doi.org/10.1111/zoj.12104
- Riehl, T., Wölfl, A.-C., Augustin, N., Devey, C. W., & Brandt, A. (2020). Discovery of widely available abyssal rock patches reveals overlooked habitat type and prompts rethinking deep-sea biodiversity. Proceedings of the National Academy of Sciences of the United States of America, 117, 15450–15459. https://doi.org/10.1073/pnas.1920706117
- Rivera, A. S., & Oakley, T. H. (2009). Ontogeny of sexual dimorphism via tissue duplication in an ostracod (Crustacea). Evolution & Development, 11, 233–243. https://doi.org/10.1111/j.1525-142X.2009.00323.x
- Ruhl, H. A., Ellena, J. A., & Smith, K. L. (2008). Connections between climate, food limitation, and carbon cycling in abyssal sediment communities. Proceedings of the National Academy of Sciences of the United States of America, 105, 17006–17011. https://doi.org/10.1073/pnas.0803898105
- Sanger, F., Nicklen, S., & Coulson, A. R. (1977). DNA sequencing with chain-terminating inhibitors. Proceedings of the National Academy of Sciences of the United States of America, 74, 5463–5467. https://doi.org/10.1073/pnas.74.12.5463
- Sars, G. O. (1899). An account of the Crustacea of Norway, with short descriptions and figures of all the species (Vol. 2 (1899) [Isopoda], pp.1–516). https://www.biodiversitylibrary.org/item/100338
- Schindelin, J., Arganda-Carreras, I., Frise, E., Kaynig, V., Longair, M., Pietzsch, T., Preibisch, S., Rueden, C., Saalfeld, S., Schmid, B., Tinevez, J.-Y., White, D. J., Hartenstein, V., Eliceiri, K. W., Tomancak, P., & Cardona, A. (2012). Fiji: An open-source platform for biological-image analysis. Nature Methods, 9, 676–682. https://doi.org/10.1038/nmeth.2019
- Schneider, C. A., Rasband, W. S., & Eliceiri, K. W. (2012). NIH Image to ImageJ: 25 years of image analysis. Nature Methods, 9, 671–675. https://doi.org/10.1038/nmeth.2089
- Sigwart, J. D., Blasiak, R., Jaspars, M., Jouffray, J.-B., & Tasdemir, D. (2021). Unlocking the potential of marine biodiscovery. Natural Product Reports, 38, 1235–1242. https://doi.org/10.1039/d0np00067a
- Silva, C. N. S., Murphy, N. P., Bell, J. J., Green, B. S., Duhamel, G., Cockcroft, A. C., Hernández, C. E., & Strugnell, J. M. (2021). Global drivers of recent diversification in a marine species complex. Molecular Ecology, 30, 1223–1236. https://doi.org/10.1111/mec.15780
- Stewart, H. A., & Jamieson, A. J. (2018). Habitat heterogeneity of hadal trenches: Considerations and implications for future studies. Progress in Oceanography, 161, 47–65. https://doi.org/10.1016/j.pocean.2018.01.007
- Taylor, M. L., & Roterman, C. N. (2017). Invertebrate population genetics across Earth’s largest habitat: The deep-sea floor. Molecular Ecology, 26, 4872–4896. https://doi.org/10.1111/mec.14237
- Tyler, P. A. (2002). Deep-sea eukaryote ecology of the semi-isolated basins off Japan. Journal of Oceanography, 58, 333–341. https://doi.org/10.1023/A:1015817910449
- Vrijenhoek, R. C. (2009). Cryptic species, phenotypic plasticity, and complex life histories: Assessing deep-sea faunal diversity with molecular markers. Deep Sea Research Part II: Topical Studies in Oceanography, 56, 1713–1723. https://doi.org/10.1016/j.dsr2.2009.05.016
- Watling, L., Guinotte, J., Clark, M. R., & Smith, C. R. (2013). A proposed biogeography of the deep ocean floor. Progress in Oceanography, 111, 91–112. https://doi.org/10.1016/j.pocean.2012.11.003
- Wilson, G. D. F. (1981). Taxonomy and postmarsupial development of a dominant deep-sea eurycopid isopod (Crustacea). Proceedings of the Biological Society of Washington, 94, 276–294.
- Wilson, G. D. F., & Hessler, R. R. (1987). Speciation in the deep sea. Annual Review of Ecology and Systematics, 18, 185–207. https://doi.org/10.1146/annurev.es.18.110187.001153
- Wolff, T. (1962). The systematics and biology of bathyal and abyssal Isopoda Asellota. Galathea Report, 6, 1–320.
- Zardus, J. D., Etter, R. J., Chase, M. R., Rex, M. A., & Boyle, E. E. (2006). Bathymetric and geographic population structure in the pan-Atlantic deep-sea bivalve Deminucula atacellana (Schenck, 1939). Molecular Ecology, 15, 639–651. https://doi.org/10.1111/j.1365-294X.2005.02832.x
- Zhang, J., Kapli, P., Pavlidis, P., & Stamatakis, A. (2013). A general species delimitation method with applications to phylogenetic placements. Bioinformatics (Oxford, England), 29, 2869–2876. https://doi.org/10.1093/bioinformatics/btt499