
 ?Mathematical formulae have been encoded as MathML and are displayed in this HTML version using MathJax in order to improve their display. Uncheck the box to turn MathJax off. This feature requires Javascript. Click on a formula to zoom.
ABSTRACT
Extant literature has examined intangible assets at firm and macro-levels but lacks their comprehensive analysis at territorial level. Yet, large discrepancies exist between regions, which cannot be attributed to micro-level variations alone, or observed from a higher level of aggregation to countries. We examine regional economic implications of intangible capital focusing on different sets of regional intangible assets. We build a combined dataset at the European regional level and perform spatial regression analysis accounting for cross-region interdependence. Results indicate significant effects of intangibles and the importance of their complementary relationships for regional development. Implications for research and policy making are derived.
1. Introduction
With the increase in globalisation and competition, the relative importance of physical resources as drivers of economic growth is decreasing, and “soft” production factors, or intangible assets, such as those related to knowledge and competencies, technology and research and development, become the major differentiating and generating factors of competitiveness (Suriñach & Moreno, Citation2012). Intangible factors currently account for 90% of assets of S&P 500 top list, according to Ocean Tomo’s Intangible Assets value study.Footnote1 The share of intangible assets in firms has shown to be rapidly increasing over the last years relative to tangible assets, which confirms the importance of accounting for intangibles in the analysis of performance and productivity determinants (Dettori et al., Citation2012; Marrocu et al., Citation2009). Intangible assets contribute to productivity and growth within the firm, for example,, through human capital, organisational abilities, R&D activities and brand equity, as well as have implications to a broader community and economy, such as through local externalities, innovation and entrepreneurship, institutional system, social capital and trust, among others (Suriñach & Moreno, Citation2012). Intangibles allow to utilise resources more efficiently through accumulation of knowledge and information via learning and innovation (Melachroinos & Spence, Citation2014).
Empirical evidence suggests that intangible assets tend to be distributed nonhomogeneously across space, and there are large discrepancies between intangible inputs and economic development across geographical units (e.g., Capello et al., Citation2011; Melachroinos & Spence, Citation2019). Regional differences have been observed to be larger and more persistent compared to cross-country differences (Magrini, Citation2004). Being different, regions are also closely connected to each other by knowledge flows and spillover effects (Suriñach & Moreno, Citation2012). Regional economic growth may be associated with high level of intangible capital, or territorial/relational proximity to it (Melachroinos & Spence, Citation2014). In this regard, a regional focus represents a fruitful and relevant perspective for unveiling territorial aspects of intangible assets, and regional characteristics become important considerations when analysing intangibles and explaining their economic implications. Regions are viewed as catalysers of local as well as national economic development and growth, and scholars and policymakers are increasingly searching for policies to promote regional development. In this regard, identification, understanding and evaluation of the key factors of regional development are of paramount importance (Schiuma et al., Citation2008), and intangible assets as significant drivers of productivity growth are likely to promote competitiveness in the regions where they are concentrated.
Although there is recognition of the necessity of regional level for better understanding intangibles’ effects, empirical studies investigating sub-nations as units of analysis are scarce. A number of those are focusing on separate intangible factors, such as education and R&D (Dreger et al., Citation2013), human and social capital (Dańska-Borsiak & Laskowska, Citation2014), or human, social and technological capital (Dettori et al., Citation2012). Among different kinds of intangible assets, human capital and knowledge-related processes are often included as a determinant of economic performance, and recently scholars’ attention has been paid to social factors as relevant variables in the context of regions (Dettori et al., Citation2012). However, despite important advances in economic implications of intangibles provided by regional studies, the full territorial effect of intangible capital remains elusive (Melachroinos & Spence, Citation2014). As Dreger et al. (Citation2013) note, because single assets are only elements of the whole bundle of intangible assets and cannot fully measure the overall effect of intangibles, an integrative approach and the impact of further intangible assets beyond human capital should not be neglected.
Furthermore, a number of studies concentrate on the analysis of regions within a single country, utilising local data. The examples include the study of intangible factors and spatial relationships across regions in Poland (Dańska-Borsiak & Laskowska, Citation2014), the analysis of intangible assets impacts on regional productivity disparities in Great Britain (Melachroinos & Spence, Citation2014) or the investigation of intangible capital in Chinese regional economies (Li & Wu, Citation2018). However, few attempts have been made to build an integrative framework that measures intangible capital of regions by capturing a wide range of its dimensions. A consistent conceptualisation and empirical measurement of regional intangibles are absent, and multiple approaches have been utilised. Dettori et al. (Citation2012) analyse in their work three intangible assets (human capital, social capital and technological capital) on regional economic growth in Europe and note that the data on them are not consistently available for all regions and time periods considered. Although the measurement and monitoring of intangible assets have been progressed over the past years, interregional data remain non-established, as well as few relationships have been tested between intangibles and regional economic development (Melachroinos & Spence, Citation2014; Suriñach & Moreno, Citation2011, Citation2012). The lack of homogenous, comprehensive and comparative data on intangible assets collected and available for regions is also among the reasons of a low share of regional studies relative to cross-country research. According to Suriñach and Moreno (Citation2011), there is a need to develop more and better regional databases in order to improve the analysis of effects of intangible capital on regional economic performance. Moreover, a better understanding of the role of various dimensions of intangible capital for regional development is required by adopting an integrative approach to regional intangibles that build upon and extend existing studies conducted on regional as well as firm/industry and country levels.
In this paper, we move intangible capital research towards greater consideration of regional level of analysis to examine intangible assets-performance linkage. This is in line with the necessity of extending the research agenda, beyond the microeconomic economic dimensions of economic performance (Dumay, Citation2013; Lin & Edvinsson, Citation2021).
This paper investigates one of the close environments for organisations taking a regional focus. We consider intangible assets holistically and analyse how different sets of intangible assets are simultaneously related to regional economic development in terms of GDP, taking into account spatial interactions. For that, we build a dataset of European regions applying NUTS classification (The Nomenclature des Unités Territoriales Statistiques) and collecting the data on assets (tangible and intangible) and other regional characteristics from official statistical databases as well as constructing a composite indicator of regional intangible capital.
The reminder of the paper is organised as follows. First, it outlines state of the art in regional intangibles research and theoretical foundations. It then presents the methodology, data and measurement of variables. This is followed by analytical approaches and results. Finally, discussion and implications are provided.
2. Literature review
2.1. Understanding regional intangibles
Although there is no consensus on the definition of intangible capital, it is generally viewed as a set of non-material factors that contribute to the production of goods and services and are expected to enhance subsequent performance and generate future economic benefits to the entities that control their deployment (Eustace, Citation2000). Intangibles encompass a broad range of factors and activities, and common examples include intellectual property (e.g., patents, trademarks, copyrights), computer software and databases, brand recognition and other non-material assets. In knowledge-based economy, firms with limited tangible assets have an opportunity to benefit from investing in valuable intangible assets (Velibeyoglu & Yigitcanlar, Citation2010).
Reviewing intangible capital research over the past 20 years, Ståhle et al. (Citation2015) denote several distinct research streams, moving from the analysis of individual factors (e.g., technological know-how, innovation, human capital) and their impacts on productivity with tools of augmentation (e.g., Romer, Citation1986; Yoo, Citation2003) towards national accounting framework (Corrado et al., Citation2009) and the concept of intellectual capital (e.g., Bounfour, Citation2003b; Bounfour & Edvinsson, Citation2005; Edvinsson & Malone, Citation1997). Other contributions to estimate intangible assets are provided by Lev and Radhakrishnan (Citation2005) and Piekkola (Citation2016). Following the company-specific analyses, evaluation of intangible capital has been expanded to nations and territories (e.g., Bontis, Citation2004; Bounfour & Edvinsson, Citation2005; Lin & Edvinsson, Citation2011). For example, an approach to measuring intangible capital of nations proposed by Edvinsson, Lin, Ståhle, and Ståhle (ELSS model; Ståhle et al. (Citation2015)) is theoretically based on intellectual capital tradition, covers a wide spectrum of intangibles within human capital, market capital, process capital and renewal capital, and utilises national statistics provided by reliable world organisations. Taking a more systemic point of view, we can refer here to what Paul Romer referred to as “wetware”, a key component for building nations’ wealth (Romer, Citation2003). It is also worth considering the role of intangibles in a more system dynamics approach (Forrester, Citation1973).
With regard to regional context, a stream of literature on territorial capital provides a valuable perspective. Scholars recognise that each region has a specific territorial capital that is distinct from other regions (Camagni & Capello, Citation2013; Fratesi & Perucca, Citation2018, Citation2019; Mazzola et al., Citation2018). Territorial capital represents a set of localised assets, both tangible and intangible, accumulated through time in a specific territory. Different sets of factors have been examined as facets of territorial capital, including the area’s geographical location, natural resources, traditions, quality of life, human capital, innovations, business networks, and regulations, among others (Camagni & Capello, Citation2013). A theoretical taxonomy of components of territorial capital developed by Camagni (Citation2009) is constructed along the two dimensions of rivalry (from low to high) and materiality (tangible goods, mixed goods and intangible goods). For example, intangible dimension includes such components as human capital (entrepreneurship, creativity, private know-how), relational capital (cooperation capability, collective action capability, collective competencies) and social capital (institutions, behavioural models, values, trust, reputation) (Camagni, Citation2009). A literature review of territorial capital research using “capital frameworks” as possible directions to explore the dimensions of territorial capital has shown that researchers identified and distinguished between different types of capital, with the most emphasis put on the role of human and social capital, followed by cultural and environmental capital (Tóth, Citation2015). However, there is no consensus on which set of variables or proxies should be involved in territorial capital analysis, and multiple approaches have been utilised.
Based on the two streams of literature, research on regional intangibles can be viewed at an intersection of intangible capital and territorial capital research. The literature review on the topic indicates a lack of consistent approach to measuring intangible capital at the regional level. Depending on research objective and data availability, a number of studies focused on one country (e.g., Li & Wu, Citation2018; Mazzola et al., Citation2018; Melachroinos & Spence, Citation2019) or on particular types of intangibles or forms of capitals (e.g., Dreger et al., Citation2013; Kaasa, Citation2018) using European data, national statistics or creating own measures. Building upon existing research conducted on firm/industry and country/region levels, this study sets out to extend consideration of intangible capital to regional level of analysis and various types of intangibles, as well as to provide a better understanding of the role of intangibles for regional development within the European context.
2.2. Intangible effects on regional economy
Existing studies provide some insights on the relationship between intangible assets at the regional level and economic performance. It is supposed that different kinds of intangibles would enhance the level of regional development by creating a more favourable economic environment.
To explore the contribution of intangibles to regional performance, we adopt a holistic and dynamic approach, based on the IC-dVAL framework, which has been notably mobilised for the analysis of national innovation systems in Europe (Bounfour, Citation2003a).
In line with the adopted approach, we group intangibles based on whether they can be viewed as inputs or as process, which jointly lead to outputs. For input variables, human capital (population and labour force with higher education, and health of population) and renewal capital (employment in knowledge-intensive activities and investments in R&D) are used. Human capital encompasses capacity and capability of people, and is significant in fostering economic growth due to knowledge accumulation and the presence of capabilities that foster absorption of innovations (Mazzola et al., Citation2018). Renewal capital refers to innovation and knowledge creation (Ståhle et al., Citation2015), and is beneficial for productivity due to competitiveness, improvement in products and creation of new industries (Dreger et al., Citation2013). We test the direct effects of human capital and renewal capital on regional performance and hypothesise that:
Hypothesis 1: (a) Human capital and (b) renewal capital are positively related to regional performance.
Human and renewal capitals do not exist in isolation since individual abilities and skills are deeply embedded into institutional, technological, social and entrepreneurial contexts in which they operate (Mazzola et al., Citation2018). In this study, institutional capital, ICT infrastructure capital, social capital and entrepreneurship capital are utilised as process variables as they facilitate operational functionality of the region and represent environments in which economic actors operate to create value. Institutional capital represents governmental quality and political stability, which help foster productivity by securing property rights, enforcing contracts and lowering transaction costs (Kaasa, Citation2018). ICT infrastructure capital encompasses devices, procedures and digital infrastructure development that foster interaction, information sharing and diffusion. Social capital deals with social norms, values and trust (cognitive social capital) as well as networks and associations (structural social capital) (Mazzola et al., Citation2018; Putnam et al., Citation1994), which help improve the efficiency of the society by facilitating the coordination and cooperation between actors (Dettori et al., Citation2012). Entrepreneurship capital refers to the capacity of a society to generate new firms and plays a role in creating a favourable environment for innovation and growth (Audretsch & Keilbach, Citation2005).
Examination of complementary effects of intangibles has been recently called for (e.g., Delbecque et al., Citation2015; Dettori et al., Citation2012; Guo-Fitoussi et al., Citation2019; Peiró-Palomino, Citation2016), since it is argued that complementarities may arise between the intangible assets, and the effect of one asset may be reinforced by the effect of another one, which makes it difficult to isolate the individual effects of intangibles. We test the joint effects of intangible assets on performance of regions and hypothesise that:
Hypothesis 2: There are complementary effects of intangible assets on regional performance. (a) Institutional capital, (b) ICT infrastructure capital, (c) social capital and (d) entrepreneurship capital positively moderate the effects of human capital and renewal capital on regional performance.
The overall research model of the study is presented in .
Figure 1. Research model.
3. Method
3.1. Data
To analyse intangible assets in the regional context, a combined dataset has been built from multiple data sources at the European regional level. In the context of Europe, intangible assets are viewed as key factors in growth policies and are promoted for achieving regional competitiveness and welfare (Peiró-Palomino, Citation2016). To classify regions, a common classification of territorial units for statistics (NUTS – Nomenclature des Unités Territoriales Statistiques) provided by Eurostat is followed, which divides the economic territory of the EU into hierarchical levels.Footnote2 The NUTS classification is a hierarchical system, which distinguishes between three levels: NUTS 1 captures major socio-economic regions, NUTS 2 captures basic regions for the application of regional policies, and NUTS 3 captures small regions for specific diagnoses. This study utilises NUTS2 level of classification as it allows to make finer comparisons as well as has data available in most statistical databases. The latest NUTS classification includes 28 European countries that are divided into 281 NUTS2 regions (excluding Extra-Regio). The NUTS classification is defined only for the Member States of the EU. This study also added two European Free Trade Association (EFTA) countries, not included in the classification, but which, in agreement with Eurostat, have a defined coding of statistical regions (Norway and Switzerland, 7 NUTS2 regions each). The total number of NUTS2 regions is equal to 295.
The data on assets (tangible and intangible) and other regional characteristics have been drawn from Eurostat Regional Database,Footnote3 European Quality of Government Index (EQGI),Footnote4 European Social Survey (ESS)Footnote5 and Regional Innovation Scoreboard (RIS).Footnote6
3.2. Measurement
3.2.1. Regional intangible capital
For measuring regional intangible capital, the study relies on existing approaches and empirical data availability. It assesses intangible capital of regions as composed of six key forms of capitals that describe different aspects of intangibles: human capital (capacity and capability of people), renewal capital (capacity for knowledge creation, exploitation and innovation), institutional capital (regulatory quality and government effectiveness), social capital (trust and networks), ICT infrastructure capital (devices and procedures employed in telecommunications and information technology to foster interaction) and entrepreneurship capital (capacity to generate entrepreneurial activity).
The forms of capitals and measures have been adopted from existing literature in the field. For example, human capital was assessed as a share of high educated residents over the total population in Fratesi and Perucca (Citation2018, Citation2019), Peiró-Palomino (Citation2016), Dettori et al. (Citation2012), and Dańska-Borsiak and Laskowska (Citation2014) included health indicators to human capital measure. Renewal capital was assessed, among other indicators, as R&D spending and research indicators at national level in Ståhle et al. (Citation2015). Social capital was measured as trust, networks and civic participation, and government quality was assessed using the European Quality of Government Index in Kaasa (Citation2018). Entrepreneurship was measured in Camagni and Capello (Citation2013) as a share of self-employment on total employment. Forms of regional capital, indicators and data sources used in this study are presented in .
Table 1. Regional intangible capital measures and data sources.
3.2.2. Dependent and control variables
Regional performance was assessed using regional gross domestic product (GDP) per capita and used as a dependent variable. This measure is closely related to regional welfare (Peiró-Palomino, Citation2016). The measure is obtained from Eurostat regional database.
The study uses control variables of labour and capital investment. The former is measured by labour force expressed by economic activity rates of population aged between 15 and 64 year old. The latter is measured by gross fixed capital formation that covers, in particular, machinery and equipment, vehicles, dwellings and other buildings. Natural logarithm of the measure was taken. Both indicators are retrieved from Eurostat regional database.
3.2.3. Imputation techniques and composite indicators
Given the restrictions of regional data availability and a limited number of observations (NUTS 2 regions), the study followed an imputation algorithm for missing values on the variables based on the regional data for previous year and/or higher level aggregate if available (NUTS 1 regions). In particular, if regional data were available for the previous year, the ratio between the corresponding NUTS level and that at a higher aggregate level (NUTS 1 for NUTS 2 regions) for the previous year was multiplied with the current value at the higher aggregate level. If this was not possible, the regional data of the previous year were used. If previous year data were not available, the higher level aggregate was used for the current year, and if not possible, for the previous year. If no regional and no higher level data were available for the current and previous year, missing data were not imputed.
As five countries in our sample – Cyprus, Estonia, Latvia, Luxembourg, and Malta – consist of only one NUTS2 and one NUTS1 regions (excluding Extra-Regio), the country’s values of the variables are unitised.
For data imputation using the previous year and, therefore, if it was based on earlier NUTS classifications, the NUTS codes were recoded to the latest classification to preserve consistency. This concerns several regions of such countries as Finland, France, Hungary, Ireland, Lithuania, Poland, Slovenia and UK.
In ESS dataset, the variables were measured at the individual level, and, therefore, the data were aggregated to the regional level using specific post-stratification weights to reduce the sampling error and potential non-response bias, according to the recommendations in ESS methodology report.Footnote7
For the calculation of composite indicators (forms of capital) and regional intangible capital index, the data have been normalised. To follow more closely a normal distribution, individual indicators have been transformed using a square root transformation if the degree of skewness of the raw data exceeded 1. Following this transformation, data were normalised using the min-max procedure so that the normalised scores ranged from 0 to 1.
The composite indicators are calculated as the unweighted average of the normalised scores of the indicators. The regional intangible capital (RIC) index is calculated as an average of six forms of capital that describe different aspects of intangibles at the regional level.
4. Results
4.1. Regional intangible capital and performance in the European context
The regional intangible capital index allows regions to monitor and assess their intangible capital in comparison to other regions, and provides a European perspective on the regional intangibles in the EU. displays a map that contains information on the spatial distribution of the regional intangible capital index across Europe. The index is based on six forms of capital which include human capital, renewal capital, institutional capital, social capital, ICT infrastructure capital and entrepreneurship capital.
Figure 2. Regional intangible capital index across European NUTS 2 regions.
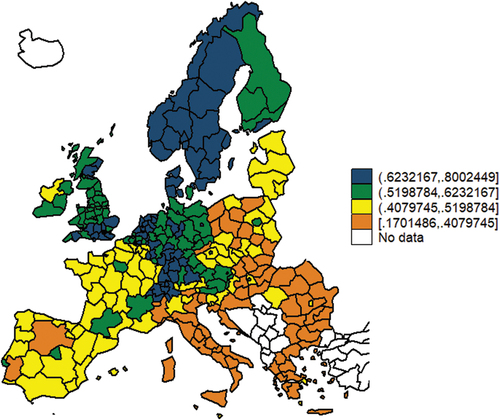
In general, there is a difference between the central regions and the peripheral regions. In particular, the regions from Eastern European countries, Greece and the south of Italy obtain lower scores in overall intangible capital index. In contrast, most of the regions in Scandinavian countries, Germany, UK, the Netherlands and Switzerland, in general have highest scores.
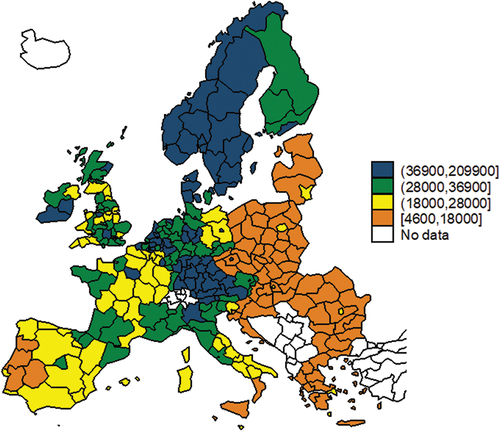
With regard to regional performance, displays the regional values of GDP per capita. Similar to intangible capital, remarkable differences are observed between the central regions and the periphery, with Northern and Western European regions scoring higher on economic development compared to Eastern and Southern European regions.
Figure 3. GDP per capita across European NUTS 2 regions.
4.2. Spatial analysis of direct and complementary effects of intangibles
To test regional economic implications of intangible assets, a set of regression analyses was performed. In the model, we estimated the relationship between six different regional intangibles and regional performance, following The IC-dVAL model (). Direct and complementary effects of intangibles were analysed. Complementary effects were tested using the moderated regression analysis. In particular, human capital and renewal capital were included in the model as independent variables, institutional capital, social capital, ICT infrastructure capital and entrepreneurship capital, which can be considered as the context in which economic actors operate, were used as moderator variables, and regional performance in terms of GDP per capita was used as a dependent variable, transformed by taking the natural logarithm to decrease the variability of data and make data conform more closely to the normal distribution. The following equation was estimated:
where Y is GDP per capita, Controls include two variables of labour and capital, IV is independent variables of human capital and renewal capital, Moderator include variables of institutional capital, social capital, ICT infrastructure capital or entrepreneurship capital, IV × Moderator is an interaction term between independent variable and the moderator, the subscript i denotes NUTS 2 region, and ɛ is an error term.
Descriptive statistics and correlation matrix of the variables are presented in .
Table 2. Descriptive statistics.
Table 3. Correlation matrix.
Given the spatial nature of the data and geographic observations (regions), at the first stage of the analysis, the data were examined for the presence of spatial autocorrelation. Spatial cross-region interdependence of the variables can be expected by observing the maps with spatial distribution (see ): higher and lower levels on variables are grouped around particular geographical areas. For example, there can be observed a cluster of lower GDP per capita in the Eastern European countries and a cluster of higher GDP per capita in Western Europe.
To account formally for spatial interdependence, a spatial distance weight matrix (W) was constructed using the coordinates of NUTS 2 regions.Footnote8 The matrix contains distance of each region with all other regions. Spatial interdependence suggests that regions located closer to each other (smaller distance) generally have higher interdependency than those located farther from each other (larger distance) (Dreger et al., Citation2013). In the spatial distance weight matrix, a widely accepted approach of inverse of the distance and normalisation by rows was used, so that each row sums to one, and the closer regions get bigger weights.
A test of spatial autocorrelation was performed by calculating Global Moran’s I statistic, which allows to access the similarity of the neighbouring values. The significant value of the Moran’s I statistic (p-value 0.000) leads to the rejection of null hypothesis of no cross-section dependence and confirms the presence of spatial autocorrelation in the regional data. It shows that high or low values tend to group together. Therefore, spatial regression analysis, rather than OLS regression, was selected to estimate the models.
Furthermore, in order to choose the type of spatial model to estimate, that is, select between the spatial error model (SEM) and spatial autoregressive model (SAR), the Lagrange Multiplier-error and LM-lag test statistics, as well as the robust versions of them, were used (Anselin et al., Citation1996). A more significant test statistic with the lower p-value prescribes the choice of the model. The LM test results show that both LM-error and LM-lag test statistics are significant (p-values 0.000), thus robust values were considered. As robust test statistic is more significant for the SEM model (p-value 0.000 in SEM versus p-value 0.056 in SAR model), the decision was made in favour of SEM model for using in the analysis. This model assumes that the shock on one region, that is, the error term, is also felt by the neighbouring regions. Spatial analysis was performed using the spatial econometrics program created by Pisati (Pisati, Citation2001). If the observation of the spatial distribution has missing values, the model cannot be estimated, thus only observations with non-missing values on all variables were used.
At the second stage, the spatial error regression analysis (SEM) was run. GDP per capita was regressed on direct and complementary effects of regional intangibles. The analysis was performed in several steps: first, control variables were included (estimation 1), then the main effects of human capital and renewal capital were added (estimation 2), followed by the two-way interaction effects with institutional capital, social capital, ICT infrastructure capital and entrepreneurship capital (estimations 3–6). The restricted estimations were compared with unrestricted estimations by observing variation in Akaike Information Criterion (AIC) statistics. Since intangibles are highly correlated with each other, in order to reduce concerns of multicollinearity in the model, each interaction term was estimated in separate regressions. Furthermore, in order to facilitate interpretation of the results and reduce potential multicollinearity in more complex models with interaction effects, the respective variables were mean centred prior to calculating the interaction terms (Aiken & West, Citation1991). The results of spatial regression for regional intangibles are presented in for direct and moderated effects of human capital, and for direct and moderated effects of renewal capital.
Table 4. Spatial regression results for regional intangibles: Direct and moderated effects of human capital.
Table 5. Spatial regression results for regional intangibles: Direct and moderated effects of renewal capital.
Both control variables are positively and significantly related to GDP per capita (estimation 1; capital: b = 0.155, p < 0.001; labour: b = 0.041, p < 0.001). The results show positive direct effects of human capital (estimation 2: b = 3.069, p < 0.001) and renewal capital (estimation 2: b = 0.612, p < 0.05) on regional GDP per capita, after controlling for labour force and gross fixed capital formation. These results support the hypotheses 1a and 1b. This demonstrates that capacity and capability of people as well as capacity for knowledge creation, exploitation and innovation in the region are important drivers of regional economic performance.
Furthermore, the results revealed significant moderation effects of regional intangibles. In particular, institutional capital positively moderates the relationship between both human (, estimation 3: b = 5.421, p < 0.001) and renewal (, estimation 3: b = 2.994, p < 0.01) capitals, providing support to the hypothesis 2a. This signifies that in regions with well-developed regulatory institutions and government effectiveness, the positive effects of human and renewal capitals are stronger than in regions with less developed institutions.
Further, ICT infrastructure capital was found to have a positive direct effect (, estimation 4: b = 0.647, p < 0.01; , estimation 4: b = 0.753; p < 0.01) and a positive moderation effect with renewal capital (, estimation 4: b = 2.550, p < 0.05). This finding partly supports the hypothesis 2b. For innovation activities in regions, many of which are nowadays in ICT and digital technologies, the development of devices and procedures in telecommunications and information technology, and provision of all households with access to the internet is of particular importance.
With regard to social capital, results show its direct positive effect (, estimation 5: b = 0.809, p < 0.001; , estimation 5: b = 0.765; p < 0.001), but not the moderation effect, which does not allow to support the hypothesis 2 c. This means that personal trust and networks in a society are positively related to regional economic performance in general for all levels of human and renewal capital in regions.
Finally, results show a positive moderation effect of entrepreneurship capital with both human (, estimation 6: b = 5.758, p < 0.001) and renewal (, estimation 6: b = 2.859, p < 0.01) capitals, which provides support to hypothesis 2d. Intriguingly, results reveal a negative direct effect of entrepreneurship capital (, estimation 6: b = −0.832, p < 0.001; , estimation 6: b = −0.825; p < 0.001). One of the explanations may be the measurement of entrepreneurship capital as overall entrepreneurial activity in the region, without accounting separately for motivations to create a business, such as those driven by opportunity or necessity. There are substantial differences between the two: while opportunity-driven entrepreneurs are pulled to entrepreneurship by opportunity, a desire of independence or increase in income, necessity-driven entrepreneurs are pushed to entrepreneurship out of necessity because they have no better choices for work, or sought only to maintain their income. These different types of entrepreneurship have different implications for economic performance. According to Global Entrepreneurship Monitor (GEM),Footnote9 countries, in which improvement-driven opportunity entrepreneurship is prevalent, are primarily innovation-driven countries, and thus opportunity-driven entrepreneurship is expected to positively correlate with GDP per capita, while necessity entrepreneurship may show the opposite association. A more detailed examination of different types of entrepreneurship is a fruitful avenue for future research. In spite of the direct effect, the results revealed a positive significant interaction effect of entrepreneurship capital with human capital and renewal capital, demonstrating that regional capacity to generate entrepreneurial activity complements the effects of human capital, innovation and exploitation to enhance economic performance.
Furthermore, when estimating the model, lambda is highly significant (p < 0.001), which shows that there is regional interdependence in the data, and the value of variables is also influenced by the neighbouring regions. In order to compare the fit of the models, Akaike Information Criterion (AIC) is used. Observation of AIC statistic for different estimations shows that it decreases from estimation 1 to estimation 2, and from estimation 2 to estimations 3–6. Therefore, it can be concluded that the inclusion of direct and complementary effects of intangible capitals improves the data fit, and the spatial error regression fits the data. The overall results indicate spatial dependence among variables, confirming the existence of external spillovers from other regions, which reinforce the effects of each region’s own intangible factors.
5. Concluding remarks
The purpose of the study was to increase our understanding of intangibles and their economic implications, focusing on the regional level. Regional context is one of the closest environments in which organisations and other economic actors operate. This study adopted an integrative approach towards examination of regional intangibles and covered multiple types of intangibles including human capital, renewal capital, institutional capital, social capital, ICT infrastructure capital and entrepreneurship capital. The study also adopted a holistic geographical perspective by analysing regions across Europe.
Methodologically, a regional database on NUTS 2 level was created composed of multiple data sources such as Eurostat Regional Database, European Quality of Government Index – EQGI, European Social Survey – ESS, and Regional Innovation Scoreboard – RIS. Regional intangible capital index was assessed by six different forms of capitals. The descriptive analysis and spatial distribution of regional intangible capital as well as economic performance across Europe show regional interdependence with regard to intangibles and performance. There were also observed notable differences in values between the central regions and the periphery, with Western and Northern European regions scoring higher on most intangibles and economic development compared to Eastern and Southern European regions. Spatial regression analysis was performed to investigate the relationship between six regional intangibles and economic performance, accounting for both direct and complementary effects.
Results revealed positive effects of human, renewal, ICT infrastructure and social capitals. Intriguingly, entrepreneurship capital, measured as an overall entrepreneurial activity in the region, was found to have a negative effect. Furthermore, results revealed significant complementary interactions of human capital and renewal capital with institutional, entrepreneurship and ICT infrastructure capitals, suggesting for policymakers the importance of simultaneous development of multiple intangibles in a region.
The study offers several contributions to the literature. First, it builds upon and extends prior research on intangibles by combining the literature streams on intangible capital and territorial capital. By doing so, it moves intangible capital research from national level towards greater consideration of regional level of analysis to examine the relationship between intangibles and economic performance. National-level analyses often rely on monetary values, based on national accounts’ data on intangible investment, while regional studies use statistical indicators that proxy for intangible endowments at territorial level. The two approaches have different advantages and drawbacks: monetary values are, in general, more narrowly defined, but the statistical indicators have advantages from the theoretical and conceptual point of view (Ståhle et al., Citation2015) and allow for broader intangible definitions. Although the two approaches yield different intangible categories, they have some similarities. For example, human capital measure used in this study intends to capture a similar concept as education expenditure at the national level, as well as renewal capital is similar to R&D spending. In this sense, our findings support the importance of these types of expenditures as drivers of productivity. Moreover, our results allowed to identify other intangible factors that play a prominent role and that are difficult to capture at national level with monetary values. These factors represent phenomena that happen at more granular level and that characterise differences between regions. Our study analyzes a broad range of territorial units in the context of Europe to uncover the driving intangible factors of regional development.
Second, the study attempts to present a coherent and integrative approach to a wide spectrum of regional intangible assets that go beyond intangibles limited to human capital, R&D, IT and organisational competences. We found a large number of intangibles to affect regional output. In fact, most studies on regional intangibles consider only a single category or few categories (e.g., human capital or R&D spending) (e.g., Dreger et al., Citation2013; Kaasa, Citation2018). For example, Dettori et al. (Citation2012, p. 1411) in their notable study state that it “represents the first attempt aimed at assessing the effects of three kinds of intangible assets on the regional efficiency levels in Europe”. Our approach allowed us to evaluate at the same time many aspects, such as social capital, institutional capital, ICT infrastructure capital and entrepreneurship. Therefore, we found evidence that not only the most commonly considered resources such as human capital play an important role in improving regional efficiency, but there is wide spectrum of assets that are also relevant.
Third, our study examines both direct individual and complementary joint effects of intangibles. It is comprehensive in covering most intangibles and simultaneously accounts for economic, social and institutional facets of intangibles and their relationships. Important and original results are found when considering complementarities. For example, institutional and entrepreneurship capitals are found to positively moderate the relationship with both human and renewal capital, while ICT infrastructure capital – the relation with renewal capital. Also, whereas institutional and entrepreneurship capitals did not show direct positive effects on regional performance, their moderating effects are positive and significant. This gives insights on the comparative and complementary effects of different types of intangibles as determinants of regional level of economic performance in Europe.
Fourth, from the methodological standpoint, the study provides a unique and comprehensive dataset of intangible assets of European regions and proposes an integrative measure of regional intangible capital composed of six forms of capital, which to the best of our knowledge have not been studied simultaneously before. Furthermore, the dataset was created with the most recent data available and the measures go beyond investments data and include inputs (e.g., R&D expenditures), process (e.g., institutions), and outputs (e.g., GDP per capita) data, as well as are readily available from reliable statistical sources providing data at the regional level.
The results have policy implications and stress the importance of policy actions aimed at accelerating the accumulation of intangible assets in regions to boost local and national competitiveness and welfare. As for the policy implications, the study brings to the fore the importance for policymakers of considering intangibles’ contribution to economic growth holistically as well as by developing a reasoning in terms of constitutive pillars: Human capital, Social capital, Entrepreneurship capital among others. Such a reasoning allows to delineate the relative importance of each pillar but also their complementarities. Provided data and results allow also to develop a benchlearning process within European context. For decision-making, the resulting regional positioning allows indeed a comparison of performance for the indicated metrics, but more importantly the contextualisation of the observed performance.
As for the next steps, we can expect the research to be extended to cover a long-term tendencies of intangible investment. Exceptional crisis periods for investment – especially the Covid-19 period – should also considered for further research.
Disclosure statement
No potential conflict of interest was reported by the author(s).
Additional information
Funding
Notes
2. More information on NUTS classification is available at: https://ec.europa.eu/eurostat/web/nuts/background
3. Available at: https://ec.europa.eu/eurostat/data/database
4. Available at: https://qog.pol.gu.se/data/datadownloads/qog-eqi-data
5. Available at: https://www.europeansocialsurvey.org/data/download.html?r=8
7. ESS Round 8: European Social Survey (2018): ESS-8 2016 Documentation Report. Edition 2.1. Bergen, European Social Survey Data Archive, NSD – Norwegian Centre for Research Data for ESS ERIC. doi:10.21338/NSD-ESS8-2016
8. Geographical data on NUTS regions are available from Eurostat at:https://ec.europa.eu/eurostat/web/gisco/geodata/reference-data/administrative-units-statistical-units/nuts
9. Global Entrepreneurship Monitor (GEM). Available at: https://www.gemconsortium.org/ (accessed 12.08.2019)
References
- Aiken, L. S., & West, S. G. (1991). Multiple regression: Testing and interpreting interactions. Sage.
- Anselin, L., Bera, A. K., Florax, R., & Yoon, M. J. (1996). Simple diagnostic tests for spatial dependence. Regional Science and Urban Economics, 26(1), 77–104. https://doi.org/10.1016/0166-0462(95)02111-6
- Audretsch, D. B., & Keilbach, M. (2005). Entrepreneurship capital and regional growth. The Annals of Regional Science, 39(3), 457–469. https://doi.org/10.1007/s00168-005-0246-9
- Bontis, N. (2004). National intellectual capital index: A United Nations initiative for the Arab region. Journal of Intellectual Capital, 5(1), 13–39. https://doi.org/10.1108/14691930410512905
- Bounfour, A. (2003a). The IC‐dVAL approach. Journal of Intellectual Capital, 4(3), 396–413. https://doi.org/10.1108/14691930310487833
- Bounfour, A. (2003b). The management of intangibles, the organisation’s most valuable assets. Routledge.
- Bounfour, A., & Edvinsson, L. (2005). Intellectual capital for communities: Nations, regions, and cities (1st ed.). Butterworth-Heinemann.
- Camagni, R. (2009). Territorial capital and regional development. In R. Capello & P. Nijkamp (Eds.), Handbook of regional growth and development theories ( chapter 7, pp. 118–132). Edward Elgar.
- Camagni, R., & Capello, R. (2013). Regional competitiveness and territorial capital: A conceptual approach and empirical evidence from the european union. Regional Studies, 47(9), 1383–1402. https://doi.org/10.1080/00343404.2012.681640
- Capello, R., Caragliu, A., & Nijkamp, P. (2011). Territorial capital and regional growth: Increasing returns in knowledge use. Tijdschrift Voor Economische En Sociale Geografie, 102(4), 385–405. https://doi.org/10.1111/j.1467-9663.2010.00613.x
- Corrado, C., Hulten, C., & Sichel, D. (2009). Intangible capital and U.S. economic growth. Review of Income and Wealth, 55(3), 661–685. https://doi.org/10.1111/j.1475-4991.2009.00343.x
- Dańska-Borsiak, B., & Laskowska, I. (2014). Selected intangible factors of regional development: An analysis of spatial relationships. Comparative Economic Research, 17(4), 23–41. https://doi.org/10.2478/cer-2014-0030
- Delbecque, V., Bounfour, A., & Barreneche, A. (2015). Intangibles and value creation at the industrial level: Delineating their complementarities. In A. Bounfour & T. Miyagawa (Eds.), Intangibles, market failure and innovationperformance chapter 3, pp. 27–56. Cham: Springer.
- Dettori, B., Marrocu, E., & Paci, R. (2012). Total factor productivity, intangible assets and spatial dependence in the European regions. Regional Studies, 46(10), 1401–1416. https://doi.org/10.1080/00343404.2010.529288
- Dreger, C., Erber, G., & Wesker, H. (2013). Impacts of intangible assets on regional growth and unemployment. SSRN (pp. 1–56).
- Dumay, J. (2013). The third stage of IC: Towards a new IC future and beyond. Journal of Intellectual Capital, 14(1), 5–9. https://doi.org/10.1108/14691931311288986
- Edvinsson, L., & Malone, M. S. (1997). Intellectual capital: Realizing your company’s true value by finding its hidden brainpower (1st ed.). HarperBusiness.
- Eustace, C. (2000). The intangible economy impact and policy issues (Technical report). European Commission, Enterprise Directorate-General, Brussels.
- ESS Round 8: European Social Survey (2018). ESS-8 2016 Documentation Report (2.1 ed.). Bergen, European Social Survey Data Archive, NSD – Norwegian Centre for Research Data for ESS ERIC. https://doi.org/10.21338/NSD-ESS8-2016.
- Forrester, J. W. (1973). World dynamics (2nd ed.). Productivity Press.
- Fratesi, U., & Perucca, G. (2018). Territorial capital and the resilience of European regions. The Annals of Regional Science, 60(2), 241–264. https://doi.org/10.1007/s00168-017-0828-3
- Fratesi, U., & Perucca, G. (2019). EU regional development policy and territorial capital: A systemic approach. Papers in Regional Science, 98(1), 265–281. https://doi.org/10.1111/pirs.12360
- Guo-Fitoussi, L., Bounfour, A., & Rekik, S. (2019). Intellectual property rights, complementarity and the firm’s economic performance. International Journal of Intellectual Property Management, 9(2), 136–165. http://www.inderscience.com/offer.php?id=100213
- Kaasa, A. (2018). Intangible factors and productivity: Evidence from Europe at the regional level. Business and Economic Horizons, 14(2), 300–325. https://doi.org/10.15208/beh.2018.23
- Lev, B., & Radhakrishnan, S. (2005). The valuation of organization capital. In C. Corrado, J. Haltiwanger & D. Sichel (Eds.), Measuring capital in the new economy (pp. 73–110). University of Chicago Press.
- Li, Q., & Wu, Y. (2018). Intangible capital in Chinese regional economies: Measurement and analysis. China Economic Review, 51, 323–341. https://doi.org/10.1016/j.chieco.2017.07.002
- Lin, C.Y.Y., & Edvinsson, L. (2021). Reflections on JIC’s twenty-year history and suggestions for future IC research. Journal of Intellectual Capital,22(3), 439–457. https://doi.org/10.1108/JIC-03-2020-0082
- Lin, C.-Y.-Y., & Edvinsson, L. (2011). National intellectual capital: A comparison of 40 countries. Springer-Verlag.
- Magrini, S. (2004). Regional (di)convergence. In J. V. Henderson & J. F. Thisse (Eds.), Handbook of regional and urban economics (1st ed., Vols. 4, chapter 62, pp. 2741–2796). Elsevier.
- Marrocu, E., Paci, R., & Pontis, M. (2009). Intangible capital and firms productivity (Working Paper Number 2009/16). Centre for North South Economic Research (CRENoS).
- Mazzola, F., Lo Cascio, I., Epifanio, R., & Di Giacomo, G. (2018). Territorial capital and growth over the great recession: A local analysis for Italy. The Annals of Regional Science, 60(2), 411–441. https://doi.org/10.1007/s00168-017-0853-2
- Melachroinos, K. A., & Spence, N. (2014). The impact of intangible assets on regional productivity disparities in Great Britain. Environment and Planning A, 46(3), 629–648. https://doi.org/10.1068/a46236
- Melachroinos, K. A., & Spence, N. (2019). The spatial footprint of the knowledge economy: The role of intangible investment in shaping regional inequalities in Great Britain. Tijdschrift Voor Economische En Sociale Geografie, 110(4), 442–471. https://doi.org/10.1111/tesg.12360
- Peiró-Palomino, J. (2016). European regional convergence revisited: The role of intangible assets. The Annals of Regional Science, 57(1), 165–194. https://doi.org/10.1007/s00168-016-0767-4
- Piekkola, H. (2016). Intangible investment and market valuation. Review of Income and Wealth, 62(1), 28–51. https://doi.org/10.1111/roiw.12149
- Pisati, M. (2001). Tools for spatial data analysis. Stata Technical Bulletin,10(60), 21–37. http://www.stata.com/products/stb/journals/stb60.pdf
- Putnam, R. D., Leonardi, R., & Nanetti, R. Y. (1994). Making democracy work: Civic traditions in modern Italy. Princeton University Press.
- Romer, P. (1986). Increasing returns and long-run growth. Journal of Political Economy, 94(5), 1002–1037. https://doi.org/10.1086/261420
- Romer, P. (2003). The soft revolution: Achieving growth by managing intangibles. In J. R. M. Hand. & B. Lev (Eds.), Intangible assets, values, measures, and risks (pp. 63–94). Oxford University Press.
- Schiuma, G., Lerro, A. L., & Carlucci, D. C. (2008). The knoware tree and the regional intellectual capital index an assessment within Italy. Journal of Intellectual Capital, 9(2), 283–300. https://doi.org/10.1108/14691930810870346
- Ståhle, P., Ståhle, S., & Lin, C. Y. (2015). Intangibles and national economic wealth - a new perspective on how they are linked. Journal of Intellectual Capital, 16(1), 20–57. https://doi.org/10.1108/JIC-02-2014-0017
- Suriñach, J., & Moreno, R. (2011). The role of intangible assets in the regional economic growth. Investigaciones Regionales 20, 165–193. https://ideas.repec.org/a/ris/invreg/0048.html
- Suriñach, J., & Moreno, R. (2012). Introduction: Intangible assets and regional economic growth. Regional Studies, 46(10), 1277–1281. https://doi.org/10.1080/00343404.2012.735087
- Tóth, B. I. (2015). Territorial capital: Theory, empirics and critical remarks. European Planning Studies, 23(7), 1327–1344. https://doi.org/10.1080/09654313.2014.928675
- Velibeyoglu, K., & Yigitcanlar, T. (2010). An evaluation methodology for the tangible and intangible assets of city-regions: The 6K1C framework. International Journal of Services Technology and Management, 14(4), 343–359. https://doi.org/10.1504/IJSTM.2010.035783
- Yoo, S.-H. (2003). Does information technology contribute to economic growth in developing countries? A cross-country analysis. Applied Economics Letters, 10(11), 679–682. https://doi.org/10.1080/1350485032000138971
